Chapter 1-2021 Accountability Overview
←
→
Page content transcription
If your browser does not render page correctly, please read the page content below
2021 Accountability Manual

Chapter 1—2021 Accountability Overview
About this Manual
The 2021 Accountability Manual is a technical guide that explains how the Texas Education Agency (TEA)
uses the accountability system to evaluate the academic performance of Texas public schools. The
manual describes the accountability system and explains how TEA processes information from different
sources to produce 2021 accountability data reports.
The 2021 Accountability Manual attempts to address all possible scenarios; however, because of the
number and diversity of districts and campuses in Texas, there could be unforeseen circumstances that
are not anticipated in the manual. If a data source used to determine district or campus performance is
unintentionally affected by unforeseen circumstances, including natural disasters or test administration
issues, the commissioner of education will consider those circumstances and their impact in determining
whether or how that data source will be used to assign accountability ratings and award distinction
designations. In such instances, the commissioner will interpret the manual as needed to assign the
appropriate ratings and/or award distinction designations that preserve both the intent and the integrity
of the accountability system.

Accountability Advisory Groups
Educators, school board members, business and community representatives, professional organizations,
and legislative representatives from across the state have been instrumental in developing the current
accountability system.
Accountability Technical Advisory Committee (ATAC) includes representatives from school districts,
charter schools, and regional education service centers (ESCs). Members made recommendations to
address technical issues for 2021 accountability.
Accountability Policy Advisory Committee (APAC) includes representatives from legislative offices,
school districts, charter schools, and the business community. Members made recommendations to
address policy issues for 2021 accountability.
The commissioner considered all proposals and released the 2021 Academic Accountability System
Framework in February 2021.
The accountability development proposals and supporting materials that were reviewed and discussed
at each advisory group meeting are available online at https://tea.texas.gov/texas-
schools/accountability/academic-accountability/performance-reporting/2021-accountability-
development-materials.

Overview of the 2021 Accountability System
The overall design of the accountability system evaluates performance according to three domains:
Student Achievement evaluates performance across all subjects for all students, on both general and
alternate assessments, College, Career, and Military Readiness (CCMR) indicators, and graduation rates.
School Progress measures district and campus outcomes in two areas: the number of students that
grew at least one year academically (or are on track) as measured by STAAR results and the achievement
of all students relative to districts or campuses with similar economically disadvantaged percentages.
Closing the Gaps uses disaggregated data to demonstrate differentials among racial/ethnic groups,
socioeconomic background and other factors. The indicators included in this domain, as well as the

Chapter 1—2021 Accountability Overview
2021 Accountability Manual

domain’s construction, align the state accountability system with the Elementary and Secondary
Education Act (ESEA), as amended by the Every Student Succeeds Act (ESSA).

Who is Rated?
Districts and campuses with students enrolled in the fall of the 2020–21 school year are assigned a state
accountability rating.

Districts
Beginning the first year they report fall enrollment, school districts and charter schools are rated based
on the aggregate results of students in their campuses. Districts without any students enrolled in the
grades for which STAAR assessments are administered (3–12) are assigned the rating label of Not Rated.
State-administered school districts, including Texas School for the Blind and Visually Impaired, Texas
School for the Deaf, Texas Juvenile Justice Department, and Windham School District are not assigned a
state accountability rating.

Campuses
Beginning the first year they report fall enrollment, campuses and open-enrollment charter schools,
including alternative education campuses (AECs), are rated based on the performance of their students.
For the purposes of assigning accountability ratings, campuses that do not serve any grade level for
which the STAAR assessments are administered are paired with campuses in their district that serve
students who take STAAR. Please see “Chapter 7—Other Accountability System Processes” for
information on pairing.

Rating Labels
Districts and campuses receive an overall rating, as well as a rating for each domain. The rating labels
for districts and campuses are as follows.
•   A, B, C, or D: Assigned for overall performance and for performance in each domain to districts and
    campuses (including those evaluated under alternative education accountability AEA) that meet the
    performance target for the letter grade
•   F: Assigned for overall performance and for performance in each domain to districts and campuses
    (including AEAs) that do not meet the performance target to earn at least a D.
•   Not Rated indicates that a district or campus does not receive a rating for one or more of the
    following reasons:
            o   The district or campus has no data in the accountability subset.
            o   The district or campus has insufficient data to assign a rating.
            o   The district operates only residential facilities.
            o   The campus is a juvenile justice alternative education program (JJAEP).
            o   The campus is a disciplinary alternative education program (DAEP).
            o   The campus is a residential facility.
            o   The commissioner otherwise determines that the district or campus will not be rated.
•   Not Rated: Data Integrity Issues indicates data accuracy or integrity have compromised
    performance results, making it impossible to assign a rating. The assignment of a Not Rated: Data
    Integrity Issues label may be permanent or temporary, pending investigation.

                                                                    Chapter 1—2021 Accountability Overview
2021 Accountability Manual
• Not Rated: Annexation indicates that the campus is in its first school year after annexation by
another district and, therefore, is not rated, as allowed by the annexation agreement with the
agency.
• Not Rated: Declared State of Disaster indicates that extraordinary public health and safety
circumstances inhibited the ability of the state to accurately measure district and campus
performance. Notwithstanding any other provision of this 2021 Accountability Manual, the 2021
rating label that is issued to all districts and campuses is Not Rated: Declared State of Disaster.
See Chapter 9 for more information on how these ratings impact sanctions and interventions.
Single-Campus Districts
A school district or charter school comprised of only one campus that shares the same 2021
performance data with its only campus must meet the performance targets required for the campus to
demonstrate acceptable performance. For these single-campus school districts and charter schools, the
2021 performance targets applied to the campus are also applied to the district, ensuring that both the
district and campus receive identical ratings. School districts or charter schools that meet the definition
above are considered single-campus districts or charter schools in any criteria outlined in this manual.
Distinction Designations
Districts and campuses that receive accountability ratings of A, B, C, or D are eligible to earn distinction
designations. Distinction designations are awarded for achievement in several areas and are based on
performance relative to a group of campuses of similar type, size, grade span, and student
demographics. Districts are eligible for a distinction designation in postsecondary readiness. Please see
“Chapter 6—Distinction Designations” for more information.
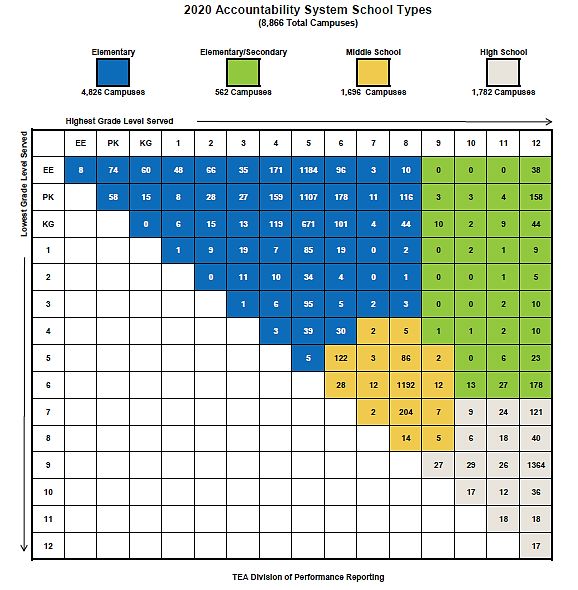
2021 Accountability System School Types
Every campus is labeled as one of four school types according to its grade span based on 2020–21
enrollment data reported in the fall TSDS PEIMS submission. The four types—elementary school, middle
school, elementary/secondary (also referred to as K–12), and high school—are illustrated by the table
on the following page. The table shows every combination of grade levels served by campuses in Texas
and the number of campuses that serve each of those combinations. The shading indicates the
corresponding school type.
To find out how a campus that serves a certain grade span is labeled, find the lowest grade level
reported as being served by that campus along the leftmost column and the highest grade level
reported as being served along the top row. The shading of the cell where the two grade levels intersect
indicates which of the four school types that campus is considered. The number inside the cell indicates
how many campuses in Texas served that grade span in 2019–20.
Chapter 1—2021 Accountability Overview2021 Accountability Manual
Chapter 1—2021 Accountability Overview2021 Accountability Manual
2021 STAAR-Based Indicators
Accountability Subset Rule
A subset of assessment results is used to calculate each domain. The calculation includes only
assessment results for students enrolled in the district or campus in a previous fall, as reported on the
TSDS PEIMS October snapshot. Three assessment administration periods are considered for
accountability purposes:
STAAR results are included in the subset of if the student was enrolled in the
district/campus accountability district/campus on this date:
EOC fall 2020 administration
EOC spring 2021 administration October 2020 enrollment snapshot
Grades 3–8 spring 2021 administration
The 2021 accountability subset rules apply to the STAAR performance results evaluated across all three
domains.
• Grades 3–8: districts and campuses are responsible for students reported as enrolled in the fall
(referred to as October snapshot) in the spring assessment results.
• End-of-Course (EOC): districts and campuses are responsible for
o fall 2020 results for students reported as enrolled in the October 2020 snapshot; and
o spring 2021 results for students reported as enrolled in the October 2020 snapshot.
STAAR Retest Performance
The opportunity to retest is available to students who have taken EOC assessments in any subject.
• EOC retesters are counted as passers based on the passing standard in place when they were first
eligible to take any EOC assessment.
• A district may retest a student who achieves the Approaches Grade Level standard on an English I
EOC assessment or an Algebra I EOC assessment in order to provide an opportunity for the student
to achieve the Meets Grade Level or Masters Grade Level standard only under the following
conditions:
o the student is in ninth grade;
o the student first takes the EOC during the December administration; and
o the student retakes the EOC during the spring administration immediately following the
December administration during which the student first took the assessment.
In this case, the best result from both administrations is found for each subject retested. Second, the
accountability subset rules determine whether the result is included in accountability. If all results have
the same level of performance, then the most recent result is selected for calculation. The following
charts provide examples of how the accountability subset is applied to EOC retesters.
Chapter 1—2021 Accountability Overview2021 Accountability Manual
Accountability Subset Examples for EOC Retesters
Enrolled Tested Tested
October 2020 Snapshot Fall 2020 Spring 2021
Campus A Campus A Campus A
The best result is selected. Each result meets the accountability subset rule.
For students who enrolled and tested at a different district or campus during the 2020–21 school year,
the student’s single best result for each EOC is selected. The best result is found for performance and
progress, considered separately. If all results have the same level of performance, the most recent result
is selected for calculations. The selected result is only applied to the district and campus that
administered the assessment if the student meets the accountability subset rule (discussed above).
Enrolled Tested Tested
October 2020 Snapshot Fall 2020 Spring 2021
Campus A Campus A Campus B
The best result is selected. Only the fall 2020 result meets the accountability subset rule. If spring
2021 was selected as the best result, the result would not meet the accountability subset rule for
inclusion at Campus A or Campus B.
SAT/ACT Inclusion—Accountability Subset
The SAT/ACT accountability subset rules determine to which district and campus an accelerated tester’s
SAT/ACT result is attributed for accountability. Please see Chapter 2 for additional information on
accelerated testers and the inclusion of SAT/ACT results.
Chapter 1—2021 Accountability Overview2021 Accountability Manual
2021 TSDS PEIMS-Based Indicators
One of the primary sources for data used in the accountability system is the Texas Student Data System
(TSDS) PEIMS data collection. The TSDS PEIMS data collection has a prescribed process and timeline that
offer school districts the opportunity to correct data submission errors or data omissions discovered
following the initial data submission. TSDS PEIMS data provided by school districts and used to create
specific indicators are listed below.
TSDS PEIMS data used for accountability indicators Data for
4-year Longitudinal Graduation Rate Class of 2020
5-year Longitudinal Graduation Rate Class of 2019
6-year Longitudinal Graduation Rate Class of 2018
Annual Dropout Rate
Graduate with Completed IEP and Workforce Readiness 2019–20
school year
Graduate Under an Advanced Diploma Plan and be Identified as a Current
Special Education Student
Earn an Industry-Based Certification
Earned during
Complete College Prep Course
2019–20,
2018–19, 2017–18,
Dual Credit Course Completion
and 2016–17
school years
Earn an Associate Degree
2021 Other Indicators
The CCMR component of the accountability system includes data from ACT, Advanced Placement (AP),
International Baccalaureate (IB), SAT, Texas Success Initiative (TSI) assessment results, OnRamps, and
Level I and Level II certificates.
Other data used for
Data reported for
College, Career, and Military Readiness
Tests as of July 2020 administration
ACT college admissions test (2019–20, 2018–19, 2017–18, and 2016–17
school years)
Chapter 1—2021 Accountability Overview2021 Accountability Manual
Other data used for Data reported for
College, Career, and Military Readiness
Tests as of May 2020 administration
AP examination (2019–20, 2018–19, 2017–18, and 2016–17
school years)
Tests as of May 2020 administration
IB examination (2019–20, 2018–19, 2017–18, and 2016–17
school years)
TSI assessment Tests from June 2011 to October 2020 administration
Tests as of June 2020 administration
SAT college admissions test (2019–20, 2018–19, 2017–18, and 2016–17
school years)
Courses completed during the 2019–20,
OnRamps dual enrollment course completion 2018–19, 2017–18, and 2016–17
school years
Certificates earned during the 2019–20,
2018–19, 2017–18, and 2016–17
Level I and Level II certificates
school years
Due to discrepancies between annual enlistment counts for Texas military enlistees aged 17-19 released
by the United States Department of Defense and TSDS PEIMS military enlistment data for 2017 and 2018
annual graduates, military enlistment data is excluded from accountability calculations until such data
can be obtained directly from the United States Armed Forces.
Ensuring Data Integrity
Accurate data is fundamental to accountability ratings. The system depends on the responsible
collection and submission of assessment and TSDS PEIMS information by school districts and charter
schools. Responsibility for the accuracy and quality of data used to determine district and campus
ratings, therefore, rests with local authorities. An appeal that is solely based on a district’s submission of
inaccurate data will likely be denied.
Because accurate and reliable data are the foundation of the accountability system, TEA has established
several steps to protect the quality and integrity of the data and the accountability ratings that are
based on that data.
• Campus Number Tracking: Requests for campus number changes may be approved with
consideration of prior state accountability ratings. Ratings of D, F, or Improvement Required for the
same campus assigned two different campus numbers may be considered as consecutive years of
unacceptable ratings for accountability interventions and sanctions, if the commissioner determines
this is necessary to preserve the integrity of the accountability system.
• Data Validation System: Data Validation is a data‐driven system designed to confirm the integrity of
district submitted data. Annual data validation analyses examine districts’ leaver and dropout data,
student assessment data, discipline data and may also validate other district submitted data.
Districts identified with potential data integrity concerns engage in a process to either validate the
Chapter 1—2021 Accountability Overview2021 Accountability Manual
accuracy of their data or determine that erroneous data were submitted. This process is
fundamental to the integrity of all the agency’s evaluation systems. For more information, see the
Data Validation Manuals on the PBM website at http://tea.texas.gov/pbm/DVManuals.aspx.
• Test Security: As part of ongoing efforts to improve security measures surrounding the assessment
program, TEA uses a comprehensive set of test security procedures designed to assure parents,
students, and the public that assessment results are meaningful and valid. Among other measures,
districts are required to implement seating charts during all administrations, conduct annual training
for all testing personnel, and maintain certain test administration materials for five years. Detailed
information about test security policies for the state assessment program is available online at
https://txassessmentdocs.atlassian.net/wiki/spaces/ODCCM/pages/191694176/Security.
• Not Rated: Data Integrity Issues: This rating is used when the accuracy and/or integrity of
performance results have been compromised, preventing the assignment of a rating. TSDS PEIMS
data submitted by districts, such as military enlistment data, are subject to audit at the discretion of
the agency. Results of an audit may lead to corrective action plans, revised accountability ratings, or
possible investigations under TEC, Section 39.057, and consequent actions and interventions under
that section and TEC, Chapter 39A. This label may be assigned temporarily pending an on-site
investigation or may be the final rating for the year. It is not equivalent to an F rating, though the
commissioner of education has the authority to lower a rating or assign an F rating due to data
quality issues. A Not Rated: Data Integrity Issues rating does not break the chain of consecutive
years of unacceptable accountability ratings for accountability sanctions and interventions purposes.
All districts and campuses with a final rating label of Not Rated: Data Integrity Issues are
automatically subject to desk audits the following year.
These steps can occur either before or after the ratings release, and sanctions can be imposed at any
time. To the extent possible, ratings are finalized when updated ratings are released following the
resolution of appeals. A rating change resulting from an imposed sanction will stand as the final rating
for the year.
Chapter 1—2021 Accountability Overview2021 Accountability Manual
Chapter 2—Student Achievement Domain
Overview
The Student Achievement domain evaluates district and campus performance based on student
achievement in three areas: performance on STAAR assessments, College, Career, and Military
Readiness (CCMR) indicators, and graduation rates. For 2021, component raw scores will be displayed;
neither raw nor scaled scores are calculated for the Student Achievement domain.
STAAR Component
The STAAR component of the Student Achievement domain calculation uses a methodology in which
scores are calculated based on students’ level of performance at Approaches Grade Level or above,
Meets Grade Level or above, and Masters Grade Level standards.
STAAR Component—Assessments Evaluated
The Student Achievement domain evaluates STAAR (with and without accommodations) and STAAR
Alternate 2 for grades 3–8, English learner (EL) performance measure results, end-of-course (EOC) in all
subject areas, and SAT/ACT results for accelerated testers as described later in this chapter.
English Learner Performance
STAAR Assessments (with
STAAR Alternate 2 Measure
Standard and without
Assessments (Second Year in U.S. Schools
accommodations)
Only)
Approaches
Approaches Grade Level or Approaches Grade Level or
Grade Level or Level II Satisfactory or above
above above
above
Meets Grade Meets Grade Level or
Level II Satisfactory or above Meets Grade Level or above
Level or above above
Masters Grade
Masters Grade Level Level III Accomplished Masters Grade Level
Level
STAAR Component—Students Evaluated
All students, including ELs as described below, are evaluated as one group.
STAAR Component—Inclusion of English Learners
ELs who are year one in U.S. schools are excluded from accountability performance calculations. ELs
who are in their second year in U.S. schools are included in accountability for 2021. ELs who are in their
second year in U.S. schools are included in the STAAR component using the EL performance measure.
ELs who are in their second year in U.S. schools who have a parental denial for EL services do not receive
an EL performance measure and are included in the same manner as non-ELs. STAAR Alternate 2
assessment results are included regardless of an EL’s years in U.S. schools.
Unschooled asylees, unschooled refugees, and students with interrupted formal education (SIFEs) are
included in state accountability beginning with their second year of enrollment in U.S. schools.
STAAR Component—Minimum Size Criteria and Small Numbers Analysis
• All students are evaluated in the STAAR component if there are 10 or more STAAR assessments, EL
performance measures, and/or SAT/ACT results combined across all subjects.
• Small numbers analysis is not used in the STAAR component.
Chapter 2—Student Achievement Domain2021 Accountability Manual
Inclusion of SAT/ACT Results for Accelerated Testers
As part of the Every Student Succeeds Act (ESSA) Plan 2021 Addendum, TEA requested to delay the
implementation of the accelerated testers requirement until August 2022. If that request is granted, TEA
will not include the results for accelerated testers in 2021 data. TEA will begin the inclusion of grade 12
accelerated testers’ SAT/ACT results with the 2022 accountability cycle.
If the request is denied, the STAAR component of the Student Achievement domain calculation will
include SAT and/or ACT results for accelerated testers as described in this chapter. Accelerated testers
are defined as students who complete a STAAR EOC at the Approaches Grade Level or above standard in
Algebra I, English II, and/or Biology prior to grade 9.
SAT/ACT Inclusion—Assessments Evaluated
The Student Achievement domain includes SAT and/or ACT results for accelerated testers in the STAAR
component in the subject areas of English language arts (ELA)/reading, mathematics, and science at the
standards provided below.
SAT Evidence-
Based Reading ACT English and
Standard SAT Math ACT Math ACT Science
and Writing Reading
(EBRW)
Approaches
Grade Level 410 – 470 440 – 520 27 – 33 16 – 20 16 – 22
or above
Meets Grade
Level or 480 – 660 530 – 680 34 – 59 21 – 29 23 – 27
above
Masters
670 – 800 690 – 800 60 – 72 30 – 36 28 – 36
Grade Level
SAT/ACT Inclusion—Students Evaluated
Accelerated testers have a corresponding subject-area SAT or ACT result included for the accountability
cycle in which the student is reported as enrolled in grade 12 on the TSDS PEIMS October snapshot.
SAT/ACT Inclusion—Methodology
SAT/ACT assessment results at or above the scores provided in the chart above are included in the
STAAR component of the Student Achievement domain at the following levels:
• Approaches Grade Level or above
• Meets Grade Level or above
• Masters Grade Level
The agency evaluates SAT/ACT results from grades 9–12 for the accelerated subject area once the
accelerated tester is reported as enrolled in grade 12. If an accelerated tester has more than one
corresponding subject-area SAT and/or ACT result across evaluated years, the best result from either
SAT or ACT is found for each accelerated subject tested. ACT results considered include assessments
from enrolled grade 9 through the April 2021 administration, and SAT results considered include
assessments from enrolled grade 9 through the May 2021 administration.
Chapter 2—Student Achievement Domain2021 Accountability Manual
SAT/ACT Inclusion—Accountability Subset
The SAT/ACT accountability subset rules determine to which district and campus the accelerated tester’s
SAT/ACT result is attributed for accountability. The SAT/ACT result for an accelerated tester is attributed
to the district and campus at which the student is reported as enrolled in grade 12 on the TSDS PEIMS
October snapshot for that accountability cycle. SAT/ACT results are attributed to that campus without
regard to the campus at which the student took the corresponding STAAR EOC before grade 9 or the
enrolled campus at the time of SAT/ACT administration.
STAAR Component—Methodology
One point is given for each percentage of assessment results that are at or above the following:
• Approaches Grade Level or above
• Meets Grade Level or above
• Masters Grade Level
The STAAR component score is calculated by dividing the total points (cumulative performance for the
three performance levels) by three resulting in an overall score of 0 to 100 for all districts and campuses.
The percentage by performance level and STAAR component score are rounded to the nearest whole
number.
Example Calculation: STAAR Component Score
Math- Social
STAAR Performance Reading Writing Science Totals Percentages
ematics Studies
Number of Assessments 480 432 101 330 274 1617
Approaches Grade Level
300 298 50 143 87 878 54%
or Above
Meets Grade Level or
200 170 40 45 76 531 33%
Above
Masters Grade Level 100 165 9 41 22 337 21%
Total Percentage Points 108
Student Achievement Domain STAAR Component Score
36
(Total Percentage Points ÷ 3)
College, Career, and Military Readiness Component
The College, Career, and Military Readiness (CCMR) component of the Student Achievement domain
measures graduates’ preparedness for college, the workforce, or the military. The Student Achievement
CCMR denominator consists of 2020 annual graduates. Annual graduates are students who graduate
from a district or campus in a school year regardless of cohort. This is separate from, and may include
different students than, the longitudinal graduation cohorts. Annual graduates demonstrate college,
career, or military readiness in any one of the following ways:
Chapter 2—Student Achievement Domain2021 Accountability Manual
• Meet Texas Success Initiative (TSI) Criteria in ELA/Reading and Mathematics. A graduate meeting the
TSI college readiness standards in both ELA/reading and mathematics; specifically, meeting the
college-ready criteria on the TSI assessment, SAT, ACT, or by successfully completing and earning
credit for a college prep course as defined in TEC §28.014, in both ELA and mathematics. The
assessment results considered include TSI assessments through October 2020, SAT and ACT results
through the July 2020 administration, and course completion data via TSDS PEIMS. See Appendix H
for additional information.
A graduate must meet the TSI requirement for both reading and mathematics but does not
necessarily need to meet them on the same assessment. For example, a graduate may meet the TSI
criteria for college readiness in ELA/reading on the SAT and complete and earn credit for a college
prep course in mathematics.
• Earn Dual Course Credits. A graduate completing and earning credit for at least three credit hours in
ELA or mathematics or at least nine credit hours in any subject. See Appendix H for additional
information.
• Meet Criteria on Advanced Placement (AP)/International Baccalaureate (IB) Examination. A graduate
meeting the criterion score on an AP or IB examination in any subject area. Criterion score is 3 or
higher for AP and 4 or higher for IB.
• Earn an Associate Degree. A graduate earning an associate degree by August 31 immediately
following high school graduation.
• Complete an OnRamps Dual Enrollment Course. A graduate completing an OnRamps dual enrollment
course and qualifying for at least three hours of university or college credit in any subject area. See
Appendix H for additional information.
• Earn an Industry-Based Certification. A graduate earning an industry-based certification under 19
TAC §74.1003.
• Graduate with Completed Individualized Education Program (IEP) and Workforce Readiness. A
graduate receiving a graduation type code of 04, 05, 54, or 55, which indicates the student has
completed his/her IEP and has either demonstrated self-employment with self-help skills to
maintain employment or has demonstrated mastery of specific employability and self-help skills that
do not require public school services.
• *Enlist in the Armed Forces. A graduate enlisting in the U.S. Army, Navy, Air Force, Coast Guard, or
Marines.
• Graduate Under an Advanced Diploma Plan and be Identified as a Current Special Education Student.
A graduate who is identified as receiving special education services during the year of graduation
and whose graduation plan type is identified as a Recommended High School Plan (RHSP),
Distinguished Achievement Plan (DAP), Foundation High School Plan with an Endorsement (FHSP-E),
or Foundation High School Plan with a Distinguished Level of Achievement (FHSP-DLA).
• Earn a Level I or Level II Certificate. A graduate earning a level I or level II certificate in any workforce
education area. See Appendix D or H for additional information.
*Due to discrepancies between annual enlistment counts for Texas military enlistees aged 17–19
released by the United States Department of Defense and TSDS PEIMS military enlistment data for 2017
and 2018 annual graduates, military enlistment data is excluded from accountability calculations until
such data can be obtained directly from the United States Armed Forces.
Chapter 2—Student Achievement Domain2021 Accountability Manual
College, Career, and Military Readiness Component—Students Evaluated
All students are evaluated as one group.
College, Career, and Military Readiness Component—Minimum Size Criteria and
Small Numbers Analysis
• All students are evaluated in the CCMR component if there are at least 10 annual graduates.
• Small numbers analysis, as described below, applies to all students if the number of annual
graduates is fewer than 10.
o A three-year average CCMR rate is calculated for all students. The calculation is based on an
aggregated three-year uniform average using the district’s or campus’s 2021, 2020, and 2019
CCMR data.
o The all students group is evaluated if the three-year sum has at least 10 annual graduates.
College, Career, and Military Readiness Component—Methodology
One point is given for each annual graduate who accomplishes any one of the CCMR indicators. The
CCMR component is calculated by dividing the total points (cumulative number of CCMR graduates) by
the number of annual graduates. The CCMR component score is rounded to the nearest whole number.
Number of Graduates Who Accomplished at Least One of the CCMR Indicators
Number of 2020 Annual Graduates
Example Calculation: CCMR Component Score
Number of Graduates Who Accomplished at Least One of Number of 2020
the CCMR Indicators Annual Graduates
Total 208 365
Student Achievement Domain CCMR Component Score
(Number of Graduates Who Accomplished at Least One of the CCMR Indicators ÷ Number of 57
2020 Annual Graduates)
Graduation Rate (or Annual Dropout Rate) Component
Graduation Rate Component
The graduation rate component of the Student Achievement domain includes the four-year, five-year,
and six-year high school graduation rates or the annual dropout rate if no graduation rate is available.
The total points and the maximum number of points are reported for the four-year, five-year, and six-
year graduation rate. The graduation rate that results in the higher score is used to calculate the
graduation rate score.
• Class of 2020 four-year graduation rate is calculated for districts and campuses if they: (a) served
grade 9, as well as grade 11 or 12, in the first and fifth years of the cohort or (b) served grade 12 in
the first and fifth years of the cohort.
• Class of 2019 five-year graduation rate follows the same cohort of students for one additional year.
• Class of 2018 six-year graduation rate follows the same cohort of students for two additional years.
• Annual dropout rate for school year 2019–20 for grades 9–12 is used if a campus has students
enrolled in grade 9, 10, 11, or 12 but does not have a four-year, five-year, or six-year graduation
Chapter 2—Student Achievement Domain2021 Accountability Manual
rate. This proxy for the graduation rate is calculated by converting the grade 9–12 annual dropout
rate into a positive measure. Please see Annual Dropout Rate—Conversion on the following pages.
Graduation Rate—Students Evaluated
All students are evaluated as one group.
Graduation Rate—Minimum Size Criteria and Small Numbers Analysis
• All Students are evaluated if there are at least 10 students in the class.
• Small numbers analysis, as described below, applies to all students if the number of students in the
Class of 2020 (4-year), Class of 2019 (5-year), or Class of 2018 (6-year) is fewer than 10. The total
number of students in the class consists of graduates, continuing students, Texas high school
equivalency certificate (TxCHSE) recipients, and dropouts.
o A three-year-average graduation rate is calculated for all students. The calculation is based on
an aggregated three-year uniform average.
o The all students group is evaluated if the three-year sum has at least 10 students.
Graduation Rate—Methodology
The four-year graduation rate follows a cohort of first-time students in grade 9 through their expected
graduation three years later. The five-year graduation rate follows the same cohort of students for one
additional year. The six-year graduation rate follows the same cohort of students for two additional
years. A cohort is defined as the group of students who begin grade 9 in Texas public schools for the first
time in the same school year plus students who, in the next three school years, enter the Texas public
school system in the grade level expected for the cohort. Students who transfer out of the Texas public
school system over the four, five, or six years for reasons other than graduating, receiving a TxCHSE, or
dropping out are removed from the class.
The four-year, five-year, and six-year graduation rate measures the percentage of graduates in a class.
The graduation rates are expressed as a percentage rounded to one decimal place. For example,
74.875% rounds to 74.9%, not 75%.
Number of Graduates in the Class
Number of Students in the Class
(Graduates + Continuers + TxCHSE Recipients + Dropouts)
The total points and the maximum number of points are reported for the four-year, five-year, and six-
year graduation rate. The graduation rate that results in the highest score is used to calculate the
graduation rate score.
Example Calculation: Graduation Rate
Graduation Rate All Students
Class of 2020, 4-year 85.2%
Class of 2019, 5-year 87.3%
Class of 2018, 6-year 85.0%
Graduation Rate Score
87.3
(Highest of 4-year, 5-year & 6-year graduation rate)
Chapter 2—Student Achievement Domain2021 Accountability Manual
Annual Dropout Rate Component
For districts and campuses that serve students enrolled in grades 9–12, the grade 9–12 annual dropout
rate is used if a four-year, five-year, or six-year graduation rate is not available.
Annual Dropout Rate—Students Evaluated
All students are evaluated as one group.
Annual Dropout Rate—Minimum Size Criteria and Small Numbers Analysis
• All Students are evaluated if there are at least 10 students enrolled during the school year.
• Small numbers analysis, as described below, applies to the group of all students if the number of
students enrolled in grades 9–12 during the 2019–20 school year is fewer than 10.
o A three-year-average annual dropout rate is calculated for all students. The calculation is based
on an aggregated three-year uniform average.
o The all students group is evaluated if the three-year sum has at least 10 students.
Annual Dropout Rate—Methodology
The annual dropout rate is calculated by dividing the number of students in grades 9–12 designated as
having dropped out by the number of students enrolled in grades 9–12 at any time during the 2019–20
school year. Grade 9–12 annual dropout rates are expressed as a percentage rounded to one decimal
place. For example, 24 dropouts divided by 2,190 students enrolled in grades 9–12 is 1.095% which
rounds to a 1.1% annual dropout rate.
Annual Dropout Rate—Conversion
Because the annual dropout rate is a measure of negative performance—the rate rises as performance
declines—it must be transformed into a positive measure to be used as a component of the Student
Achievement domain. The following calculation converts the annual dropout rate for a non-AEA district
or campus into a positive measure that is a proxy for the graduation rate.
100 – (grade 9–12 annual dropout rate x 10) with a floor of zero
The multiplier of 10 allows the non-AEA district or campus to accumulate points towards the Student
Achievement domain score only if its annual dropout rate is less than 10 percent.
For example, a 1.1% annual dropout rate conversion calculation is: 100 – (1.1 x 10) = 100 – 11 = 89.
The annual dropout rate calculation requires at least a three-year average of 10 students per class.
Alternative Education Accountability Modifications
Alternative procedures applicable to the graduation rate and annual dropout rate calculations are
provided for approved campuses and charter schools serving at-risk students in alternative education
programs. The annual dropout rate is used on a safeguard basis only for campuses designated as
dropout recovery schools (DRS). The Student Achievement domain for DRS without a longitudinal
graduation rate is calculated using STAAR, CCMR, and the annual dropout rate; it is also calculated using
only the STAAR and CCMR components. Whichever calculation produces the higher rating is used. For
more information on the alternative education accountability (AEA) eligibility and DRS criteria, please
see “Chapter 7—Other Accountability System Processes.”
Chapter 2—Student Achievement Domain2021 Accountability Manual
AEA Graduation/Annual Dropout Rate—Methodology
The graduation rate calculation is modified to credit AEA campuses and charter schools for graduates,
continuing students (continuers), and TxCHSE recipients. The grade 9–12 annual dropout rate is used if
no combined graduation, continuer, and TxCHSE rate is available.
Number of Graduates + Continuers + TxCHSE Recipients in the Class
Number of Students in the Class
(Graduates + Continuers + TxCHSE Recipients + Dropouts)
• Class of 2020 four-year graduation, continuer, and TxCHSE rates are calculated for AEA campuses
and charter schools if they: (a) served grade 9, as well as grade 11 or 12, in the first and fifth years of
the cohort or (b) served grade 12 in the first and fifth years of the cohort.
• Class of 2019 five-year graduation, continuer, and TxCHSE rates follow the same cohort of students
for one additional year; therefore, most AEA campuses and charter schools that have a four-year
graduation, continuer, and TxCHSE rate in one year will have a five-year graduation, continuer, and
TxCHSE rate for that cohort in the following year.
• Class of 2018 six-year graduation, continuer, and TxCHSE rates continue to follow the same cohort
of students for one additional year; therefore, most AEA campuses and charter schools that have a
five-year graduation, continuer, and TxCHSE rate in one year will have a six-year graduation,
continuer, and TxCHSE rate for that cohort in the following year.
• Annual dropout rate for school year 2019–20 for grades 9–12. If an AEA charter school or campus
has students enrolled in grade 9, 10, 11, or 12 but does not have a four-year, five-year, or six-year
graduation, continuer, and TxCHSE rate, a proxy for the graduation rate is calculated by converting
the grade 9–12 annual dropout rate into a positive measure.
AEA Annual Dropout Rate—Conversion
The annual dropout rate conversion is also modified for AEA campuses and districts.
100 – (grade 9–12 annual dropout rate x 5) with a floor of zero
By using the multiplier of 5, an AEA charter or campus accumulates points towards the Student
Achievement domain score if its annual dropout rate is less than 20 percent.
For example, a 1.1% AEA annual dropout rate conversion calculation is: 100 – (1.1 x 5) = 100 – 5.5 = 94.5.
Chapter 2—Student Achievement Domain2021Accountability Manual
Chapter 3—School Progress Domain
Overview
The School Progress domain measures district and campus outcomes in two areas: the number of
students that grew at least one year academically (or are on track) as measured by STAAR results and
the achievement of students relative to districts or campuses with similar economically disadvantaged
percentages. For 2021, neither raw nor scaled scores are calculated for the School Progress domain.
School Progress, Part A: Academic Growth
In spring 2020, the U.S. Department of Education (USDE) granted Texas a waiver under section 8401(b)
of the Elementary and Secondary Education Act of 1965 (ESEA) of assessment, accountability and school
identification, and certain related reporting requirements for the 2019–20 school year. As a result of this
waiver, Texas does not have the data necessary (i.e., the prior year STAAR scaled score) to calculate
School Progress: Part A: Academic Growth. Therefore, School Progress: Part A: Academic Growth is not
calculated for 2021.
School Progress, Part B: Relative Performance
School Progress, Part B: Relative Performance measures the achievement of all students relative to
districts or campuses with similar economically disadvantaged percentages.
Part B: Relative Performance—Assessments Evaluated
School Progress, Part B evaluates STAAR (with and without accommodations), STAAR Alternate 2
assessment, and English learner (EL) performance measure results for grades 3–8 and EOC assessment
results in all subject areas.
Part B: Relative Performance—Students Evaluated
All students, including ELs as described below, are evaluated as one group.
Part B: Relative Performance—Inclusion of English Learners
ELs who are year one in U.S. schools are excluded from accountability performance calculations. ELs
who are in their second year in U.S. schools are included in the STAAR component using the EL
performance measure. ELs who are in their second year in U.S. schools who have a parental denial for EL
services do not receive an EL performance measure. STAAR Alternate 2 assessment results are included
regardless of an EL’s years in U.S. schools.
Unschooled asylees, unschooled refugees, and SIFEs are included in state accountability beginning with
their second year of enrollment in U.S. schools.
Part B: Relative Performance—Minimum Size Criteria and Small Numbers
Analysis
• The STAAR component is evaluated if there are 10 or more STAAR assessments, combined across all
subjects. Small numbers analysis is not used.
• All students are evaluated in the CCMR component if there are at least 10 annual graduates. Small
numbers analysis, as described below, applies to all students if the number of annual graduates is
fewer than 10.
Chapter 3—School Progress Domain2021 Accountability Manual
o A three-year-average CCMR rate is calculated for all students. The calculation is based on an
aggregated three-year uniform average using the district’s or campus’s 2021, 2020, and 2019
CCMR data.
o The all students group is evaluated if the three-year sum has at least 10 annual graduates.
Part B: Relative Performance—Methodology
Elementary and Middle Schools
For elementary and middle schools, School Progress, Part B evaluates the overall student performance
on the Student Achievement STAAR component compared to campuses with similar percentages of
economically disadvantaged students, as reported in the TSDS PEIMS October snapshot. The
economically disadvantaged percentage is rounded to one decimal place.
High Schools, K–12 Campuses, and Districts with CCMR Component
For high schools, K–12 campuses, and districts, School Progress, Part B evaluates the average of the
Student Achievement STAAR component and the CCMR component compared to districts or campuses
with similar percentages of economically disadvantaged students, as reported in the TSDS PEIMS
October snapshot. The economically disadvantaged percentage is rounded to one decimal place.
High Schools, K–12 Campuses, and Districts without CCMR Component
If CCMR outcomes are not available for a high school, K–12, and district, only the Student Achievement
STAAR component is used.
Alternative Education Accountability
Alternative education campuses and alternative education accountability charter schools are not
evaluated on School Progress, Part B due to the small number of districts and campuses available for
comparison.
Part B: Relative Performance Score
The Part B: Relative Performance score is either the raw Student Achievement STAAR component score
or the average of the raw Student Achievement STAAR and CCMR components, depending upon campus
type. The score is rounded to the nearest whole number. For 2021, only component raw scores are
displayed.
Chapter 3—School Progress Domain2021 Accountability Manual
Chapter 4—Closing the Gaps Domain
Overview
The Closing the Gaps domain uses disaggregated data to demonstrate differentials among racial/ethnic
groups, socioeconomic backgrounds, and other factors. The indicators included in this domain, as well as
the domain’s construction, align the state accountability system with the Every Student Succeeds Act
(ESSA). For 2021, component raw scores are displayed; neither raw nor scaled scores are calculated for
the Closing the Gaps domain.
Components
There are four components evaluated in the Closing the Gaps domain.
• Academic Achievement: STAAR Performance Status at the Meets Grade Level or above standard in
English language arts (ELA)/reading and mathematics
• Growth or Graduation
o Academic Growth Status: The School Progress, Part A domain data in reading and mathematics
for elementary and middle schools (unavailable for 2021)
o Federal Graduation Status: The four-year federal graduation rate (without exclusions) for high
schools, K–12s, and districts with graduation rates. If a high school, K–12, or district does not
have graduation data, Academic Growth Status is used, if available.
• English Language Proficiency
• School Quality or Student Success
o STAAR component of the Student Achievement domain for elementary and middle schools
o College, Career, and Military Readiness (CCMR) Performance Status component for high schools,
K–12s, and districts. If a high school, K–12, or district does not have CCMR data, STAAR
component is used, if available.
Minimum Size
A district or campus must have 10 reading and 10 mathematics assessment results for the all students
group and meet minimum size for at least five indicators in the Academic Achievement component to be
evaluated on the Closing the Gaps domain. If a district or campus does not meet minimum size, the
Closing the Gaps domain is not evaluated.
Students Evaluated
The Closing the Gaps domain evaluates performance of 14 student groups.
• All students
• Seven racial/ethnic groups: African American, American Indian, Asian, Hispanic, Pacific Islander,
white, and two or more races
• Economically disadvantaged
• Students receiving special education services
• Students formerly receiving special education services
• Current and monitored English learners (through year 4 of monitoring)
• Continuously enrolled
• Non-continuously enrolled
Chapter 4—Closing the Gaps Domain2021 Accountability Manual
Current and Former Special Education Students
A student is identified as a current special education student if the student receives special instruction
and related developmental, corrective, supportive, or evaluative services for the current school year as
reported in TSDS PEIMS or on STAAR answer documents.
A student is identified as formerly receiving special education services if in any of the preceding three
years, they were reported in TSDS PEIMS as receiving special instruction and related developmental,
corrective, supportive, or evaluative services, but in the current year, as reported through TSDS PEIMS
or on STAAR answer documents, are no longer participating in a special education program.
Current and Monitored English Learners (ELs)
A student is identified as current EL if the student is reported as Limited English Proficient (LEP) in TSDS
PEIMS, TELPAS, or STAAR answer documents. A student is identified as monitored EL if the student is
reported in TSDS PEIMS or on STAAR answer documents as having met the criteria for exiting a
bilingual/ESL program and is being monitored as required by 19 Texas Administrative Code, §89.1220(l).
Both current and monitored ELs, through year 4, are included in performance rates for the Closing the
Gaps domain. Exclusions for ELs are detailed in this chapter.
Continuously Enrolled and Non-Continuously Enrolled Students
District
For grades 4–12, a student is identified as continuously enrolled if the student was enrolled in the
district on the fall snapshot during the current school year and each of the three preceding years. For
grade 3, a student is identified as continuously enrolled if the student was enrolled in the same district
on the current year fall snapshot and each of the preceding two years.
If the enrollment requirement is not met, then the student is considered non-continuously enrolled.
Campus
For grades 4–12, a student is identified as continuously enrolled if the student was enrolled in the
campus on the fall snapshot during the current school year and in the same district each of the three
preceding years. For grade 3, a student is identified as continuously enrolled if the student was enrolled
in the campus on the current year fall snapshot and in the same district each of the preceding two years.
Example Campus Continuously Enrolled Determination (Grade 4–8)
Enrolled in Campus
Enrolled in District Enrolled in District Enrolled in District Continuously Enrolled
within District TSDS
TSDS PEIMS Snapshot TSDS PEIMS Snapshot TSDS PEIMS Snapshot or Non-continuously
PEIMS Snapshot
October 2017 October 2018 October 2019 Enrolled
October 2020
Yes Yes Yes Yes Continuously Enrolled
Non-continuously
Yes No Yes Yes
Enrolled
Non-continuously
No No Yes Yes
Enrolled
Inclusion of English Learners
English learners (ELs) who are year one in U.S. schools are excluded from accountability calculations. ELs
in their second year in U.S. schools are included in accountability calculations. The EL performance
measure is used to include ELs in their second year in U.S. schools in the Academic Achievement and
Student Achievement Domain Score: STAAR Component Only components. ELs in their second year in
Chapter 4—Closing the Gaps Domain2021 Accountability Manual
U.S. schools with a parental denial for EL services do not receive an EL performance measure. STAAR
Alternate 2 assessment results are included regardless of an EL’s years in U.S. schools.
Unschooled asylees, unschooled refugees, and students with interrupted formal education (SIFEs) are
included in state accountability beginning with their second year of enrollment in U.S. schools.
Academic Achievement Component
The Academic Achievement component measures STAAR performance in ELA/reading and mathematics
at the Meets Grade Level or above standard.
Academic Achievement—Assessments Evaluated
The Academic Achievement component evaluates STAAR (with and without accommodations), STAAR
Alternate 2results for grades 3–8, EL performance measure results for end-of-course (EOC) in
ELA/reading and mathematics, and SAT/ACT results for accelerated testers as described in Chapter 2 at
the Meets Grade Level or above standard.
Academic Achievement—Minimum Size Criteria and Small Numbers Analysis
• The all students group is evaluated if there are 10 or more assessments in the subject area,
considered separately.
• Student groups are evaluated if there are 25 or more assessments in the subject area, considered
separately.
• This component is evaluated if at least five student groups meet minimum size requirements.
• Small numbers analysis is not used.
Academic Achievement—Methodology
Each student group is evaluated by subject area on the percentage of assessment results that are at the
Meets Grade Level or above standard. Each student group’s performance is then compared to the 2021
Academic Achievement performance targets. The performance targets are provided at the end of this
chapter.
The Academic Achievement calculation is expressed as a percentage, rounded to the nearest whole
number. For example, 59.87% is rounded to 60%; 79.49% is rounded to 79%; and 89.5% is rounded to
90%.
Academic Growth Status or Federal Graduation Status
Academic Growth Status—2021 Accountability
Each student group is evaluated by subject area on the percentage of assessment results that
maintained performance from the prior year to the current year or meets the Expected or Accelerated
STAAR progress measure expectation. In spring 2020, the U.S. Department of Education (USDE) granted
Texas a waiver under section 8401(b) of the Elementary and Secondary Education Act of 1965 (ESEA) of
assessment, accountability and school identification, and certain related reporting requirements for the
2019–20 school year. As a result of this waiver from administering statewide assessments due to COVID-
19, Texas does not have the data necessary (i.e., the prior year STAAR scaled score) to calculate
academic growth.
Federal Graduation Status
The Federal Graduation Status component measures the four-year federal graduation rate of the Class
of 2020 for high schools, K–12s, and districts. Texas uses the National Center for Education Statistics
(NCES) dropout definition and the federal calculation for graduation rate.
Chapter 4—Closing the Gaps Domain2021 Accountability Manual
Four-Year Graduation Rate Target
Student groups will be evaluated against the four-year long-term target (94.0%), the four-year interim
target (90.0%) with a tenth of a percent improvement, or expected growth toward the four-year long-
term target using the calculation below.
current year four-year 94.0 (long-term target) –
graduation rate – prior prior year four-year
≥
year four-year graduation rate
graduation rate 10
Targets are provided at the end of this chapter. See Appendix H for more information.
Federal Graduation Status—Minimum Size Criteria and Small Numbers Analysis
All Students
• The all students group is evaluated if there are at least 10 students in the class.
• This component is evaluated if at least one student group meets minimum size requirements.
• Small numbers analysis, as described below, applies to the all students group if the number of
students in the Class of 2020 (4-year) is fewer than 10. The total number of students in the class
consists of graduates, continuing students, Texas certificate of high school equivalency (TxCHSE)
recipients, and dropouts.
o A three-year-average graduation rate is calculated for all students. The calculation is based on
an aggregated three-year uniform average.
o The all students group is evaluated if the three-year sum has at least 10 students.
Student Groups
• A student group is evaluated if there are at least 25 students from the group in the class.
• Small numbers analysis is not applied to student groups.
• The continuously enrolled, non-continuously enrolled, and former special education student groups
are not evaluated.
Federal Graduation Status—Methodology
The Federal Graduation Status component is calculated using the four-year federal graduation rate
without state exclusions. The four-year federal graduation rate follows a cohort of first-time students in
grade 9 through their expected graduation three years later. A cohort is defined as the group of students
who begin grade 9 in Texas public schools for the first time in the same school year plus students who, in
the next three school years, enter the Texas public school system in the grade level expected for the
cohort. Students who transfer out of the Texas public school system over the four years for reasons
other than graduating, receiving a TxCHSE, or dropping out are removed from the class.
The four-year federal graduation rate measures the percentage of graduates in a class. The graduation
rates are expressed as a percentage rounded to one decimal place. For example, 74.875% rounds to
74.9%, not 75%.
Number of Graduates in the Class
Number of Students in the Class
(Graduates + Continuers + TxCHSE Recipients + Dropouts)
To determine if the student group met the graduation rate indicator, the group’s four-year federal
graduation rate is evaluated using the following three steps.
Chapter 4—Closing the Gaps DomainYou can also read