Updated projections of COVID-19 in the EU/EEA and the UK
←
→
Page content transcription
If your browser does not render page correctly, please read the page content below
EE

                                                                                                 TECHNICAL REPORT
Updated projections of COVID-19 in the
EU/EEA and the UK
23 November 2020

     Executive summary
     Following widespread transmission of SARS-CoV-2 in the European Union (EU)/European Economic Area (EEA)
     countries and the United Kingdom (UK) over several weeks, the COVID-19 epidemic reached a peak in most of these
     countries in April or early May 2020. Following the implementation of non-pharmaceutical measures aimed at
     reducing contact rates between people, the number of confirmed cases and associated morbidity and mortality
     diminished sharply. In most countries, the intensity of these measures was subsequently lightened. By late October
     2020, a resurgence of cases was observed in EU/EEA countries and the UK. As this was accompanied by increased
     hospital and ICU admissions and deaths the increase is considered to be a consequence of increased transmission,
     not solely increased testing rates. As a result, many countries have taken steps to re-introduce more stringent control
     measures to once again reduce the contact rate between people.
     Mathematical modelling of SARS-CoV-2 transmission and associated COVID-19 disease is used to assess the potential
     progression of the epidemic within a population and to inform decision-making on potential interventions to ensure
     public health. The methodology inherently facilitates the quantification of uncertainty associated with these
     estimations and projections. In May 2020, ECDC produced a set of short-term forecasts of the expected number of
     COVID-19 cases, deaths and hospitalised cases (subdivided into general hospital wards and intensive care units).
     Updated forecasts were published in September 2020.
     In this report we present slightly longer-term projections for each country, up until 25 December 2020. We continue
     to model a baseline ‘status quo’ scenario, assuming all control measures in place in early November 2020 will be
     continued until the end of the projection period. However, we also include an alternative scenario which illustrates the
     potential impact on the number of cases, hospitalisations and deaths if the population returned to the behaviour they
     practised on 1 April 2020. We also illustrate the potential impact on hospitalisation rates if recently-implemented
     response measures are lifted before Christmas. The model is based on the epidemiological data and scientific
     evidence available at the time of publication. Further developments are anticipated as new information and
     epidemiological data become available.
     The model was developed at ECDC and applied at a national level for EU/EEA countries and the UK. Mathematical
     models provide a helpful approach for quantifying uncertainty but their output should be interpreted and appraised in
     light of both the underlying assumptions and the completeness and potential bias of the data used to parameterise
     and calibrate them.
     An assessment of the potential trajectory of disease and mortality caused by the COVID-19 pandemic, and the most
     appropriate response strategies, should be based on a comprehensive analysis of the specific epidemiological situation
     in each country, using modelling projections in context.

Suggested citation: European Centre for Disease Prevention and Control. Updated projections of COVID-19 in the EU/EEA and the UK.
23 November 2020. ECDC: Stockholm; 2020.
© European Centre for Disease Prevention and Control, Stockholm, 2020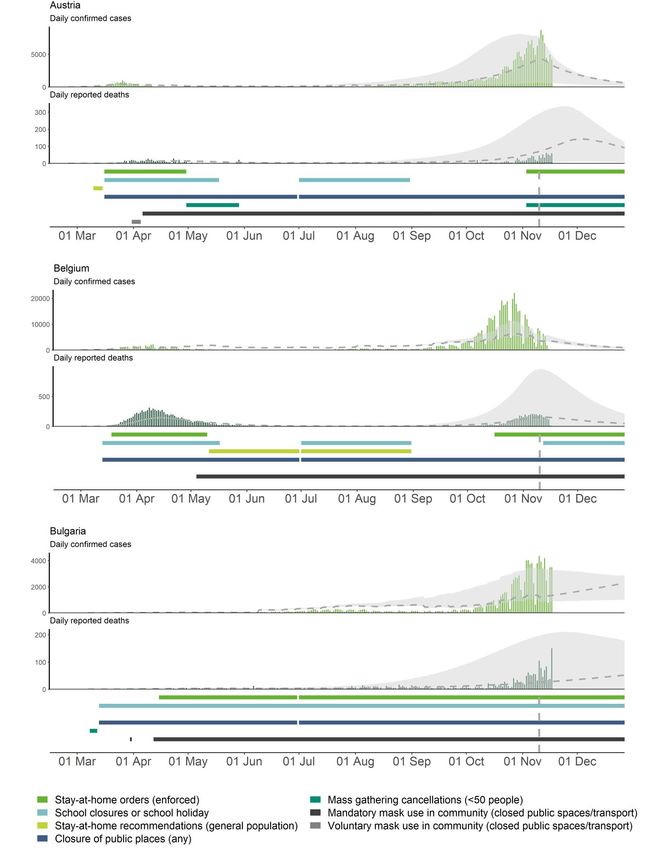
ECDC TECHNICAL REPORT                                                        Updated projections of COVID-19 in the EU/EEA and the UK

Introduction
SARS-CoV-2 is the causative agent of the current COVID-19 global pandemic, which began in December 2019.
Coronaviruses are transmitted in most instances through large respiratory droplets and direct human-to-human contact,
although other modes of transmission (e.g. airborne, faeco-oral and through fomites) have also been suggested. Severe
cases require treatment in hospital, while critical cases are treated in intensive care, commonly requiring respiratory
support or invasive mechanical ventilation. More information on the latest scientific developments is available from ECDC’s
regularly updated webpage1.
By March 2020, all European Union (EU)/European Economic Area (EEA) countries and the United Kingdom (UK) had
implemented a range of non-pharmaceutical interventions in response to the SARS-CoV-2 epidemic, subsequently
reducing their intensity following an observed reduction in the number of hospitalised cases and deaths. By the end of
October 2020, a resurgence of cases had been observed throughout Europe and many countries reinstated more stringent
interventions as a result.
In May 2020, ECDC published baseline projections of the number of confirmed COVID-19 cases and associated
hospitalisation and mortality for 30 EU/EEA countries and the UK, with a comprehensive description of the dynamic
compartmental model developed to produce the projections2. Updated projections were then published in September
2020.
This report provides a further update to those baseline projections and also includes an alternative scenario which
illustrates the potential impact on the number of cases, hospitalisations and deaths, if the population returned to the
behaviour they practised on 1 April 2020. Furthermore, we illustrate how hospitalisation rates may be affected if the
response measures implemented in October and November 2020 are lifted before the Christmas period.
Both the model projections and the data to which the model is calibrated should be interpreted with caution, given the
differences between national surveillance systems, case definitions and testing policies. Comparisons between countries
based on the data and projections presented in this paper should only be made with caution and should take these
differences into account. Nonetheless, the projections presented here illustrate potential future trends in COVID-19
transmission in EU/EEA countries and the UK.

Updates to the ECDC model
Since the publication of ECDC’s projections in September 2020, further structural changes have been made to the model,
reflecting the unfolding epidemiological situation.
As before, the model incorporates data on the number of COVID-19 tests conducted in each country weekly since 1 June
2020. However, we now leave historical testing data unsmoothed in the model fitting process and project testing rates in
the future, making the limiting assumption that from November 2020 the demand for COVID-19 tests is driven by the true
incidence of COVID-19 in the population, not by external factors such as access, policy, marketing or publicity.
As in previous analyses, we infer from epidemiological data the extent to which response measures reduce the rate at
which people come into ‘effective’ contact with each other. That is to say, the rate at which people meet in such a way
that SARS-CoV-2 could be transmitted from one to another. In this update, we additionally include the closure of any
educational establishments, including school holidays, as a proxy for behavioural change observed over the summer
period in particular. This should not be interpreted as an indicator of transmission within schools but as a measure of how
the population behaves differently when some educational establishments are closed. We also include regionally-enforced
stay-at-home orders within the class of ‘stay-at-home orders’. Our rationale was that these measures were implemented
in the regions where they were needed i.e. the hotspots of transmission.
A limitation of the model is the grouping of response measures. We have attempted to find a standardised definition for
all EU/EEA countries and the UK. For example, if we consider the closure of any public place; there is a wide range of
impact associated with this definition, either only very specific establishments are closed or much of daily life is affected,
both situations would be included. This may reduce the ability of the model to pick up changes in behaviour that fall
within this category.
The epidemiological situation has evolved throughout 2020, including introduction of facemasks and population-based
testing, and the so-called ‘fatigue’ of the population in responding to response measures. It is therefore feasible that even
if the same policy is mandated in November as was implemented in April, it may not have the same effect. For this
reason, when inferring the implications of a response measure on behaviour, we assume that the impact of a given policy

1
    Available from: https://www.ecdc.europa.eu/en/covid-19/latest-evidence
2
 This document is available from: https://www.ecdc.europa.eu/en/publications-data/projected-baselines-covid-19-eueea-and-uk-
assessing-impact-de-escalation-measures

                                                                    2
ECDC TECHNICAL REPORT                                                 Updated projections of COVID-19 in the EU/EEA and the UK

may be different before 30 June 2020 and afterwards. This date was selected simply as a threshold for the first half of the
year.
In this update of the forecasts, we also include a scenario where each country returns to the same behaviour as on 1 April
2020 (Annex 3). That is to say that, on average, the number of effective contacts each person has is the same as on that
date. This is not the same as saying that the same policies are in place, although that could be viewed as way to effect
the same behaviour. It could also be that people are strongly encouraged to adhere to the measures in place, with the
same stringency as they themselves applied in April. 1 April 2020 was chosen as every EU/EEA country and the UK had
their strongest measures of the year in place on that day.

                                                             3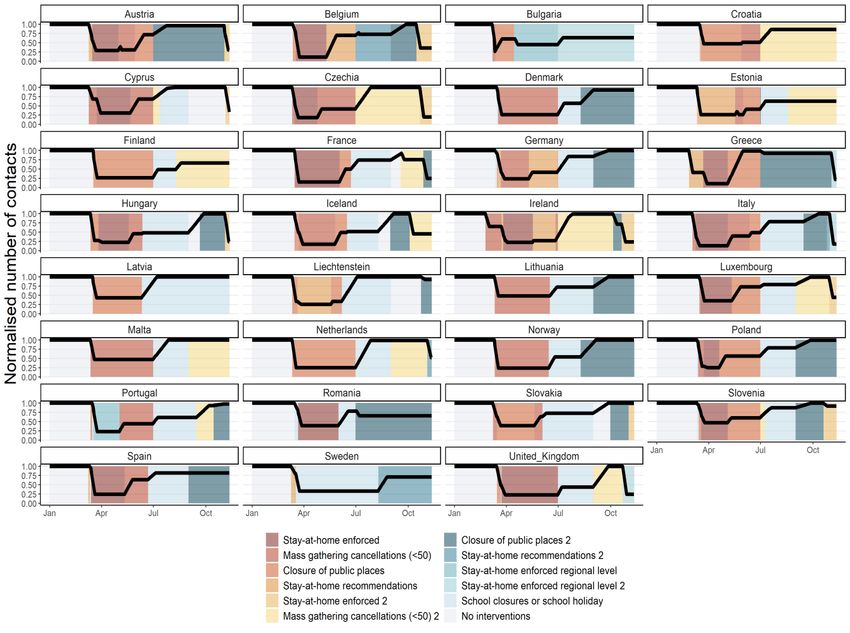
ECDC TECHNICAL REPORT                                                  Updated projections of COVID-19 in the EU/EEA and the UK

Projections of COVID-19 cases and deaths
Figures 1a–1k show the projected trend for confirmed cases and deaths (line), plotted against the observed data to date
(bars) for each country of the EU/EEA and the UK (15 February–25 December 2020). The non-pharmaceutical
interventions included in the model are shown in horizontal bars (15 February–10 November 2020).
By the end of October 2020, a resurgence of confirmed COVID-19 cases and associated hospitalisation and death had
been observed in every EU/EEA country and the UK. The increase in testing rates is clearly no longer sufficient to explain
the increased number of confirmed cases, implying that transmission of the virus has increased. The model projections
show that, in the absence of new or reinstated measures, the increase can be expected to continue. However, a number
of EU/EEA countries have recently increased the intensity of their response measures, in some cases returning to
lockdown measures. In these settings, a rapid decrease is projected for the number of confirmed cases and for associated
hospitalisation and mortality. Since these policy changes have been enacted in recent days, their impact cannot yet be
fully observed and this is reflected in the uncertainty intervals around the projected trends.
In addition to the baseline projections, we also include Figures 2a–2k projections for a potential scenario where, from 19
November 2020, contact rates return to the levels of 1 April 2020. For the countries that have recently introduced stricter
measures, this mirrors closely the baseline projection. For countries that have not made changes to policy in recent
weeks, it could be considered as the maximum extent to which the current resurgence could be reduced.
The results of the model for each time series modelled (including hospital and ICU admissions and hospital and ICU
occupancy) are presented in Annex 1 (30-day projections of confirmed COVID-19 cases, deaths, and hospital
requirements in EU/EEA countries and the UK). In some countries, there is not data available to fit the model to all six of
these time series. This is particularly the case for hospital and ICU data where we sometimes have access to occupancy
but not admissions, or vice versa. In these instances, the model produces estimates in line with the prior assumptions of
length of stay in hospital or ICU.
Data on the number of confirmed cases is most affected by differences in testing policy and healthcare-seeking behaviour
both over time and between countries. It is therefore more informative to focus on the time series of hospital and ICU
admissions and deaths. Mortality data gives the strongest signal of the impact of the virus on the population since a death
due to COVID-19 is more likely to be confirmed with certainty than a mild case. For this reason, we encourage readers to
focus on the model calibration to the hospital-related time series and to deaths (Annex 1). These in turn inform the
forecasts for the future number of confirmed cases.
The inclusion of as many data sources as possible strengthens the calibration of the mathematical model, thereby
reducing uncertainty (for more information on data sources, see Annex 2). ECDC is constantly monitoring data in the
public domain and liaises with EU/EEA countries and the UK to extend its data coverage in future analysis. Additional
sources of data are included in the modelling analysis on an ongoing basis.

 Note
 The data on non-pharmaceutical interventions used for this report are based on information available from
 official public sources as of Tuesday 10 November at 18.00, collected in association with the Joint Research
 Centre. These data may not capture measures that are not reported on publicly available websites.
 Consequently, this approach should be seen as a snapshot of the response measures reported in the EU/EEA
 and the UK.
 The data on response measures have several limitations. Firstly, there is substantial heterogeneity in physical
 distancing policies and their implementation between countries, and due to the regional implementation of
 several measures in many countries, further inaccuracies in the intervention data might occur. Also, the level of
 implementation of measures may vary between countries and there may be specific rules and exceptions to the
 measures, making interpretation of the data challenging. The measures displayed in these figures are reported
 at national level, and it should be noted that due to the evolution of the epidemic in certain regions, regional or
 local measures often preceded national ones. The exact dates of introduction were often available from official
 sources but delays in their implementation may have occurred. Additionally, the availability of public data from
 official government sources varies among countries. For some countries, data concerning discontinued
 measures are no longer available on official websites, which may result in the data for more recent measures
 being more accurate.

                                                              4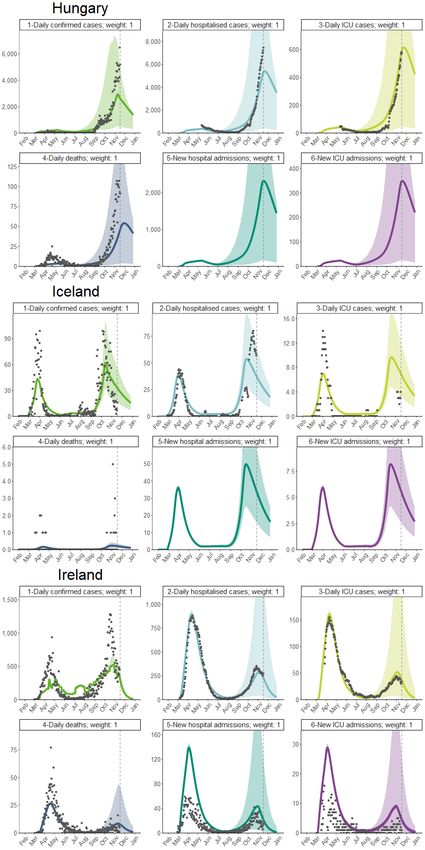
ECDC TECHNICAL REPORT                                                                   Updated projections of COVID-19 in the EU/EEA and the UK

Figure 1a. Number of observed and projected newly reported COVID-19 cases and deaths, and non-
pharmaceutical interventions in the EU/EEA and the UK, 1 March 2020–25 December 2020

Note: The projections presented here are not suitable for direct country comparisons but may be used to inform an understanding of non-pharmaceutical
interventions and potential future trends in COVID-19 transmission in EU/EEA countries and the UK. The vertical line on the non-pharmaceutical interventions
represents the point in time after which interventions are assumed to continue unchanged. The grey ribbon surrounding the projections for cases and deaths
represents a 95% uncertainty interval as obtained by Bayesian Markov Chain Monte Carlo (MCMC) calibration of the model.

                                                                             5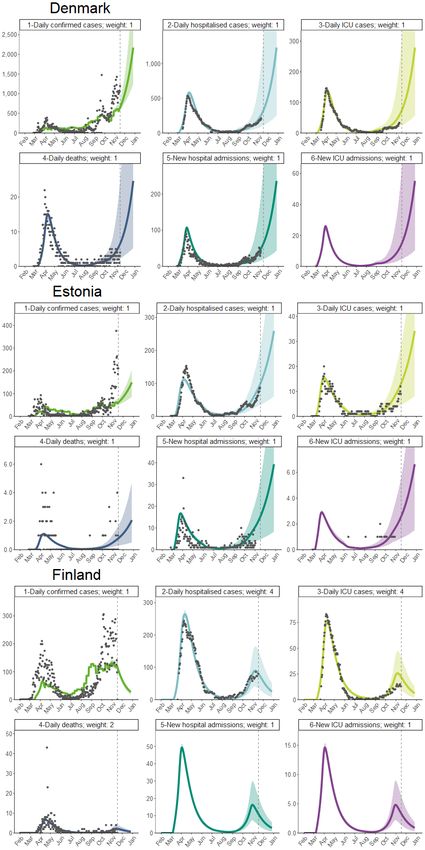
ECDC TECHNICAL REPORT                                                                   Updated projections of COVID-19 in the EU/EEA and the UK

Figure 1b. Number of observed and projected newly reported COVID-19 cases and deaths, and non-
pharmaceutical interventions in the EU/EEA and the UK, 1 March–25 December 2020

Note: The projections presented here are not suitable for direct country comparisons but may be used to inform an understanding of non-pharmaceutical
interventions and potential future trends in COVID-19 transmission in EU/EEA countries and the UK. The vertical line on the non-pharmaceutical interventions
represents the point in time after which interventions are assumed to continue unchanged. The grey ribbon surrounding the projections for cases and deaths
represents a 95% uncertainty interval as obtained by MCMC calibration of the model.

                                                                             6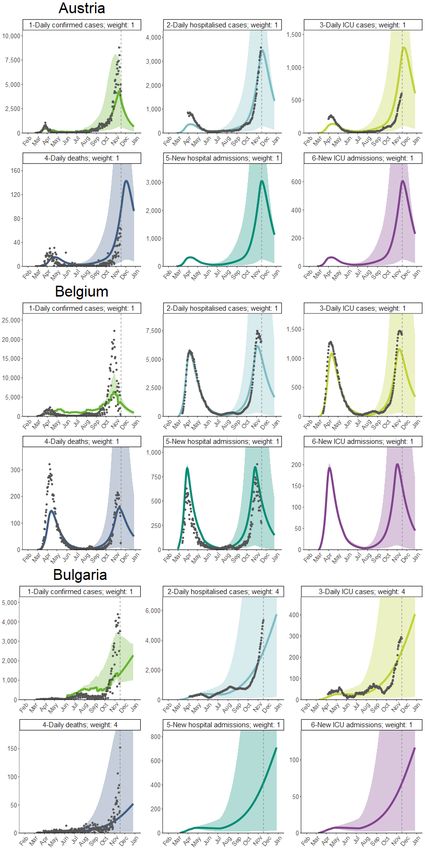
ECDC TECHNICAL REPORT                                                                   Updated projections of COVID-19 in the EU/EEA and the UK

Figure 1c. Number of observed and projected newly reported COVID-19 cases and deaths, and non-
pharmaceutical interventions in the EU/EEA and the UK, 1 March–25 December 2020

Note: The projections presented here are not suitable for direct country comparisons but may be used to inform an understanding of non-pharmaceutical
interventions and potential future trends in COVID-19 transmission in EU/EEA countries and the UK. The vertical line on the non-pharmaceutical interventions
represents the point in time after which interventions are assumed to continue unchanged. The grey ribbon surrounding the projections for cases and deaths
represents a 95% uncertainty interval as obtained by MCMC calibration of the model.

                                                                             7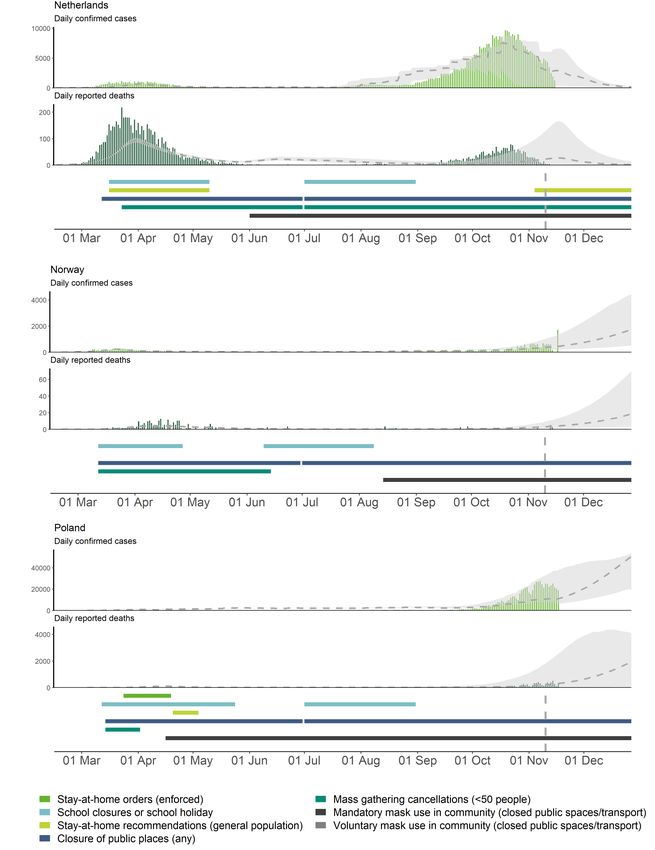
ECDC TECHNICAL REPORT                                                                   Updated projections of COVID-19 in the EU/EEA and the UK

Figure 1d. Number of observed and projected newly reported COVID-19 cases and deaths, and non-
pharmaceutical interventions in the EU/EEA and the UK, 1 March–25 December 2020

Note: The projections presented here are not suitable for direct country comparisons but may be used to inform an understanding of non-pharmaceutical
interventions and potential future trends in COVID-19 transmission in EU/EEA countries and the UK. The vertical line on the non-pharmaceutical interventions
represents the point in time after which interventions are assumed to continue unchanged. The grey ribbon surrounding the projections for cases and deaths
represents a 95% uncertainty interval as obtained by MCMC calibration of the model.

                                                                             8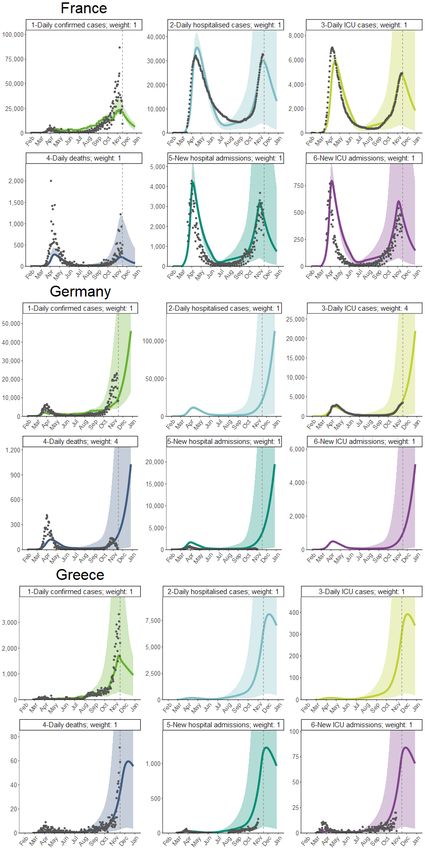
ECDC TECHNICAL REPORT                                                                   Updated projections of COVID-19 in the EU/EEA and the UK

Figure 1e. Number of observed and projected newly reported COVID-19 cases and deaths, and non-
pharmaceutical interventions in the EU/EEA and the UK, 1 March–25 December 2020

Note: The projections presented here are not suitable for direct country comparisons but may be used to inform an understanding of non-pharmaceutical
interventions and potential future trends in COVID-19 transmission in EU/EEA countries and the UK. The vertical line on the non-pharmaceutical interventions
represents the point in time after which interventions are assumed to continue unchanged. The grey ribbon surrounding the projections for cases and deaths
represents a 95% uncertainty interval as obtained by MCMC calibration of the model.

                                                                             9
ECDC TECHNICAL REPORT                                                                   Updated projections of COVID-19 in the EU/EEA and the UK

Figure 1f. Number of observed and projected newly reported COVID-19 cases and deaths, and non-
pharmaceutical interventions in the EU/EEA and the UK,1 March–25 December 2020

Note: The projections presented here are not suitable for direct country comparisons but may be used to inform an understanding of non-pharmaceutical
interventions and potential future trends in COVID-19 transmission in EU/EEA countries and the UK. The vertical line on the non-pharmaceutical interventions
represents the point in time after which interventions are assumed to continue unchanged. The grey ribbon surrounding the projections for cases and deaths
represents a 95% uncertainty interval as obtained by MCMC calibration of the model.

                                                                            10
ECDC TECHNICAL REPORT Updated projections of COVID-19 in the EU/EEA and the UK
Figure 1g. Number of observed and projected newly reported COVID-19 cases and deaths, and non-
pharmaceutical interventions in the EU/EEA and the UK, 1 March–25 December 2020
Note: The projections presented here are not suitable for direct country comparisons but may be used to inform an understanding of non-pharmaceutical
interventions and potential future trends in COVID-19 transmission in EU/EEA countries and the UK. The vertical line on the non-pharmaceutical interventions
represents the point in time after which interventions are assumed to continue unchanged. The grey ribbon surrounding the projections for cases and deaths
represents a 95% uncertainty interval as obtained by MCMC calibration of the model.
11ECDC TECHNICAL REPORT Updated projections of COVID-19 in the EU/EEA and the UK
Figure 1h. Number of observed and projected newly reported COVID-19 cases and deaths, and non-
pharmaceutical interventions in the EU/EEA and the UK, 1 March–25 December 2020
Note: The projections presented here are not suitable for direct country comparisons but may be used to inform an understanding of non-pharmaceutical
interventions and potential future trends in COVID-19 transmission in EU/EEA countries and the UK. The vertical line on the non-pharmaceutical interventions
represents the point in time after which interventions are assumed to continue unchanged. The grey ribbon surrounding the projections for cases and deaths
represents a 95% uncertainty interval as obtained by MCMC calibration of the model.
12ECDC TECHNICAL REPORT Updated projections of COVID-19 in the EU/EEA and the UK
Figure 1i. Number of observed and projected newly reported COVID-19 cases and deaths, and non-
pharmaceutical interventions in the EU/EEA and the UK, 1 March–25 December 2020
Note: The projections presented here are not suitable for direct country comparisons but may be used to inform an understanding of non-pharmaceutical
interventions and potential future trends in COVID-19 transmission in EU/EEA countries and the UK. The vertical line on the non-pharmaceutical interventions
represents the point in time after which interventions are assumed to continue unchanged. The grey ribbon surrounding the projections for cases and deaths
represents a 95% uncertainty interval as obtained by MCMC calibration of the model.
13ECDC TECHNICAL REPORT Updated projections of COVID-19 in the EU/EEA and the UK
Figure 1j. Number of observed and projected newly reported COVID-19 cases and deaths, and non-
pharmaceutical interventions in the EU/EEA and the UK, 1 March–25 December 2020
Note: The projections presented here are not suitable for direct country comparisons but may be used to inform an understanding of non-pharmaceutical
interventions and potential future trends in COVID-19 transmission in EU/EEA countries and the UK. The vertical line on the non-pharmaceutical interventions
represents the point in time after which interventions are assumed to continue unchanged. The grey ribbon surrounding the projections for cases and deaths
represents a 95% uncertainty interval as obtained by MCMC calibration of the model.
14ECDC TECHNICAL REPORT Updated projections of COVID-19 in the EU/EEA and the UK
Figure 1k. Number of observed and projected newly reported COVID-19 cases and deaths, and non-
pharmaceutical interventions in the EU/EEA and the UK, 1 March–25 December 2020
Note: The projections presented here are not suitable for direct country comparisons but may be used to inform an understanding of non-pharmaceutical
interventions and potential future trends in COVID-19 transmission in EU/EEA countries and the UK. The vertical line on the non-pharmaceutical interventions
represents the point in time after which interventions are assumed to continue unchanged. The grey ribbon surrounding the projections for cases and deaths
represents a 95% uncertainty interval as obtained by MCMC calibration of the model.
15ECDC TECHNICAL REPORT Updated projections of COVID-19 in the EU/EEA and the UK
Alternative scenario: returning to the effective
contact rates of 1 April 2020
To give a sense of how the unfolding epidemiological situation might be influenced by future policy, we present in Figures
2a-2k an alternative scenario where behaviour returns to that of the 1April 2020. On this date, every country in the
EU/EEA and the UK had its most stringent measures in place. However, that is not to say that the same policies would
need to be implemented in order to achieve the same effect.
For ten countries that implemented new stringent policies at the end of October or beginning of November 2020, we
estimate that the effectiveness is as strong as in the first wave and that the rate at which the resurgence is brought under
control will be comparative with the earlier outbreak. For a further twelve countries, we estimate that the number of
cases, hospitalisations and deaths will be reduced to low levels with the current measures in place but that the decline will
be slower than in April.
There are nine countries where we predict that the current measures will not be sufficient to cause a downturn in the
incidence of confirmed cases. However, this may be due to the limitation of our method for classifying response
measures, It is possible that newly enacted policy that falls short of our definition of a stay-at-home recommendation or
stay-at-home order e.g. a night-time curfew, may be sufficient to reduce contact rates enough to slow the epidemic
growth. We predict that all nine of these countries would see a reduction in the rate of newly confirmed cases (and
subsequently hospitalisations and deaths) if their populations returned to the behaviour of 1 April 2020.
16ECDC TECHNICAL REPORT Updated projections of COVID-19 in the EU/EEA and the UK
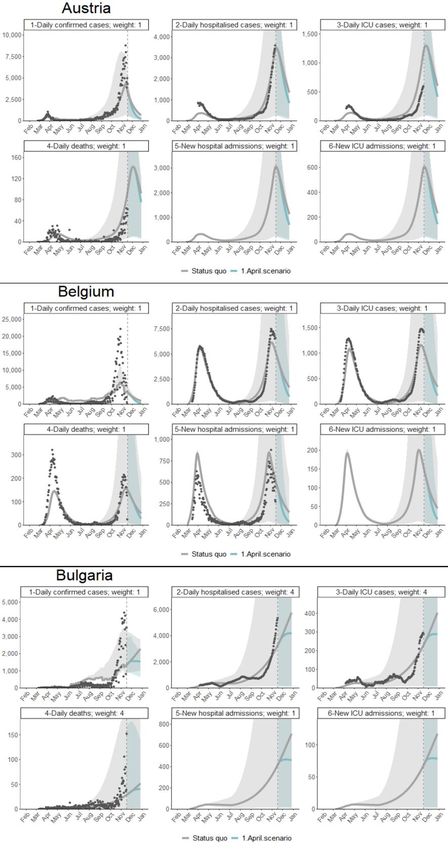
Figure 2a. Future baseline scenario and alternative scenario with the effective contact rates of 1 April 2020
for COVID-19 cases by time series type* in the EU/EEA and the UK between 27 January and 25 December
2020
*New daily cases, new daily deaths, new daily admissions at hospital, daily number of hospitalised cases, daily new admission in intensive care units and
daily number of cases hospitalised in intensive care units.
Where data on hospital and ICU admissions are not available, these time series are inferred from the other four time series under assumptions on the
distribution of length of hospital stay. The ribbons surrounding the projections represent a 95% uncertainty interval as obtained by MCMC calibration of the
model.
17ECDC TECHNICAL REPORT Updated projections of COVID-19 in the EU/EEA and the UK
Figure 2b. Future baseline scenario and alternative scenario with the effective contact rates of 1 April 2020
for COVID-19 cases by time series type* in the EU/EEA and the UK between 27 January and 25 December
2020
*New daily cases, new daily deaths, new daily admissions at hospital, daily number of hospitalised cases, daily new admission in intensive care units and
daily number of cases hospitalised in intensive care units.
Where data on hospital and ICU admissions are not available, these time series are inferred from the other four time series under assumptions on the
distribution of length of hospital stay. The ribbons surrounding the projections represent a 95% uncertainty interval as obtained by MCMC calibration of the
model.
18ECDC TECHNICAL REPORT Updated projections of COVID-19 in the EU/EEA and the UK
Figure 2c. Future baseline scenario and alternative scenario with the effective contact rates of 1 April 2020
for COVID-19 cases by time series type in the EU/EEA and the UK between 27 January and 25 December
2020
*New daily cases, new daily deaths, new daily admissions at hospital, daily number of hospitalised cases, daily new admission in intensive care units and
daily number of cases hospitalised in intensive care units.
Where data on hospital and ICU admissions are not available, these time series are inferred from the other four time series under assumptions on the
distribution of length of hospital stay. The ribbons surrounding the projections represent a 95% uncertainty interval as obtained by MCMC calibration of the
model.
19ECDC TECHNICAL REPORT Updated projections of COVID-19 in the EU/EEA and the UK
Figure 2d. Future baseline scenario and alternative scenario with the effective contact rates of 1 April 2020
for COVID-19 cases by time series type in the EU/EEA and the UK between 27 January and 25 December
2020
*New daily cases, new daily deaths, new daily admissions at hospital, daily number of hospitalised cases, daily new admission in intensive care units and
daily number of cases hospitalised in intensive care units.
Where data on hospital and ICU admissions are not available, these time series are inferred from the other four time series under assumptions on the
distribution of length of hospital stay. The ribbons surrounding the projections represent a 95% uncertainty interval as obtained by MCMC calibration of the
model.
20ECDC TECHNICAL REPORT Updated projections of COVID-19 in the EU/EEA and the UK
Figure 2e. Future baseline scenario and alternative scenario with the effective contact rates of 1 April 2020
for COVID-19 cases by time series type*in the EU/EEA and the UK between 27 January and 25 December
2020
*New daily cases, new daily deaths, new daily admissions at hospital, daily number of hospitalised cases, daily new admission in intensive care units and
daily number of cases hospitalised in intensive care units.
Where data on hospital and ICU admissions are not available, these time series are inferred from the other four time series under assumptions on the
distribution of length of hospital stay. The ribbons surrounding the projections represent a 95% uncertainty interval as obtained by MCMC calibration of the
model.
21ECDC TECHNICAL REPORT Updated projections of COVID-19 in the EU/EEA and the UK
Figure 2f. Future baseline scenario and alternative scenario with the effective contact rates of 1 April 2020
for COVID-19 cases by time series type in the EU/EEA and the UK between 27 January and 25 December
2020
*New daily cases, new daily deaths, new daily admissions at hospital, daily number of hospitalised cases, daily new admission in intensive care units and
daily number of cases hospitalised in intensive care units.
Where data on hospital and ICU admissions are not available, these time series are inferred from the other four time series under assumptions on the
distribution of length of hospital stay. The ribbons surrounding the projections represent a 95% uncertainty interval as obtained by MCMC calibration of the
model.
22ECDC TECHNICAL REPORT Updated projections of COVID-19 in the EU/EEA and the UK
Figure 2g. Future baseline scenario and alternative scenario with the effective contact rates of 1 April 2020
for COVID-19 cases by time series type* in the EU/EEA and the UK between 27 January and 25 December
2020
*New daily cases, new daily deaths, new daily admissions at hospital, daily number of hospitalised cases, daily new admission in intensive care units and
daily number of cases hospitalised in intensive care units.
Where data on hospital and ICU admissions are not available, these time series are inferred from the other four time series under assumptions on the
distribution of length of hospital stay. The ribbons surrounding the projections represent a 95% uncertainty interval as obtained by MCMC calibration of the
model.
23ECDC TECHNICAL REPORT Updated projections of COVID-19 in the EU/EEA and the UK
Figure 2h. Future baseline scenario and alternative scenario with the effective contact rates of 1 April 2020
for COVID-19 cases by time series type in the EU/EEA and the UK between 27 January and 25 December
2020
*New daily cases, new daily deaths, new daily admissions at hospital, daily number of hospitalised cases, daily new admission in intensive
care units and daily number of cases hospitalised in intensive care units.
Where data on hospital and ICU admissions are not available, these time series are inferred from the other four time series under assumptions on the
distribution of length of hospital stay. The ribbons surrounding the projections represent a 95% uncertainty interval as obtained by MCMC calibration of the
model.
24ECDC TECHNICAL REPORT Updated projections of COVID-19 in the EU/EEA and the UK
Figure 2i. Future baseline scenario and alternative scenario with the effective contact rates of 1 April 2020
for COVID-19 cases by time series type* in the EU/EEA and the UK between 27 January and 25 December
2020
*New daily cases, new daily deaths, new daily admissions at hospital, daily number of hospitalised cases, daily new admission in intensive care units and
daily number of cases hospitalised in intensive care units.
Where data on hospital and ICU admissions are not available, these time series are inferred from the other four time series under assumptions on the
distribution of length of hospital stay. The ribbons surrounding the projections represent a 95% uncertainty interval as obtained by MCMC calibration of the
model.
25ECDC TECHNICAL REPORT Updated projections of COVID-19 in the EU/EEA and the UK
Figure 2j. Future baseline scenario and alternative scenario with the effective contact rates of 1 April 2020
for COVID-19 cases by time series type in the EU/EEA and the UK between 27 January and 25 December
2020
*New daily cases, new daily deaths, new daily admissions at hospital, daily number of hospitalised cases, daily new admission in intensive care units and
daily number of cases hospitalised in intensive care units.
Where data on hospital and ICU admissions are not available, these time series are inferred from the other four time series under assumptions on the
distribution of length of hospital stay. The ribbons surrounding the projections represent a 95% uncertainty interval as obtained by MCMC calibration of the
model.
26ECDC TECHNICAL REPORT Updated projections of COVID-19 in the EU/EEA and the UK
Figure 2k. Future baseline scenario and alternative scenario with the effective contact rates of 1 April 2020
for COVID-19 cases by time series type* in the EU/EEA and the UK between 27 January and 25 December
2020
*New daily cases, new daily deaths, new daily admissions at hospital, daily number of hospitalised cases, daily new admission in intensive care units and
daily number of cases hospitalised in intensive care units
Where data on hospital and ICU admissions are not available, these time series are inferred from the other four time series under assumptions on the
distribution of length of hospital stay. The ribbons surrounding the projections represent a 95% uncertainty interval as obtained by MCMC calibration of the
model.
27ECDC TECHNICAL REPORT Updated projections of COVID-19 in the EU/EEA and the UK
Potential resurgence as a result of lifting
measures before Christmas
There is much discussion globally regarding the potential consequences of lifting measures for the Christmas period so
that people are freer to meet and celebrate with their friends and family. We evaluate the potential impact on
hospitalisation rates if the measures introduced in October and November 2020 are lifted fully on 21 December, or earlier
on 7 December. For this analysis, we include only the EU/EEA Member States that have introduced new measures in that
period, and the United Kingdom. Other Member States may be expected to continue with the projected baseline trend.
Figure 3. Potential impact on hospital admission rate due to lifting measures on 21 December 2020 or
7 December 2020
If recently introduced measures are lifted on 21 December 2020, we foresee that an increase in COVID-19 hospitalisation
may occur as early as the first week of January 2020. If measures were lifted earlier, on 7 December 2020, the associated
increase may begin before 24 December. It should also be noted that as the incidence rate will still be falling in December
2020, reducing restrictions earlier will lead to a more rapid increase in case numbers, hospitalisations and death.
28ECDC TECHNICAL REPORT Updated projections of COVID-19 in the EU/EEA and the UK
Effect of non-pharmaceutical interventions
Calibrating the model to epidemiological data allows the inference of changes in behaviour over time. At each time point
in the model, we estimate the reproduction number, R, for each country. This allows us to infer changes in the contact
rate between people. Here we make the limiting assumption that all contacts are equally likely to result in the
transmission of SARS-CoV-2 if one person is infectious and the other is susceptible. In fact, it is likely that older people
and risk groups have maintained a lower contact rate throughout the year and also that the use of facemasks and general
COVID-19 awareness have led to lower risk of transmission for each contact.
In Figure 4, we present the normalised number of contacts between individuals over time. The initial response measures
led to a dramatic decrease in the number of people that each person met. However, as a result of lifting measures, and of
returning to school and work after the summer holidays, we estimate that people in approximately two thirds of countries
returned close to their baseline level of contacts.
The re-introduction of more stringent measures in several countries at the end of October and beginning of November has
resulted in a second reduction in the number of contacts that people make. In some countries, namely those that have re-
implemented stay-at-home orders, this reduction is comparable with the behaviour seen in April.
Figure 4. Effect of non-pharmaceutical interventions on the number of contacts between individuals in the
EU/EEA and the UK in the period between 1 March and 17 November 2020
Note: Only the strongest non-pharmaceutical intervention on a given day was taken into account; for a prior estimation of the effect of
the interventions, see the original model description for further details: https://www.ecdc.europa.eu/en/publications-data/projected-
baselines-covid-19-eueea-and-uk-assessing-impact-de-escalation-measures
29ECDC TECHNICAL REPORT Updated projections of COVID-19 in the EU/EEA and the UK
Summary
We present a dynamic compartmental model of SARS-CoV-2 transmission and associated progression to COVID-19 of
increasing severity, developed at ECDC. The model is calibrated to epidemiological data from all EU/EEA countries and the
UK, including multiple community and hospital COVID-19 case time series.
The aim of this modelling work is to illustrate the potential number of reported cases and deaths, together with the
expected requirement for hospital and intensive care (ICU) beds for EU/EEA countries and the UK over the forthcoming
weeks.
In order to inform decision-making, the projections illustrate two different scenarios. In the first, the response measures
in place on 10 November are maintained until 25 December and in the second we evaluate the marginal effect if countries
were to return to the level of physical distancing that was achieved in April 2020.
Given the response measures currently in place, we foresee that more than half of EU/EEA Member States will observe a
reduction of more than 50% in the daily number of confirmed cases, and a subsequent reduction in associated hospital
demand and death. More than two thirds of Member States are expected to see some decline in the daily rate of
confirmed cases as a consequence of current policy. If behaviour returned to that of 1 April 2020, when the most
stringent measures were in place across Europe, then all countries would be expected to see a decline in COVID-19
incidence.
There is much discussion globally regarding the potential consequences of lifting measures for the Christmas period. We
anticipate that if countries that have implemented new response measures in October or November were to lift those
measures on 21 December 2020, allowing people to meet more freely again, there would be a subsequent increase in
COVID-19 hospital admissions in those countries as early as the first week of January 2021. If the measures were lifted
on 7 December this increase in hospitalisation may start to occur before 24 December.
Forecasting the epidemiology of COVID-19 for the EU/EEA and the UK remains very challenging since it is so dependent
on the policies enacted by Member States. These projections have been made soon after the implementation of new
measures, including stay-at-home orders and recommendations. As such, there is little observed data on their impact and
the uncertainty intervals accompanying the projections are therefore wide. In this update, we have included the
introduction of regional stay-at-home orders, the implementation and coverage of which may vary greatly from one
country to another.
By calibrating the dynamic compartmental model to data on number of confirmed cases, hospital and ICU admissions and
occupancy, and mortality, we aim to give some indication of how the COVID-19 pandemic may continue to unfold in
Europe and how response measures may mitigate its direct impact on health.
30ECDC TECHNICAL REPORT Updated projections of COVID-19 in the EU/EEA and the UK
Annex 1. Projections of confirmed COVID-19
cases, associated deaths and hospital (ICU)
requirements in EU/EEA countries and the UK
Figure 5a. Number of observed and projected COVID-19 cases by time series type* in the EU/EEA and the
UK between 27 January and 25 December 2020
*New daily cases, new daily deaths, new daily admissions at hospital, daily number of hospitalised cases, daily new admission in intensive care units and
daily number of cases hospitalised in intensive care units.
No time series for hospitalised and ICU cases available. Due to missing country-specific values for indicators informing the graphs, projections are computed
with model parameters based on EU/EEA and the UK averages as an approximation of the actual values. The ribbon surrounding the projections for cases
and deaths represents a 95% uncertainty interval as obtained by MCMC calibration of the model.
31ECDC TECHNICAL REPORT Updated projections of COVID-19 in the EU/EEA and the UK
Figure 5b. Number of observed and projected COVID-19 cases by time-series type* in the EU/EEA and the
UK between 27 January and 25 December 2020
*New daily cases, new daily deaths, new daily admissions at hospital, daily number of hospitalised cases, daily new admission in intensive
care units and daily number of cases hospitalised in intensive care units.
No time series for hospitalised and ICU cases available. Due to missing country-specific values for indicators informing the graphs,
projections are computed with model parameters based on European averages as an approximation of the actual values. The ribbon
surrounding the projections for cases and deaths represents a 95% uncertainty interval as obtained by MCMC calibration of the model.
32ECDC TECHNICAL REPORT Updated projections of COVID-19 in the EU/EEA and the UK
Figure 5c. Number of observed and projected COVID-19 cases by time series type* in the EU/EEA and the
UK between 27 January and 25 December 2020
*New daily cases, new daily deaths, new daily admissions at hospital, daily number of hospitalised cases, daily new admission in intensive care units and
daily number of cases hospitalised in intensive care units.
No time series for hospitalised and ICU cases available. Due to missing country-specific values for indicators informing the graphs, projections are computed
with model parameters based on European averages as an approximation of the actual values. The ribbon surrounding the projections for cases and deaths
represents a 95% uncertainty interval as obtained by MCMC calibration of the model.
33ECDC TECHNICAL REPORT Updated projections of COVID-19 in the EU/EEA and the UK
Figure 5d. Number of observed and projected COVID-19 cases by time series type* in the EU/EEA and the
UK between 27 January and 25 December 2020
*New daily cases, new daily deaths, new daily admissions at hospital, daily number of hospitalised cases, daily new admission in intensive care units and
daily number of cases hospitalised in intensive care units.
No time series for hospitalised and ICU cases available. Due to missing country-specific values for indicators informing the graphs, projections are computed
with model parameters based on European averages as an approximation of the actual values. The ribbon surrounding the projections for cases and deaths
represents a 95% uncertainty interval as obtained by MCMC calibration of the model.
34ECDC TECHNICAL REPORT Updated projections of COVID-19 in the EU/EEA and the UK
Figure 5e. Number of observed and projected COVID-19 cases by time-series type* in the EU/EEA and the
UK in the period up until 25 December 2020
*New daily cases, new daily deaths, new daily admissions at hospital, daily number of hospitalised cases, daily new admission in intensive care units and
daily number of cases hospitalised in intensive care units.
No time series for hospitalised and ICU cases available. Due to missing country-specific values for indicators informing the graphs, projections are computed
with model parameters based on European averages as an approximation of the actual values. The ribbon surrounding the projections for cases and deaths
represents a 95% uncertainty interval as obtained by MCMC calibration of the model.
35ECDC TECHNICAL REPORT Updated projections of COVID-19 in the EU/EEA and the UK
Figure 5f. Number of observed and projected COVID-19 cases by time-series type* in the EU/EEA and the
UK in the period up until 25 December 2020
*New daily cases, new daily deaths, new daily admissions at hospital, daily number of hospitalised cases, daily new admission in intensive care units and
daily number of cases hospitalised in intensive care units.
No time series for hospitalised and ICU cases available. Due to missing country-specific values for indicators informing the graphs, projections are computed
with model parameters based on European averages as an approximation of the actual values. The ribbon surrounding the projections for cases and deaths
represents a 95% uncertainty interval as obtained by MCMC calibration of the model.
36ECDC TECHNICAL REPORT Updated projections of COVID-19 in the EU/EEA and the UK
Figure 5g. Number of observed and projected COVID-19 cases by time-series type* in the EU/EEA and the
UK in the period up until 25 December 2020
*New daily cases, new daily deaths, new daily admissions at hospital, daily number of hospitalised cases, daily new admission in intensive care units and
daily number of cases hospitalised in intensive care units.
No time series for hospitalised and ICU cases available. Due to missing country-specific values for indicators informing the graphs, projections are computed
with model parameters based on European averages as an approximation of the actual values. The ribbon surrounding the projections for cases and deaths
represents a 95% uncertainty interval as obtained by MCMC calibration of the model.
37ECDC TECHNICAL REPORT Updated projections of COVID-19 in the EU/EEA and the UK
Figure 5h. Number of observed and projected COVID-19 cases by time-series type* in the EU/EEA and the
UK in the period up until 25 December 2020
*New daily cases, new daily deaths, new daily admissions at hospital, daily number of hospitalised cases, daily new admission in intensive care units and
daily number of cases hospitalised in intensive care units.
No time series for hospitalised and ICU cases available. Due to missing country-specific values for indicators informing the graphs, projections are computed
with model parameters based on European averages as an approximation of the actual values. The ribbon surrounding the projections for cases and deaths
represents a 95% uncertainty interval as obtained by MCMC calibration of the model.
38ECDC TECHNICAL REPORT Updated projections of COVID-19 in the EU/EEA and the UK
Figure 5i. Number of observed and projected COVID-19 cases by time-series type* in the EU/EEA and the
UK in the period up until 25 December 2020
*New daily cases, new daily deaths, new daily admissions at hospital, daily number of hospitalised cases, daily new admission in intensive care units and
daily number of cases hospitalised in intensive care units.
No time series for hospitalised and ICU cases available. Due to missing country-specific values for indicators informing the graphs, projections are computed
with model parameters based on European averages as an approximation of the actual values. The ribbon surrounding the projections for cases and deaths
represents a 95% uncertainty interval as obtained by MCMC calibration of the model.
39ECDC TECHNICAL REPORT Updated projections of COVID-19 in the EU/EEA and the UK
Figure 5j. Number of observed and projected COVID-19 cases by time-series type* in the EU/EEA and the
UK in the period up until 25 December 2020
*New daily cases, new daily deaths, new daily admissions at hospital, daily number of hospitalised cases, daily new admission in intensive care units and
daily number of cases hospitalised in intensive care units.
No time series for hospitalised and ICU cases available. Due to missing country-specific values for indicators informing the graphs, projections are computed
with model parameters based on European averages as an approximation of the actual values. The ribbon surrounding the projections for cases and deaths
represents a 95% uncertainty interval as obtained by MCMC calibration of the model.
40ECDC TECHNICAL REPORT Updated projections of COVID-19 in the EU/EEA and the UK
Figure 5k. Number of observed and projected COVID-19 cases by time-series type* in the EU/EEA and the
UK in the period up until 25 December 2020
*New daily cases, new daily deaths, new daily admissions at hospital, daily number of hospitalised cases, daily new admission in intensive care units and
daily number of cases hospitalised in intensive care units.
No time series for hospitalised and ICU cases available. Due to missing country-specific values for indicators informing the graphs, projections are computed
with model parameters based on European averages as an approximation of the actual values. The ribbon surrounding the projections for cases and deaths
represents a 95% uncertainty interval as obtained by MCMC calibration of the model.
41ECDC TECHNICAL REPORT Updated projections of COVID-19 in the EU/EEA and the UK
Annex 2. Description of data sources
Table 1. Model parameters
Selection of
Prior Lower Upper Global Uses hyper countries with
Parameter Description References
mean1 bound bound parameter2 parameter3 specific
calibration 4
Basic reproduction number Calibrated: all
defined as the average of the countries.
R0 number of new cases from one 3 2 6 No Yes Fixed: none. [3,21,22]
infected case in a totally
susceptible population
Probability of transmission in one Calibrated: no.
Beta contact between fully susceptible 0.05 0.01 0.1 Yes NA Fixed: yes.
and fully infectious individual
Reduction in infectiousness of Calibrated: no.
Beta reduction asymptomatic/mild cases relative 0 NA NA Yes NA Fixed: yes.
to severe/critical cases
Reduction in contacts of Calibrated: no.
severe/critical cases relative to Fixed: yes.
Contacts
asymptomatic/mild cases due to 0.9 0.5 0.99 Yes NA
reduction
assumed hospitalisation or
isolation
Exponential decay in Calibrated: no.
susceptibility for younger age Fixed: yes.
Susceptibility 0 NA NA Yes NA
groups relative to oldest age
group
Proportion Proportion of all cases that are Calibrated: no.
0 NA NA Yes NA
asymptomatic asymptomatic Fixed: yes.
Number of days in latency Calibrated: no.
Latency days 4.6 3 7 Yes NA [2,23,24]
(infected but not infectious) state Fixed: yes.
Number of days for which mild Calibrated: no.
Infectious days
and asymptomatic cases are 6 3 7 Yes NA Fixed: yes. [2]
mild
infectious
Infectious days Number of days for which severe Calibrated: no.
22 14 30 Yes NA
severe and critical cases are infectious Fixed: yes.
Proportion of mild and Calibrated: none.
Isolation
asymptomatic cases that isolate 0 NA NA No Yes Fixed: all
probability
after diagnosis countries.
Proportion of severe cases that Calibrated: no
Seek hospital seek hospital care during course 1 NA NA Yes NA Fixed: all
of severe disease countries
Number of days between severe Calibrated: all
Onset to
onset of symptoms and 5.9 1 14 No Yes Fixed: no [25]
hospital days*
hospitalisation
Number of days delay between Calibrated: all
Confirmation
onset of symptoms and diagnosis 11.46 0.01 20 No Yes countries [25]
delay hospital*
for those seeking hospital care Fixed: none
Number of days delay between Calibrated: all
Confirmation onset of symptoms and diagnosis countries
6.75 1 20 No Yes [25]
delay home* for those outside of the hospital Fixed: none
setting
Proportion of severe cases not Calibrated: none.
Home testing
seeking hospital care that get 0.05 NA NA Yes No Fixed: all
rate
tested countries.
Number of days a severe non- Calibrated: all
Hospital stay countries
critical case spends in hospital 10 1 30 No Yes
days Fixed: none
before discharge
Number of days between hospital Calibrated: all
Hospital to ICU countries
admission and ICU admission for 2 1 10 No Yes
days Fixed: none
cases that will become critical
42ECDC TECHNICAL REPORT Updated projections of COVID-19 in the EU/EEA and the UK
Selection of
Prior Lower Upper Global Uses hyper countries with
Parameter Description References
mean1 bound bound parameter2 parameter3 specific
calibration4
Calibrated: all
Number of days a critical case
ICU stay days 7 1 14 No Yes countries
spends in ICU before discharge
Fixed: none
Number of days a critical case Calibrated: no.
ICU death days 6 1 14 Yes NA [26]
spends in ICU before death Fixed: yes.
Number of days between Calibrated: no.
Home death
symptom onset and death for 10 7 14 Yes NA Fixed: yes.
days
those not seeking hospital care
Number of days delay between a Calibrated: all
Death reporting
COVID-19 death and that death 17 1 14 No No countries [25]
delay*
being reported in the data Fixed: none
Calibration factor for proportion Calibrated: none.
Severe factor of symptomatic cases that are 1 0.2 2 No No Fixed: all
severe countries.
Calibration factor for proportion Calibrated: all
Critical factor of severe cases requiring critical 1 0.2 2 No No countries.
care in ICU Fixed: none.
Proportion of critical cases that Calibrated: all
Critical death
die in ICU care (ventilators 0.5 0.01 0.99 No No countries
ICU
assumed to be available) Fixed: none
Proportion of critical cases that Calibrated: all
Critical death
die when ICU not available or not 0.95 0.01 0.99 No No countries
non ICU
sought Fixed: none
Number of days delay between Calibrated: no.
First import first case importation and first 7 NA NA Yes No Fixed: yes.
confirmed case
Calibrated: all
Number of people initiated with
Number import 100 0 100000 No No countries
infection at time first importation
Fixed: none
Calibrated: none.
Test per index Mean number of contacts to test
0 NA NA No No Fixed: all
case cases per confirmed index case
countries.
Reduction in average number of Calibrated: all
Efficacy contact contacts among all people when countries.
0.95 0.5 2 No No
all strongest non-targeted response Fixed: none.
is in place
Contact reduction efficacy of 'ban Calibrated: no.
Relative
mass gatherings > 50 people' Fixed: yes.
efficacy mass 0.93 0.01 0.99 Yes No
response relative to 'stay home
gathering 50
enforced'
Calibrated:
Croatia, Greece,
Relative
Contact reduction efficacy of Luxembourg,
efficacy closure
'closing public spaces' response 0.83 0.01 0.99 No No Portugal,
public places
relative to 'stay home enforced' Romania
any
Fixed: all other
countries
Relative Contact reduction efficacy of Calibrated: all
efficacy stay 'stay home recommended' countries
0.79 0.01 0.99 No No
home response relative to 'stay home Fixed: none
recommend enforced'
Time in days before full efficacy Calibrated: none.
of response is realised following Fixed: all
Response delay 7 NA NA Yes No
implementation – assumed to be countries.
consistent for all interventions
The reduction in probability of an Calibrated: none.
Mask efficacy infected person infecting a Fixed: all
against susceptible during a close 0.4 NA NA Yes No countries
infectiousness contact, given that they are
wearing a face mask
43ECDC TECHNICAL REPORT Updated projections of COVID-19 in the EU/EEA and the UK
Selection of
Prior Lower Upper Global Uses hyper countries with
Parameter Description References
mean1 bound bound parameter2 parameter3 specific
calibration4
The reduction in probability of a Calibrated: none.
Mask efficacy susceptible person being infected Fixed: all
against by an infectious person during a 0.1 NA NA Yes No countries
susceptibility close contact, given that they are
wearing a face mask
The proportion of people who Calibrated: none.
Background use face masks in the absence of Fixed: all
0.01 NA NA Yes No
mask use government recommendation or countries
mandate
Proportion of close contacts Calibrated: none.
Coverage of where face masks are worn, Fixed: all
face masks 0.8 NA NA Yes No
given enforced government countries
policy for use in some settings
Relative Calibrated: none.
The relative effectiveness of a
coverage of Fixed: all
government-led recommendation
face masks, countries
to wear face masks, compared 0.5 NA NA Yes No
given voluntary
with an enforced policy in the
government
same setting
policy
The proportion of tests Calibrated: all
Ascertainment conducted in people with mild countries
0.1 0 1 No No
of mild cases symptoms that give a positive Fixed: none
result for COVID-19
The proportion of tests Calibrated: all
Ascertainment conducted in people with severe countries
0.5 0 1 No No
of severe cases symptoms that give a positive Fixed: none
result for COVID-19
(*) The European Surveillance System (TESSy) [25]
NA: not applicable
(1) Prior mean of the parameter is used for all countries. For countries for which the parameter is not calibrated (i.e. fixed), the prior is
used in the simulation (that is, the parameter is fixed for those countries). For countries for which the parameter is calibrated, the prior is
used in the calibration process, but it is the parameter posterior that is used in analyses or simulations.
(2) If ‘yes’, the parameter is not a country-specific parameter. Global parameters may or may not be calibrated.
(3) If “yes’, the parameter uses an informative hyper-prior mean and standard deviation to enable learning across countries during the
calibration process. Only applicable for non-global parameters.
(4) Selection of countries for which the associated parameter is calibrated.
All data on the daily number of new cases and deaths in EU/EEA countries and the UK were obtained from ECDC’s Epidemic Intelligence
(EI) database, which is publicly available and can be accessed at: https://www.ecdc.europa.eu/en/publications-data/download-todays-
data-geographic-distribution-covid-19-cases-worldwide
44You can also read


