User's Guide Version 1.2 - Professional Edition
←
→
Page content transcription
If your browser does not render page correctly, please read the page content below
Professional Edition

User's Guide
  Version 1.2
© 2013 PreEmptive Solutions, LLC
All rights reserved.

Document Version 1.2-20131016
www.preemptive.com

TRADEMARKS

PreEmptive Analytics, PreEmptive Analytics for TFS, Dotfuscator, DashO, the PreEmptive Analytics for TFS logo, the PreEmptive Solutions
logo, the Dotfuscator logo, and the DashO logo are trademarks of PreEmptive Solutions, LLC.

.NET™, Team Foundation Server™, and Visual Studio™ are trademarks of Microsoft, Inc.

Java is a trademark of Oracle, Inc.

All other trademarks are property of their respective owners.

THIS PUBLICATION IS PROVIDED “AS IS” WITHOUT WARRANTY OF ANY KIND, EITHER EXPRESS OR IMPLIED, INCLUDING BUT NOT LIMITED
TO, IMPLIED WARRANTIES OF MERCHANTABILITY, FITNESS FOR A PARTICULAR PURPOSE, OR NON-INFRINGEMENT.

THIS PUBLICATION COULD CONTAIN TYPOGRAPHIC ERRORS AND/OR TECHNICAL INACCURACIES. UPDATES AND MODIFICATIONS MAY BE
MADE TO THIS DOCUMENT AND/OR SUPPORTING SOFTWARE AT ANY TIME.

PreEmptive Solutions, LLC has intellectual property rights relating to technology embodied in this product. In particular, and without
limitation, these intellectual property rights may include one or more U.S. patents or pending patent applications in the U.S. and/or other
countries.

This product is distributed under licenses restricting its use, copying, distribution, and decompilation. No part of this product may be
reproduced in any form by any means without prior written authorization of PreEmptive Solutions, LLC.
PreEmptive Analytics for TFS User Guide | 3

1        Table of Contents

1.      Table of Contents                                                                3-4
2.      Overview                                                                          5
3.      Installing PreEmptive Analytics for TFS                                           6

     3.1. Prerequisites                                                                  6-7
     3.2. Planning a Production Installation                                             7-9
     3.3. Performing a Basic (single-machine) Installation                             10-11
     3.4. Performing an Advanced Installation                                             11

      3.4.1. Installing the Endpoint                                                   11-12
      3.4.2. Installing the Aggregator                                                 12-13

      3.4.3. Installing the Endpoint and Aggregator Together                           13-14
      3.4.4. Securing the Components                                                   14-17
     3.5. Installing the Visual Studio Components                                      17-18
     3.6. Installing the Web Components                                                   18
4.      Configuring PreEmptive Analytics for TFS                                          19
     4.1. Provisioning Team Projects                                                      19

     4.2. Defining Exception Sets and Rules                                            20-21
      4.2.1. Rule Types                                                                21-22
      4.2.2. Possible Surprises                                                        22-23
     4.3. Configuring the New Data Check Interval                                         23
     4.4. Configuring Custom Data Attachment Limits                                    23-24
     4.5. Making URL changes after installation                                           25

      4.5.1. Change Aggregator Service URL                                             25-31
      4.5.2. Change Fault Query Service URL                                               32
5.      Adding Exception Reporting to an Application                                      33
6.      Examining Incidents in Team Explorer                                           34-35
7.      Upgrading PreEmptive Analytics for TFS                                            36
     7.1. Validating the Upgrade                                                          36
8.      Troubleshooting                                                                37-38
     8.1. Troubleshooting Installation                                                    39
     8.2. Troubleshooting the Endpoint                                                 39-42
     8.3. Troubleshooting the Aggregator                                               43-49

9.      Monitoring                                                                        50
10.     Maintenance                                                                       51
PreEmptive Analytics for TFS User Guide | 4

11.   Index                                           52
PreEmptive Analytics for TFS User Guide | 5

Overview

     PreEmptive Analytics for TFS allows you to integrate feedback-driven development processes into your development workflow. By
     analyzing and aggregating exceptions reported by your production applications and automatically creating TFS work items,
     PreEmptive Analytics for TFS gives you access to unprecedented levels of incident data right where you need it – in Visual Studio,
     TFS Web, and Reporting Services.

     Your instrumented applications will automatically send exception report data to your PreEmptive Analytics for TFS installation as
     errors occur during execution. PreEmptive Analytics for TFS will automatically create or update work items in Microsoft Team
     Foundation Server based on rules and thresholds you define. These work items include details about the exception type, message,
     full stack trace, the contents of any inner exceptions, and the list of all assemblies loaded at the time of the exception, as well as
     the number of such exceptions received. With a small amount of additional configuration, you will also be able to see unique
     instance identifiers (such as the serial number of each application instance that experienced the exception) as well as comments
     about the error and contact information, if provided by the end user.

     Components

     PreEmptive Analytics for TFS is made up of five individual components that are distributed via two installers. Those components
     are shown in dark blue in the diagram below.

        Endpoint: Provides a web service that accepts exception messages and stores them for evaluation. This can be exposed to the
        public internet if needed.

        Aggregator: Periodically queries the Endpoint and evaluates new data against rules which are configured by a machine-local
        configuration (admin) utility, and/or by a project-specific (limited) version of the utility installed as part of the Visual Studio
        Components.

        Visual Studio Components: Provides a Visual Studio control for viewing stack traces and incident details, a custom Team
        Explorer pane for accessing the work items created by PreEmptive Analytics for TFS, and a lightweight version of the
        configuration (admin) utility for configuring project-specific settings.

        Web Components: Provides a control for viewing stack traces and incident details in TFS Web Access.

        Reports: Provides reports (for each TFS project) that summarize the work items created by PreEmptive Analytics for TFS for
        that project.

     Please see Installing PreEmptive Analytics for TFS for more information about how and where to install these components.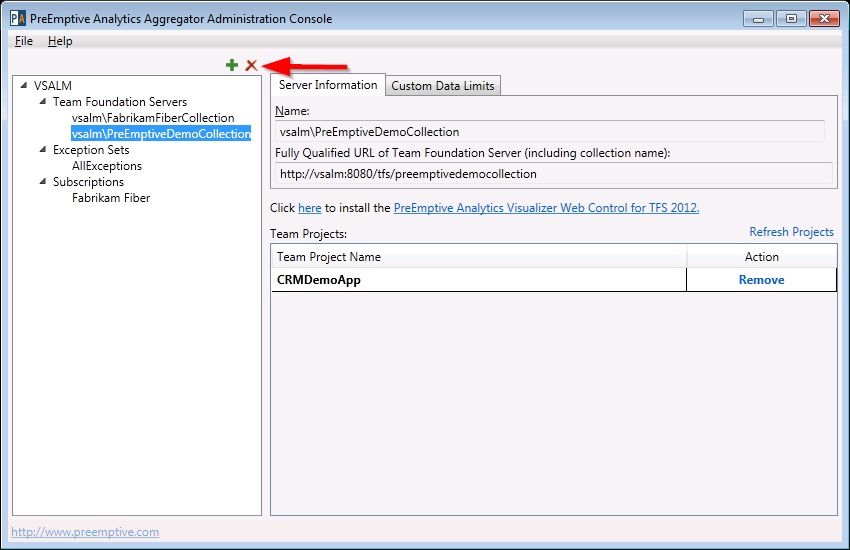
PreEmptive Analytics for TFS User Guide | 6

Installing PreEmptive Analytics for TFS

      The PreEmptive Analytics Endpoint and Aggregator are both installed by a single installer
      (PreEmptive.Analytics.Pro.Setup.exe), which can operate in either Basic or Advanced mode. Basic mode is intended
      primarily for evaluation purposes as it installs all the components on a single machine. This installer also places the Web
      Components in the same location as the Aggregator. From there, they must be manually installed in TFS Web Access.

      In Advanced mode, you can choose to install the Endpoint separately from the Aggregator, which is the more typical
      installation approach for production use.

      The Visual Studio Components are distributed by a second installer (PreEmptive.Analytics.VisualStudio.exe). The Visual
      Studio Components should be installed on all machines that have Visual Studio and will be used to access team projects
      that have work items generated by PreEmptive Analytics for TFS.

Prerequisites

      Software requirements

      All components

        Windows Vista, 7, 8, Server 2008, Server 2008 R2, Server 2012, or Server 2012 R2
        .NET 4.0 or 4.5 (.NET 4.0 will be installed automatically if neither version is present)

      Endpoint
        SQL Server 2008, 2008 R2, or 2012; or SQL Express 2008, or 2012
        IIS 7.0, 7.5, or 8.0
        Optional: A valid SSL certificate

      Aggregator
        An accessible Team Foundation Server (2010, 2012, or 2013)
        The TFS Object Model (included when installing Visual Studio)
        An installed and operating PreEmptive Analytics for TFS Endpoint

      Visual Studio Components
        An installed and operating PreEmptive Analytics for TFS Endpoint and Aggregator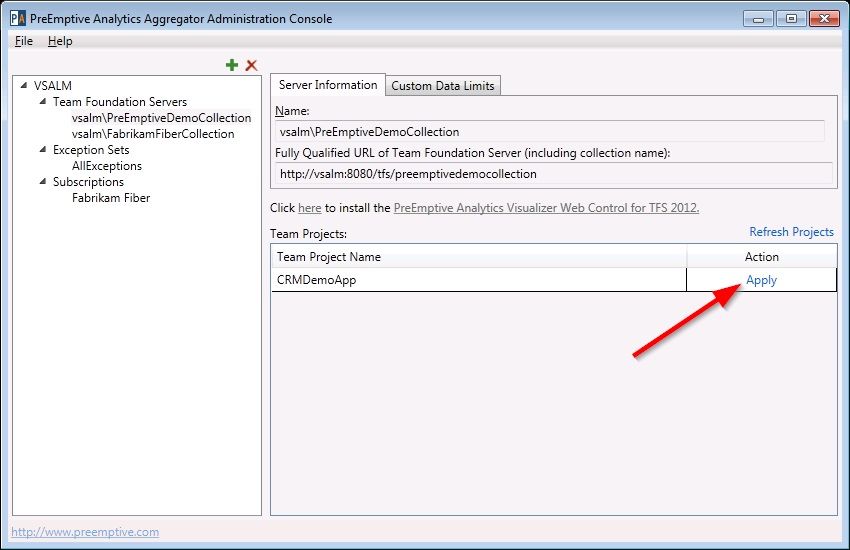
PreEmptive Analytics for TFS User Guide | 7

         Visual Studio 2010, 2012, or 2013

      Specific user account requirements
      The list below enumerates the access requirements needed for PA for TFS installation and operation. A single account can be
      used to satisfy all requirements.

      Installation requirements
         A Windows user account with rights to install software on the Endpoint and Aggregator machines.
         A Windows user account with administrative access to the SQL Server instance for the Endpoint. This user must be used to
         run the Endpoint installer.
         A TFS account with TFS administrative access to install the PreEmptive Web Components.

      Operational requirements

         A Windows user account to be used by the Endpoint to access SQL Server. This user does not need to have administrator
         access to SQL Server.
            If performing a basic install, the installer will use the same account that you supply for TFS.
            If performing an advanced install, you will specify this user account explicitly.
         A Windows user account to be used as the Application Pool identity for the new Endpoint services applications created in IIS.
         A Windows user account to run the PreEmptive Analytics Aggregator Service, with permissions to:
            Write to the file system.
            Access the network.
            Create and edit work items in Team Foundation Server.
            Optional: Query and update the TFS Maximum Attachment Size setting (only members of the “Team Foundation
            Administrators” group have access to this).

      Network access requirements
         Instrumented applications must have access to the Endpoint. The default port provided by the Endpoint installer is 8000, but
         can be changed in the installer or reconfigured after install. Port 443 will be used for SSL.
         The Endpoint must have access to the SQL Server instance where the Endpoint database resides.
         The Aggregator Service must be able to access the Endpoint using the same port configured for instrumented applications.
         (See the first bullet.)
         The Aggregator Service must have access to TFS.
         The PA for TFS configuration utility must have access to the Aggregator Configuration Service (installed along with the
         Aggregator Service) via port 80.
         Visual Studio installs on individual user machines need to have access to the PA for TFS Aggregator Configuration Service on
         port 80.

Planning a Production Installation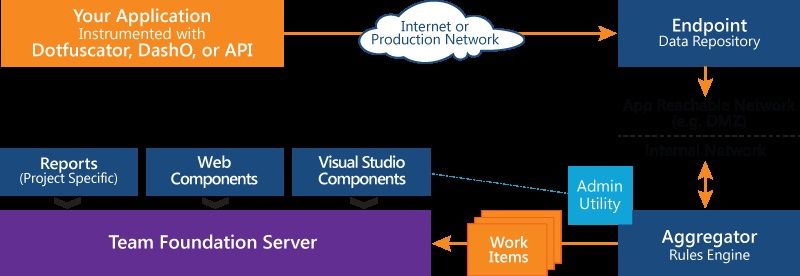
PreEmptive Analytics for TFS User Guide | 8

Endpoint and Aggregator
The Endpoint and Aggregator together provide the core feature of PreEmptive Analytics for TFS: accepting exception messages,
processing those messages through the configured rules, and creating TFS work items based on the rule results. That feature is
split across two separate runtime components in order to support different network topologies, especially corporate networks that
are split into a DMZ and an internal network.

The Endpoint is designed to run in a DMZ; it is a small web service that only accepts messages and stores them in a database.
It never sends/pushes that data anywhere else, so it does not require a firewall hole to reach the internal network. It can
respond to queries (i.e. from the Aggregator) to deliver new messages to the internal network upon request. Note that it is not
necessary to run it in a DMZ; it can be run on the same machine as the Aggregator if that meets your needs.

The Endpoint must be network-reachable by your production instrumented applications. Its host/URL should be long-lived and
stable because it will be built into your instrumented production applications.

The Endpoint requires IIS and access to a SQL Server (or SQL Express) database.

The Aggregator is designed to run inside the internal network. It is a Windows service that periodically queries the Endpoint for
new data, then processes that data through the configured rules, and then creates or updates work items in TFS as needed. The
Aggregator is also responsible for configuring individual TFS projects to use PreEmptive Analytics for TFS. It creates a local time-
limited cache of the data it processes, and also caches some state-tracking data in TFS as work item attachments.

The Aggregator must have network access (for a web service call) to the Endpoint, must have network access to the TFS server,
and must run as a user that has sufficient rights to configure TFS team projects and create and update work items in those
projects. The Aggregator is also able to query and update the TFS Maximum Attachment Size setting (as a user convenience),
but only if it is running as a user with TFS administrative rights.

One Aggregator can support multiple TFS instances and multiple team projects in each instance.

Recommendations
We recommend starting with the Endpoint and Aggregator on separate hosts. If any of your applications – now or in the future –
run outside your network, the Endpoint should be in the DMZ. If not, the Endpoint can be installed inside the internal network.
In either case, it should have a stable hostname/URL, and it should usually be on a dedicated host. The Aggregator can usually
be installed on the same host as TFS, but if you have scalability or TFS performance concerns you may want to install it on its
own machine.

There are certain scenarios that might require multiple Endpoint instances and/or multiple Aggregator instances. These scenarios
should be very rare; please contact Support if you believe you might need such a topology.

Hardware recommendations

The hardware requirements for the Endpoint and Aggregator are generally modest. Our testing demonstrated that the system
can operate normally under a load of 60 envelopes per second if the Endpoint and Aggregator are on separate VMs (with the
Aggregator on the same VM as the test TFS instance) with these specifications:
PreEmptive Analytics for TFS User Guide | 9

   Endpoint: Intel Pentium(R) D 2.80GHz, 2.00GB RAM
   Aggregator: Six-Core AMD Opteron(tm) 2439 SE 2.79GHz (2 processors), 2.00GB RAM

60 envelopes per second is a very high volume for most contexts. An envelope is a batch of messages, usually sent by the client
every 10 seconds (depending on client platform and application configuration). A typical client will send messages when the
application starts, when it shuts down, and during execution, so in the worst case an application that is only instrumented to send
exceptions will send 3 envelopes per application run. If the Endpoint is receiving 60 envelopes per second, that translates to
roughly 200 application runs per second (60 * 10 / 3).

One important variable is the number and complexity of configured rules and subscriptions. A system with many subscriptions,
each with multiple rules, will require more resources than the example provided above. It is also possible to create custom rule
types that execute arbitrary code while evaluating rules; performance in such scenarios depends heavily on the custom
implementation.

Storage requirements are typically modest, depend heavily on both the rate of message delivery and the amount of custom data
included with each exception report. To provide a baseline, a production (mobile) application that was run approximately 90,000
times, generating approximately 5,000 exceptions, with moderate custom data, used less than 100MB of storage on the
Endpoint.

Note that the Aggregator also has a configuration setting (Data Retention Days) that determines how long it should preserve its
data cache. That setting is 30 days, by default, but can be changed as described in Defining Exception Sets and Rules. The
Endpoint does not have a similar setting, but the database has stored procedures that can be manually run to clean up old
envelopes if storage size becomes an issue.

For users wishing to be cautious in large-volume environments, we recommend putting the Aggregator on a machine that is
equivalent to one of your TFS servers.

Visual Studio Components
The Visual Studio Components provide custom controls that are necessary to view the work items (incidents) created by
PreEmptive Analytics for TFS from within Visual Studio. They also provide convenients features for accessing those work items
and for viewing and editing project-specific rules and settings.

The Visual Studio Components must be installed in every instance of Visual Studio that will be used to access work items created
by PreEmptive Analytics for TFS.

Note that Visual Studio 2012 and 2013 come pre-installed with the Visual Studio Components from the Community Edition (CE) of
PreEmptive Analytics for TFS. Installing the Pro version of these components will uninstall the CE version automatically. Please
ensure you do so, to avoid version conflicts between CE Visual Studio Components and a Pro Aggregator.

Please see Installing the Visual Studio Components for instructions.

Web Components
The Web Components provide a custom control that is necessary to view work items created by PreEmptive Analytics for TFS from
within TFS Web Access. The Aggregator installer will put the Web Components on that same machine, but from there they must
be manually installed into TFS Web Access. (This is a limitation of TFS Web Access.) See Installing the Web Components for
instructions.

Reports

The Reports do not have to be administratively installed. They will be deployed to Reporting Services automatically each time the
configuration (admin) utility is used to configure a team project to work with PreEmptive Analytics for TFS, so long as the TFS
instance is configured to use Reporting Services.
PreEmptive Analytics for TFS User Guide | 10

Performing a Basic (single-machine) Installation

      What to Expect
      When performing a Basic installation, all components will be installed to the same machine (which must be running
      Microsoft Team Foundation Server). The PreEmptive Analytics Aggregator service will be installed and set to start
      automatically. A new database will be created in your local instance of SQL Server to store exception report data
      and a new website will be created in IIS to contain the PreEmptive Analytics endpoint message & query services
      (which receive exception report messages from instrumented applications and provide access to stored messages).

         The installation must be started by a user with administrative access to the local instance of SQL Server so that
         the new database can be deployed.
         You will be asked to provide credentials for a user account with permissions to create and edit work items in Team
         Foundation Server.
         This account must also be able to log on to the local SQL Server installation and will be used as the Application
         Pool identity for the new endpoint services applications created in IIS.

      Aggregator Service Configuration
      On this screen, specify the account name and password for an account that will be used to run the PreEmptive
      Analytics aggregator service and endpoint services. This account must have permissions to create and edit work items
      in the local installation of Team Foundation Server. Refer to the Team Foundation Server Administration Console to
      locate or create an account with these privileges. This account must also be able to log on to the local SQL Server
      installation, and will be used as the Application Pool identity for the new endpoint web service applications created in
      IIS. The installer will automatically assign this account the necessary rights to access the newly-created exceptions
      database and to host the endpoint web services.

      Installation Complete
      Upon successful installation, the installer will provide you with the URL of your exception message endpoint. You will
      need to provide this endpoint when using the PreEmptive Analytics API or when instrumenting your applications for
      exception reporting with PreEmptive Dotfuscator or DashO. Instrumented applications must be able to access this
      endpoint, so you may need to adjust firewall settings to allow your target applications to send data to this endpoint.
      For more information about instrumenting your applications, see the Adding Exception Reporting to an
      Application topic.

      Once you close the installer, the PreEmptive Analytics configuration utility will launch to allow you to provision team
      projects for PreEmptive Analytics and to define rules and subscriptions to guide the creation of Incident work items.
      For more information, see the Configuring PreEmptive Analytics for TFS topic.

      Visual Studio Components
      The Visual Studio Components provide custom controls that are necessary to view the work items (incidents) created
      by PreEmptive Analytics for TFS from within Visual Studio. They also provide convenients features for accessing those
      work items and for viewing and editing project-specific rules and settings.

      The Visual Studio Components must be installed in every instance of Visual Studio that will be used to access work
      items created by PreEmptive Analytics for TFS.

      Note that Visual Studio 2012 and 2013 come pre-installed with the Visual Studio Components from the Community
      Edition (CE) of PreEmptive Analytics for TFS. Installing the Pro version of these components will uninstall the CE
      version automatically. Please ensure you do so, to avoid version conflicts between CE Visual Studio Components and
      a Pro Aggregator.

      Please see Installing the Visual Studio Components for instructions.
PreEmptive Analytics for TFS User Guide | 11
Upload the Web Components (optional)
In order for users to view Incident work items in Team Foundation Server Web Access, a TFS administrator must
upload and enable the PreEmptive Analytics Web Components. Follow the instructions in the Installing the Web
Components Components topic to enable this functionality for your users.
Performing an Advanced Installation
When performing a Advanced installation, you choose whether to install only the endpoint services, only the aggregator
service, or both the endpoint and aggregator services.
When Installing the Endpoint, you choose a SQL Server instance in which to create a new database (or reuse an
existing database) to store exception report messages and customize the installation of the PreEmptive Analytics
endpoint message & query services (which receive exception report messages from instrumented applications and
provide access to stored messages).
When Installing the Aggregator, you customize the installation of the PreEmptive Analytics Aggregator service
and configure it to retrieve exception report data from the PreEmptive Analytics endpoint services hosted on another
machine.
When Installing the Endpoint and Aggregator Together, both the PreEmptive Analytics endpoint services and the
PreEmptive Analytics Aggregator service are installed on the local machine similar to performing a Basic installation.
However, you will have the ability to customize each component as described above.
Installing the Endpoint
What to Expect
Installing the Endpoint creates a new database in an instance of SQL Server to store exception report data (or reuses an
existing exception database) and creates a website in IIS to host the PreEmptive Analytics for TFS endpoint message &
query services (which receive exception report messages from instrumented applications and provide access to stored
messages).
The installation must be started by a user with administrative access to the target instance of SQL Server so that the
database can be deployed/reused.
You will be asked to provide account credentials to be used as the Application Pool identity for the new Endpoint
services applications created in IIS.
You will choose whether to also use this account for Integrated Security authentication to the target instance of SQL
Server or whether to provide a login and password for use with SQL Authentication.
Endpoint IIS Configuration
On this screen, specify the account name and password to be used as the IIS Application Pool identity for the PreEmptive
Analytics for TFS Endpoint services. When you choose to use Integrated Security for communication between the
endpoint services and SQL Server, this account will also be granted permissions to log on to the target instance of SQL
Server.
Next, specify the name of the IIS Application Pool that will be used to host the endpoint services and select the IIS
website into which the PreEmptive Analytics endpoint services will be installed. When the website already exists, the
endpoint services applications will be added to the root of the website and its port binding will not be modified. When the
website does not exist, it will be created and a binding will be added to listen on the port specified.
Finally, specify the location on disk into which the PreEmptive Analytics program files will be installed.PreEmptive Analytics for TFS User Guide | 12
Endpoint SQL Configuration
On this screen, specify the hostname of the SQL Server instance in which a new database will be created, or where an
existing exception database exists, to store exception report message data. Specify the name of the database to be
used.
Next, select either Integrated Security or SQL Authentication to be used for communication between the endpoint
services and the SQL Server database. When using Integrated Security, the IIS Application Pool user account specified in
the Exception Endpoint IIS Configuration screen will be used. The installer will create a new Integrated Security or
SQL Authentication login on the target SQL Server instance if one does not exist and the specified login will be granted
permission to use the newly-created database.
Installation Complete
At completion, the installer displays the URL of your exception message endpoint. Specify this endpoint URL when using
the PreEmptive Analytics API or when instrumenting your applications for exception reporting with PreEmptive
Dotfuscator or DashO. Instrumented applications must be able to reach this endpoint and you may need to adjust
firewall settings to allow your target applications to send data to this endpoint. For more information about
instrumenting your applications, see the Adding Exception Reporting to an Application topic.
The installer also displays the URL of your endpoint query service. An Aggregator service running on another machine
will communicate with this endpoint query service to retrieve exception data in order to create Incident work items.
During the installation of the Aggregator on the remote machine, you will be asked to provide this URL. For more
information, see the Installing the Aggregator topic.
Installing the Aggregator
What to Expect
Installing the Aggregator creates the PreEmptive Analytics for TFS Aggregator service and sets it to start automatically
at Windows startup.
You will be asked to provide credentials for a user account with permissions to create and edit work items in Team
Foundation Server.
Aggregator Service Configuration
On this screen, specify the account name and password for an account that will be used to run the Aggregator service.
This account must have permissions to create and edit work items in the Team Foundation Server. Refer to the Team
Foundation Server Administration Console to locate or create an account with these privileges. Specify the location on
disk into which the PreEmptive Analytics program files will be installed.
Next, specify the URL of the endpoint query service running on another machine where the Endpoint is installed and
running. The aggregator service will communicate with the provided endpoint query service to retrieve exception data in
order to create Incident work items. When the Endpoint was installed, the URL was provided. For more information, see
the Installing the Endpoint topic.
Installation Complete
Once you close the installer, the PreEmptive Analytics for TFS configuration utility launches. Use this utility to provision
team projects for PreEmptive Analytics for TFS and to define rules and subscriptions to guide the creation of Incident
work items. For more information, see the Configuring PreEmptive Analytics for TFS topic.
Upload the Web Components (optional)PreEmptive Analytics for TFS User Guide | 13
To view Incident work items in TFS Web Access, a TFS administrator must upload and enable the PreEmptive Analytics
for TFS Web Components. Follow the instructions in the Installing the Web Components topic to enable this functionality
for your users.
Installing the Endpoint and Aggregator Together
When installing the Endpoint and Aggregator together, all components will be installed to the same machine. The
PreEmptive Analytics for TFS Aggregator service will be installed and set to start automatically at Windows startup.
You will be asked to provide credentials for a user account with permissions to create and edit work items in Team
Foundation Server
A new database will be created in an instance of SQL Server to store exception report data (or an existing
database reused)
The installation must be started by a user with administrative access to the target instance of SQL Server so that
the new database can be deployed (or the existing database reused)
A new website will be created in IIS to contain the endpoint message & query services (which receives exception
report messages from instrumented applications and provides access to stored messages)
You will be asked to provide account credentials to be used as the Application Pool identity for the new endpoint
services applications created in IIS
You will choose whether to also use this account for Integrated Security authentication to the target instance of
SQL Server or whether to provide a login and password for use with SQL Authentication
Aggregator Service Configuration
On this screen, specify the account name and password for an account that will be used to run the Aggregator
service. This account must have permissions to create and edit work items in the Team Foundation Server. Refer to
the Team Foundation Server Administration Console to locate or create an account with these privileges. Specify the
location on disk into which the PreEmptive Analytics program files will be installed.
Endpoint IIS Configuration
On this screen, specify the account name and password to be used as the IIS Application Pool identity for the
PreEmptive Analytics for TFS Endpoint services. When you choose to use Integrated Security for communication
between the endpoint services and SQL Server, this account will also be granted permissions to log on to the target
instance of SQL Server.
Next, specify the name of the IIS Application Pool that will be used to host the endpoint services and select the IIS
website into which the PreEmptive Analytics endpoint services will be installed. When the website already exists, the
endpoint services applications will be added to the root of the website and its port binding will not be modified. When
the website does not exist, it will be created and a binding will be added to listen on the port specified.
Endpoint SQL Configuration
On this screen, specify the hostname of the SQL Server instance in which a new database will be created to store
exception report message data. Specify the name of the database to be used. Ensure that there is not an existing
database with the same name on the selected instance of SQL Server.
Next, select either Integrated Security or SQL Authentication to be used for communication between the endpoint
services and the SQL Server database. When using Integrated Security, the IIS Application Pool user account
specified in the Endpoint IIS Configuration screen will be used. The installer will create a new Integrated Security
or SQL Authentication login on the target SQL Server instance if one does not exist and the specified login will be
granted permission to use the newly-created database.PreEmptive Analytics for TFS User Guide | 14
Installation Complete
At completion, the installer displays the URL of your exception message endpoint. Specify this endpoint URL when
using the PreEmptive Analytics API or when instrumenting your applications for exception reporting with PreEmptive
Dotfuscator or DashO. Instrumented applications must be able to reach this endpoint and you may need to adjust
firewall settings to allow your target applications to send data to this endpoint. For more information about
instrumenting your applications, see the Adding Exception Reporting to an Application topic.
Once you close the installer, the PreEmptive Analytics for TFS configuration utility launches. Use this utility to
provision team projects for PreEmptive Analytics for TFS and to define rules and subscriptions to guide the creation of
Incident work items. For more information, see the Configuring PreEmptive Analytics for TFS topic.
Visual Studio Components
The Visual Studio Components provide custom controls that are necessary to view the work items (incidents) created
by PreEmptive Analytics for TFS from within Visual Studio. They also provide convenients features for accessing those
work items and for viewing and editing project-specific rules and settings.
The Visual Studio Components must be installed in every instance of Visual Studio that will be used to access work
items created by PreEmptive Analytics for TFS.
Note that Visual Studio 2012 and 2013 come pre-installed with the Visual Studio Components from the Community
Edition (CE) of PreEmptive Analytics for TFS. Installing the Pro version of these components will uninstall the CE
version automatically. Please ensure you do so, to avoid version conflicts between CE Visual Studio Components and
a Pro Aggregator.
Please see Installing the Visual Studio Components for instructions.
Upload the Web Components (optional)
To view Incident work items in TFS Web Access, a TFS administrator must upload and enable the PreEmptive
Analytics for TFS Web Components. Follow the instructions in the Installing the Web Components topic to enable this
functionality for your users.
Securing the Components
This guide shows how to configure PreEmptive Analytics for TFS to use authentication and encrypted connections.
The reader is assumed to be familiar with IIS and with the PreEmptive Analytics for TFS components and architecture.
Configuring the Endpoint and Fault Query Service for SSL
This step configures the endpoint and Fault Query Service such that they support SSL connections. It is possible to
configure each service independently (e.g. if you require SSL only on the endpoint but not on the Fault Query Service,
it can be configured that way.).
IIS Configuration
1. Install the certificate on the IIS instance that is hosting the endpoint (directions for this are IIS version specific
and are independent of PreEmptive Analytics for TFS—the configurer is assumed to be familiar with the
process).
2. Ensure the certificate is either signed by a Certificate Authority (CA) that clients trust by default or (e.g. if you
are testing) that clients are configured to trust the certificate.
3. Add an https binding for the "PreEmptive Analytics Endpoint" site in IIS. Use the certificate that was installed
above.PreEmptive Analytics for TFS User Guide | 15
4. In IIS, modify the SSL settings for the Fault Query Service (i.e. the "analytics" webapp) and Endpoint
("message" webapp) as needed. For example, you can choose to require SSL for the Endpoint and the
FaultQuery service.
5. Verify that any firewalls are configured to allow inbound traffic on the configured ports for the configured
protocols.
Checkpoint
If IIS is configured correctly, you should now be able to access both the endpoint and the Fault Query Service via
HTTPS URLs from a remote client browser. For example:
Going to https://[hostname]:[port]/message/Endpoint.ashx should result in “405 Method not allowed”.
Going to https://[hostname]:[port]/analytics/FaultQuery.svc should show the service page.
Additionally, instrumented applications now ought to be able to send analytics messages to the endpoint using SSL on
port 443.
Proceed to the next step to finish configuring the Fault Query Service.
Fault Query Service Configuration
Next, to configure the Fault Query Service to use Transport Mode security, update the "analytics" webapp's
web.config file:
1. Add the following binding under the "webHttpBinding" element:
2. Add the following endpoint under the "service" element:
Configuring the Aggregator to use SSL when connecting to the Fault
Query Service
This step configures the Aggregator’s Fault Query Service client to connect to the service using SSL.
1. Stop the aggregator service.
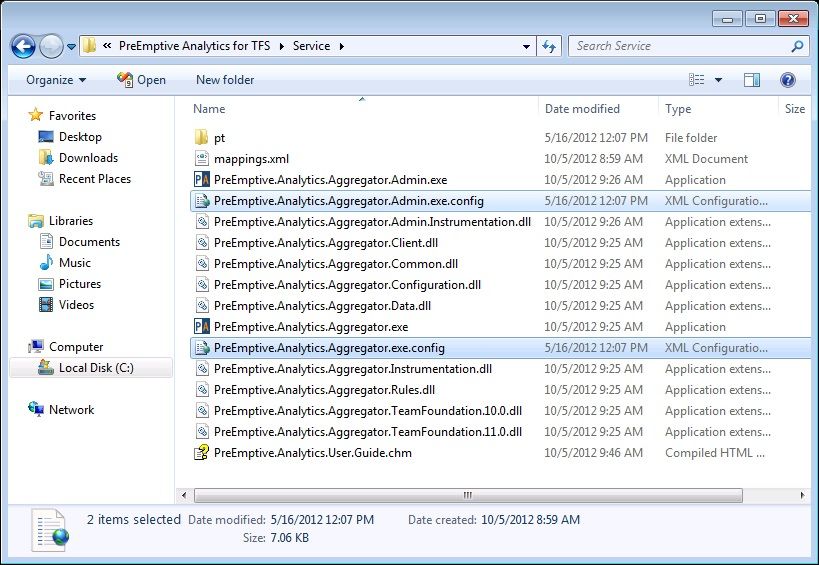
2. Edit the PreEmptive.Analytics.Aggregator.exe.config (located here by default: C:\Program Files
(x86)\PreEmptive Solutions\PreEmptive Analytics for TFS\Service).
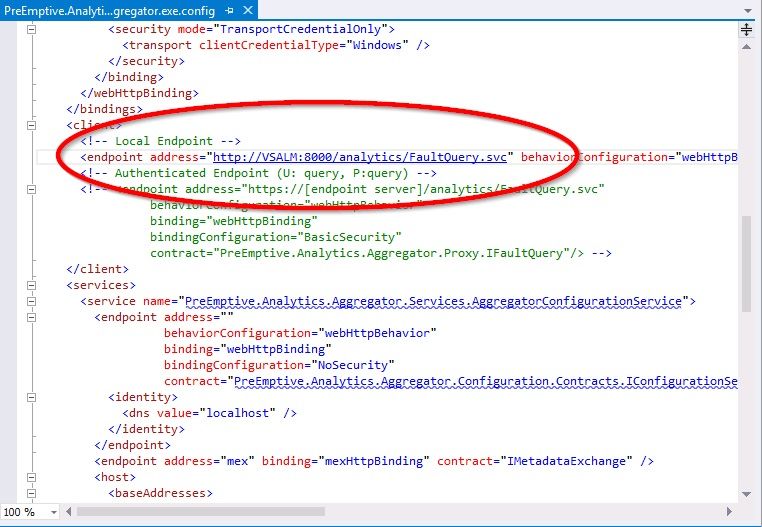
3. Ensure there is a binding defined that uses "Transport" security mode, like this:PreEmptive Analytics for TFS User Guide | 16
4. Replace the endpoint in the "client" section with this:
5. Start the aggregator service.
Checkpoint
If the aggregator and Fault Query Service are configured correctly, the aggregator should be connecting to the Fault
Query Service using SSL on port 443. This can be verified using a tool like Fiddler Web Debugger (which can be
configured to decrypt HTTPS traffic), or by looking at the IIS web logs for the Fault Query Service—the logged
requests from the aggregator should indicate a 202 response code.
Configuring the Fault Query Service for Authentication
This step configures the Fault Query Service to require a user name and password for client connections. It is
assumed (and highly recommended) that the Fault Query Service and Aggregator have already been configured to
use SSL. Further, it is recommended that the Fault Query Service be configured to require SSL (this can be done in
IIS).
1. Make sure IIS has the required authentication module installed (e.g. Basic Authentication). On Windows 8,
this is done via "Add/Remove Windows Features"
2. In IIS manager, configure the "analytics" webapp to use the authentication you want (e.g. Basic
Authentication)
3. In the web config file for "analytics", update the binding to reflect the credential type you are using.
4. Setup the account and credentials you want to use for accessing the service. This depends on which
authentication mode you have chosen.
Checkpoint
If IIS and authentication is configured correctly, you should now only be able to access the fault query service from a
client browser if you are authenticated. For example, if you are using Basic Authentication, you should be prompted
for credentials when you visit:
https://[hostname]:[port]/analytics/FaultQuery.svc
Once successfully authenticated you should see the service page.PreEmptive Analytics for TFS User Guide | 17
Configuring the Aggregator to use Authentication for the Fault
Query Service
This step configures the Aggregator’s Fault Query Service client to provide credentials to the service.
1. Stop the aggregator service.
2. In the aggregator service’s app config file, update the binding to reflect the credential type you are using (it
must match the type defined in the service configuration).
3. Add the credentials to the aggregator's app configuration file:
...
4. Restart the aggregator service
Checkpoint
If the aggregator and Fault Query Service are configured correctly, the aggregator should be connecting to the Fault
Query Service using SSL on port 443. The aggregator should be providing credentials using the configured mode.
This can be verified using a tool like Fiddler Web Debugger (which can be configured to decrypt HTTPS traffic), or by
looking at the IIS web logs for the Fault Query Service—the logged requests from the aggregator should indicate a
202 response code for authenticated, authorized clients and a 401 for unauthorized clients.
Configuring the Aggregator’s Configuration Service to use SSL
Not currently supported.
Authentication for the Aggregator’s Configuration Service
Not currently supported.
Installing the Visual Studio Components
The Visual Studio Components provide custom controls that are necessary to view the work items (incidents) created by
PreEmptive Analytics for TFS from within Visual Studio. They also provide convenient features for accessing those work
items and for viewing and editing project-specific rules and settings.
The Visual Studio Components must be installed in every instance of Visual Studio that will be used to access work items
created by PreEmptive Analytics for TFS.
Note that Visual Studio 2012 and 2013 come pre-installed with the Visual Studio Components from the Community
Edition (CE) of PreEmptive Analytics for TFS. Installing the Pro version of these components will uninstall the CE version
automatically. Please ensure you do so, to avoid version conflicts between CE Visual Studio Components and a Pro
Aggregator.PreEmptive Analytics for TFS User Guide | 18
To install the Visual Studio Components:
1. Execute the Visual Studio Components Installer (PreEmptive.Analytics.VisualStudio.exe).
2. Accept the license agreement and click Install.
3. Close and re-open Visual Studio.
Installing the Web Components
In order for users to view Incident work items in Team Foundation Server Web Access, a TFS administrator must follow
the following instructions:
Upload the PreEmptive Analytics Web Components for Web Access
in TFS 2012 or later
1. Navigate to the TFS Web Access site in your browser.
2. Click the Administer Team Foundation Server tile (or the gear icon in the top-right of the page if the tile is not
visible).
3. Select the Extensions tab and choose Install New.
4. Click the Browse... button and select the PreEmptiveAnalyticsVisualizer.zip file from the Web subfolder within the
PreEmptive Analytics installation directory (by default, [ProgramFilesFolder]\PreEmptive Solutions\PreEmptive
Analytics).
5. Click OK to upload and install the extension.
6. Click the Enable button next to the PreEmptive Analytics Aggregator Visualizer extension.
7. Click OK in the dialog prompting you to grant access to the extension.
Upload the PreEmptive Analytics Web Components for Web Access in
TFS 2010
1. Browse to the the Web subfolder within the PreEmptive Analytics installation directory (by default,
[ProgramFilesFolder]\PreEmptive Solutions\PreEmptive Analytics).
2. Locate the files PreEmptive.Analytics.Aggregator.WebControl.10.0.dll and
PreEmptiveAnalyticsVisualizer.wicc.
3. Copy these two files to the "Application Tier\Web Access\Web\App_Data\CustomControls" subfolder within the
Team Foundation Server 2010 installation directory (by default, [ProgramFilesFolder]\Microsoft Team Foundation
Server 2010).PreEmptive Analytics for TFS User Guide | 19
Configuring PreEmptive Analytics for TFS
To integrate PreEmptive Analytics with your team projects, you must connect the PreEmptive Analytics for
TFS Aggregator service to your Team Foundation Server instance and provision team projects for use with PreEmptive
Analytics for TFS. Provisioned team projects can define subscriptions to receive exception report data for instrumented
applications and rules to define how and when to create Incident work items from these exception reports.
Provisioning Team Projects
The PreEmptive Analytics for TFS Aggregator service connects to your Team Foundation Server to create and modify
Incident work items in response to configured rules which can include criteria such as the type and quantity of exception
reports received. To begin using this functionality, launch the Configuration Utility to connect to your Team Foundation
Server and provision your team projects for use with PreEmptive Analytics for TFS.
Verify the aggregator service installation
1. From the Start menu, launch the PreEmptive Analytics Configuration utility.
2. The Aggregator Configuration URL will be displayed. If there is an error connecting to the Aggregator
Configuration service, it must be corrected before you can proceed. See the Troubleshooting the Aggregator topic
for steps in solving issues with the aggregator service.
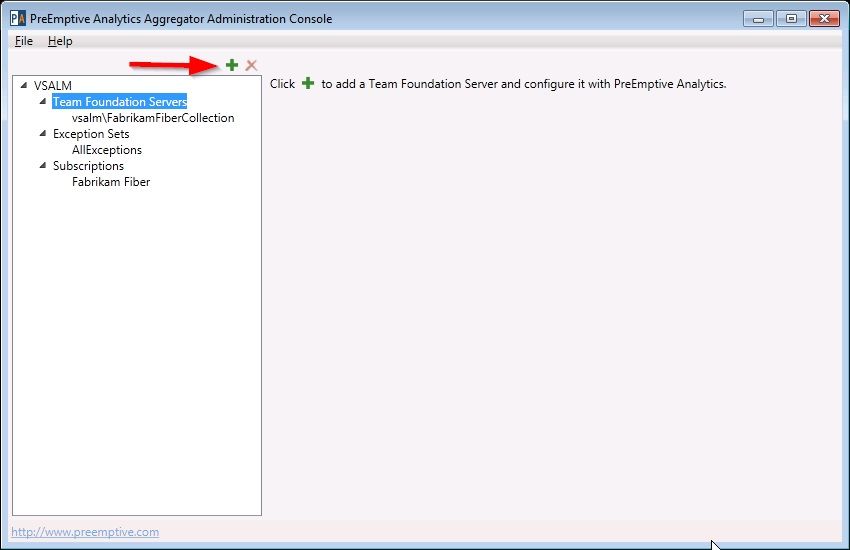
Connect to team project collections
1. Select the Team Foundation Servers node and click the + button.
2. Choose one of the configured servers from the dropdown or add a new Team Foundation Server by clicking the
Servers... button.
3. If the logged-in user does not have permissions to access the desired Team Foundation Server or team project
collection, click the Use Different Credentials link and supply credentials with the desired permissions.
4. Select a team project collection and click Connect.
Once you have created rules that reference this team project collection, you will not be able to delete it or
change the Name or Fully Qualified URL fields without first removing all the rules that reference it.
Provision team projects for PreEmptive Analytics for TFS
Team projects must be provisioned to be used with PreEmptive Analytics for TFS. In the Team Projects list, each team
project in the collection is displayed along with its provisioning status. During provisioning, the Incident work item type
and sample PreEmptive Analytics for TFS reports are imported into the project template. The project is also configured
for use by the PreEmptive Analytics for TFS Visual Studio extension. To provision a team project to use PreEmptive
Analytics for TFS, click the Apply link next to the desired team project. Modifications made during the provisioning
process can be rolled back by selecting the Remove link next to any provisioned team project.PreEmptive Analytics for TFS User Guide | 20
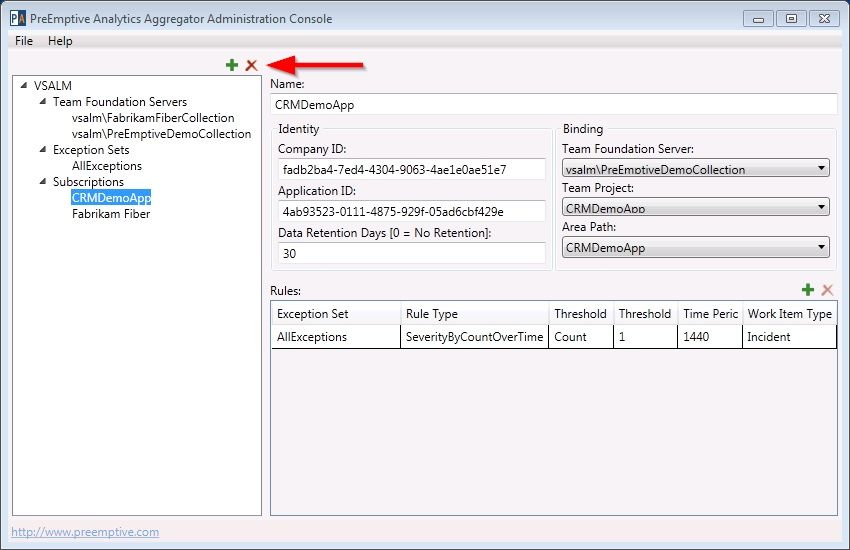
Defining Exception Sets and Rules
Once you have provisioned a team project, you can begin defining the rules that tell PreEmptive Analytics for TFS how
to map incoming exception information to work items in those projects. That mapping is defined by use
of Subscriptions and Exception Sets which are configured via the PreEmptive Analytics for TFS Configuration
Utility.
Each subscription contains information about:
The Company ID and Application ID of the application
The team project (in TFS) in which the work items should be created
The particular rule(s) that decide whether to create a new work item
Each rule contains settings, including:
The exceptions to match (via an exception set)
The type of rule (e.g. "count the number of exception reports")
The thresholds and time limits to use when evaluating the rule
The type of work item to create (.e. 'Incident')
Each exception set contains a list of exceptions, including:
Name of the exception class
Whether the exception was uncaught, caught, and/or thrown
Create exception sets
1. On the machine where the Aggregator Service is installed, launch the PreEmptive Analytics Configuration
Utility from the Start menu, PreEmptive Solutions, PreEmptive Analytics program group.
2. Select the Exception Sets node in the navigation panel.
3. Click the + icon to add a new, empty exception set. Provide a name for this exception set in the Name field.
4. In the Exceptions grid, add a new row for each exception type you would like to track. Fill in the fully-qualified
exception type name (such as System.Net.WebException or java.io.FileNotFoundException) in the
Exception Type column, and provide a name for this exception type (typically the unqualified exception type
name) in the Exception Name column.
PreEmptive Analytics for TFS does not attempt to traverse the inheritance hierarchy of reported
exceptions. For example, adding a rule for System.ApplicationException will not automatically
match reported exceptions that are sub-types of System.ApplicationException.
5. In the Exception Category column, you may choose whether this exception set should match Uncaught,
Caught, and/or Thrown exceptions. Instrumented applications will send this category information along with
the exception report data in order to provide context around the situation in which the exception occurred.
Incident work items contain exception information for only one exception category. If an exception set
specifies multiple exception categories, then matching exception report messages will be aggregated into
different Incident work items based on their exception category.
6. Save the Exception Set changes by pressing Ctrl-S or invoking the File | Save menu action.
Once you have created rules that reference this exception set, you will not be able to delete it or change
the Name field without first removing all the rules that reference it.
Create subscriptions (rules)PreEmptive Analytics for TFS User Guide | 21
1. Launch Visual Studio and navigate to the Team Explorer pane. Provisioned team projects will show a
PreEmptive Analytics entry.
2. Click the PreEmptive Analytics node to open the PreEmptive Analytics hub.
3. In the Settings group, click Configure. This will launch the rule configuration window.
4. Click on the General node in the left navigation.
5. Select the Subscriptions node in the left navigation, and click the + icon to add a new, empty subscription.
6. Provide a name for this subscription in the Name field.
7. In the Identity group box, supply the Company and Application ID values you used when instrumenting your
application to send exception reporting data. For more information on how to add and configure exception
reporting in your applications, see Adding Exception Reporting to an Application.
8. Leave the value of the Data Retention Days field set to the default of 30 unless you wish to change the
duration for which the aggregator service will keep detailed data for each received exception.
9. In the Team Foundation Server group box, optionally specify the area path you wish to use for the created
work items in the Area Path field.
10. In the Rules grid, you can create rules to be applied to exception reports received from the application you
specified above. Please see Rule Types for details.
We recommend starting with a relatively simple configuration and then adjusting that configuration as you see
exception data come in from production applications. Determining the correct settings is primarily a matter of
“tuning” the rules to achieve the outcome you want, and it is easiest if you start with very permissive rules (i.e.
that create work items for every incident).
To start this way, use the default All Exceptions exception set with the ErrorCountOverTime rule type, and a
Threshold of 1.
From there, you have many options:
1. Increase the threshold and adjust the time period of the default (ErrorCountOverTime) rule
2. Switch the default rule to the TopErrorsOverTime rule type, and tune that rule. (This is especially useful
if you have a high volume of exceptions.)
3. Create additional exception sets that watch for specific exceptions, and add additional rules to the
subscription to fine-tune how individual exception classes are processed.
4. Look on the Downloads page on preemptive.com for new rule types that might be useful for you.
5. Create your own custom rule to suit your particular need. Please contact us to learn more.
6. Any combination of the above.
You can add additional subscriptions to process exception reporting data from other applications or from the same
application using a different Area Path by selecting the Subscriptions node and clicking the + icon to create
additional subscriptions.
Rule Types
When configuring a rule in a subscription, you have one or more options for different Rule Types. PreEmptive Analytics
for TFS comes with some Rule Types already installed. Additional Rule Types may be available for download under My
Account on preemptive.com, or can be created to support custom behavior.
Rule Types included with PreEmptive Analytics for TFS
ErrorCountOverTime
Create a work item when the number of exception occurrences exceeds a defined count in a given length of time.PreEmptive Analytics for TFS User Guide | 22
1. Choose the exception set you wish to use for this rule in the Exception Set dropdown. All exceptions that are
included in this set can potentially trigger the execution of the rule.
2. In the Time Period (Minutes) column, specify the length of time back from the current check time in which to sum
exception report occurrences and evaluate whether the defined count has been exceeded. A work item is created
when the threshold count is exceeded. The default is one day (1440 minutes).
3. In the Threshold column, specify the exception occurrence count that, when exceeded in the specified time
period, triggers work item creation.
InstancesPerErrorOverTime
Create a work item when the number of instances of running application sending an identical exception exceeds a
defined threshold over a given length of time. This rule is useful for identifying particular errors that are affecting a large
amount of users. An "instance" is identified by the "Instance ID" field sent with the exception data by instrumented client
applications.
1. Choose the exception set you wish to use for this rule in the Exception Set dropdown. All exceptions that are
included in this set can potentially trigger the execution of the rule.
2. In the Time Period (Minutes) column, specify the length of time back from the current check time in which to sum
number of instances per exception and evaluate whether the defined count has been exceeded. A work item is
created when the threshold count is exceeded. The default is one day (1440 minutes).
3. In the Threshold column, specify the instance count that, when exceeded in the specified time period, triggers
work item creation.
TopErrorsOverTime
Create work items for any exceptions whose exception occurrence count is in the top N occurrence counts within a
defined time length. At least half the defined time length must elapse before any work items are created.
1. Choose the exception set you wish to use for this rule in the Exception Set dropdown. All exceptions that are
included in this set can potentially trigger the execution of the rule.
2. In the Time Period (Minutes) column, specify the length of time back from the current check time in which to sum
exception report occurrences and evaluate which exceptions have the top N exception counts. A work item is
created for an exception when it is first evaluated as having a top N exception count. The default is one day
(1440 minutes). Note that no work items will be created until half the time period has elapsed.
3. In the Threshold column, specify the number of top exceptions (Top n) within the defined time period for which to
create work items. "Top" refers to those exceptions having the greatest number of exception report occurrences.
Possible Surprises
There are two aspects of the design of PreEmptive Analytics for TFS that might result in unexpected (but intentional)
behavior. These aspects are described in the sections below.
Historical Data
PreEmptive Analytics for TFS is designed around a “subscription” model for processing data. What that means is that, in
most cases, new subscriptions and new rules will only process data that is received after the subscription or rule is
created. Any previously-received data will not be re-evaluated when a new subscription or rule is created.
On the other hand, once a rule is active, it will cache any data that matches its settings and use that data as needed to
correctly perform its function. The historical data cache is preserved as far back as the “Data Retention Days” field
specifies, but each rule only looks as far back as its “Time Period,” which is usually less.
Work Item UniquenessPreEmptive Analytics for TFS User Guide | 23
A key feature of PreEmptive Analytics for TFS is that once a work item is created for a given exception, new instances of
that same exception will simply update the prior work item rather than creating a new work item. This generally works
as users expect but there are some scenarios that may be surprising.
The key to the issue lies in defining the term “same exception” – i.e. how does PreEmptive Analytics for TFS decide
whether a new exception report matches an old one? Some of the fields it uses can cause surprising side effects:
Stack Trace: our intuitive understanding of whether two exceptions are the “same” would suggest that the stack
trace is a critical part of that sameness. However, it is possible for a single line of code to cause the same exception
type to be thrown (e.g. NullReferenceException) even though it was called from multiple sources. Each of those
sources would represent a different stack trace so PreEmptive Analytics for TFS will treat those as different work
items. In most cases this is the desired behavior but there are some situations where it might be preferable to create
a single work item for all the different stack traces. PreEmptive Analytics for TFS has no way of identifying those
cases, though, so it uses the more-informative option.
Application Version: PreEmptive Analytics for TFS does not create a new work item for each distinct version of your
application that generates the same exception. Instead, it creates a single work item and updates it with counts from
all versions, assuming the stack traces remain identical across those versions. This may be undesirable if you fix a
bug and then it crops up again (with the exact same stack trace) – no new work item will be created. PreEmptive
Analytics for TFS will, however, update the Version field in the work item to reflect the version reported by each new
exception report.
Rule ID: work items are tied explicitly to the specific rule that created them. That has two possibly-unexpected
consequences:
First, if two rules both match the same exception, and both meet their threshold (at the same time or in
sequence), two work items will be created. It will be clear from the work item titles that they came from two
different rules but it may still be undesirable behavior. Depending on the rule configuration, though, the presence
of multiple work items for the same exception could indicate that the exception is especially severe.
Second, if a rule is deleted, any work items that were created by that rule will stop being updated. Recreating an
exact copy of that rule will actually create new copies of each of the work items (as new exceptions come in and
the thresholds are reached again) and begin updating those new work items from then forward.
Configuring the New Data Check Interval
The new data check interval defines the frequency of checking for new exception reports and corresponding rule
evaluation. The default check interval is 60 seconds.
To change the check interval, you must use the PreEmptive Analytics Configuration Utility installed on the machine
running the Aggregator Service. To change the check interval:
1. On the machine where the Aggregator Service is installed, launch the PreEmptive Analytics Configuration Utility
from the Start menu, PreEmptive Solutions, PreEmptive Analytics program group.
2. Select the root machine node in the navigation panel.
3. Locate the Aggregator Service Check Interval edit box and enter the number of seconds to wait between checks
for new data. The default check interval is 60 seconds.
4. Save the Exception Set changes by pressing Ctrl-S or invoking the File | Save menu action.
Configuring Custom Data Attachment Limits
When an application is instrumented to send custom data along with exception reports, the custom data is attached to
corresponding work items. Limits on the quantity of custom data attached to a work item are set for each TFS server.
The default attachment size is 4 megabytes of compressed data and an unlimited number of rows that fit within the 4
megabytes. To change the custom data attachment limits, use the PreEmptive Analytics Configuration Utility installed on
the machine running the Aggregator Service.
There are three settings that control the construction of custom data attachments.You can also read