Air quality monitoring report for Hamilton, Tokoroa, Taupo, Te Kuiti, Putaruru, Turangi, Cambridge and Te Awamutu-Kihikihi 2014
←
→
Page content transcription
If your browser does not render page correctly, please read the page content below
Waikato Regional Council Technical Report 2015/05

Air quality monitoring report for
Hamilton, Tokoroa, Taupo, Te
Kuiti, Putaruru, Turangi,
Cambridge and Te Awamutu-
Kihikihi - 2014

www.waikatoregion.govt.nz
ISSN 2230-4355 (Print)
ISSN 2230-4363 (Online)
Prepared by:
Jonathan Caldwell

For:
Waikato Regional Council
Private Bag 3038
Waikato Mail Centre
HAMILTON 3240

23 October 2015

Document #: 3267844
Peer reviewed by:
Dr Emily Wilton
(Environet Ltd)               Date     July 2015

Approved for release by:
Dr Dominique Noiton           Date     November 2015

Disclaimer
This technical report has been prepared for the use of Waikato Regional Council as a reference
document and as such does not constitute Council’s policy.

Council requests that if excerpts or inferences are drawn from this document for further use by
individuals or organisations, due care should be taken to ensure that the appropriate context
has been preserved, and is accurately reflected and referenced in any subsequent spoken or
written communication.

While Waikato Regional Council has exercised all reasonable skill and care in controlling the
contents of this report, Council accepts no liability in contract, tort or otherwise, for any loss,
damage, injury or expense (whether direct, indirect or consequential) arising out of the provision
of this information or its use by you or any other party.

Doc # 3267844
Doc # 3267844
Acknowledgement
The efforts of the Environmental Monitoring team, particularly Kane Lynn, are gratefully
acknowledged for collection and management of the monitoring data used in this report and
servicing and maintenance of the monitoring stations used. Ian Buchanan is also thanked for
coordinating laboratory services.

Doc # 3267844                                                                        Page i

Table of contents
Executive summary vi
1 Introduction 1
1.1 Reporting period 4
2 Methodology 6
3 Hamilton 8
3.1 Air quality monitoring in Hamilton 8
3.2 PM10 concentrations for Hamilton 9
3.3 Concentrations of benzene, toluene and xylenes 17
3.4 Concentrations of carbon monoxide 18
3.5 Concentrations of nitrogen dioxide 19
3.6 Comparison of meteorological conditions for 2014 to previous years 20
3.7 Daily variations on high pollution days 22
3.8 Trend analysis 24
4 Tokoroa 25
4.1 Air Quality Monitoring in Tokoroa 25
4.2 PM10 concentrations in Tokoroa 25
4.3 Daily variations in PM10 and meteorology on high pollution days 30
4.4 Trend Analysis 32
5 Taupo 36
5.1 Air quality monitoring in Taupo 36
5.2 PM10 concentrations in Taupo 37
5.3 Daily variations in PM10 and meteorology on high pollution days 41
5.4 Trend analysis 41
6 Te Kuiti 44
6.1 Air quality monitoring in Te Kuiti 44
6.2 PM10 concentrations in Te Kuiti 45
6.3 Daily variations in PM10 and meteorology on high pollution days 49
6.4 Trend analysis 49
7 Putaruru 51
7.1 Air quality monitoring in Putaruru 51
7.2 PM10 concentrations in Putaruru 52
7.3 Trend analysis 56
8 Turangi 58
8.1 Air quality monitoring in Turangi 58
8.2 PM10 concentrations in Turangi 58
9 Cambridge 62
9.1 Air quality monitoring in Cambridge 62
9.2 PM10 concentrations in Cambridge 62
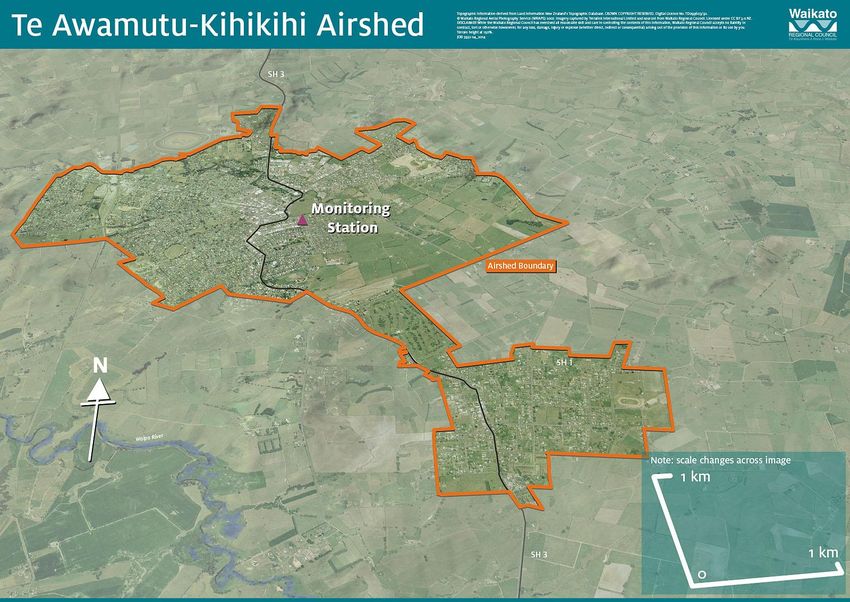
10 Te Awamutu-Kihikihi 65
10.1 Air quality monitoring in Te Awamutu-Kihikihi 65
10.2 PM10 concentrations in Te Awamutu-Kihikihi 65
11 Summary 68
References 70
Appendices 71
Page ii Doc # 3267844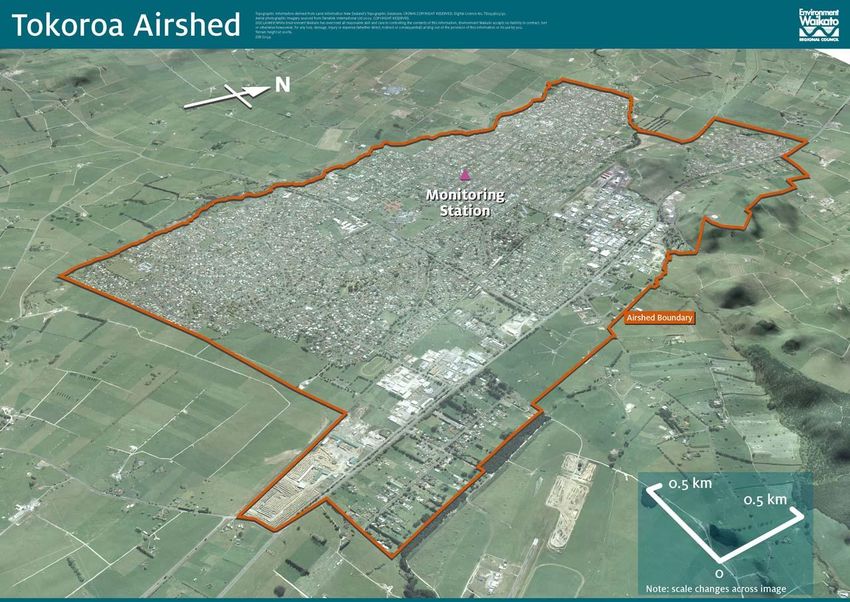
List of figures
Figure 1-1: Map of Waikato Region indicating the 20 urban centres that have been
gazetted as airsheds. 2
Figure 3-1: Hamilton Airshed and air quality monitoring station sites. 9
Figure 3-2: 24-hour average PM10 concentrations measured at Claudelands during 2014. 10
Figure 3-3: 24-hour average PM2.5 concentrations measured at Claudelands during 2014. 10
Figure 3-4: 24-hour average PM10 concentrations measured at Ohaupo Road during
2014. 11
Figure 3-5:Comparison of PM10 concentrations measured at Peachgrove Road/
Claudelands site in Hamilton from 2000 to 2014 to air quality indicator
categories. 11
Figure 3-6: Comparison of daily PM10 concentrations measured at Claudelands each
month during 2014 to air quality indicator categories. 12
Figure 3-7: Comparison of PM10 concentrations measured at Ohaupo Road in Hamilton
from 2012 to 2014 to air quality indicator categories. 12
Figure 3-8: Comparison of daily PM10 concentrations measured at Ohaupo Road in
Hamilton each month during 2014 to air quality indicator categories. 13
Figure 3-9: Comparison of monthly PM10 concentrations measured at Claudelands and
Ohaupo Road in Hamilton in 2014. 13
Figure 3-10: Number of days when 50 µg/m3 was exceeded at Peachgrove Road/
Claudelands compared with the maximum concentration and the 2nd highest
concentration measured from 2006 to 2014. 14
Figure 3-11:Annual average benzene measured at Hamilton sites (2004 to 2014). 17
Figure 3-12:Eight hourly average CO concentrations measured during March 2014 to
June 2014. 18
Figure 3-13:Hourly average NO2 concentrations measured during June 2014 to
September 2014. 19
Figure 3-14:Summary wind speed data from 1998 to 2014 at the Peachgrove Road site. 21
Figure 3-15:Summary temperature data from 1998 to 2014 at the Peachgrove Road site. 21
Figure 3-16:Number of days from May to August when the 24-hr average wind speed was
less than 0.74 m/s and number of PM10 exceedances per year. 22
Figure 3-17:Daily variation in PM10 and PM2.5 concentrations, wind speed, wind direction
and temperature on 10 August 2014 when the daily average PM2.5
concentration exceeded 25 µg/m3. 23
Figure 4-1: Tokoroa Airshed and air quality monitoring site. 25
Figure 4-2: Daily winter PM10 concentrations measured in Tokoroa during 2014. 26
Figure 4-3: Comparison of PM10 concentrations measured in Tokoroa from 2006 to 2014
to air quality indicator categories. 27
Figure 4-4: Comparison of daily PM10 concentrations each month during 2014 to air
quality indicator categories. 27
Figure 4-5: Number of days when 50 µgm3 was exceeded compared with the maximum
concentration and the 2nd highest concentration measured from 2006 to 2014. 28
Figure 4-6: Summary wind speed and temperature data from 2006 to 2014 in Tokoroa. 30
Figure 4-7: Hourly average PM10, wind speed, wind direction and temperature on days
when PM10 concentrations exceeded the NES in Tokoroa. 31
Figure 4-8: Year-to-year variation of the proportion of high pollution potential days which
resulted in exceedances. 33
Figure 4-9: Year-to-year variation of the absolute number of high pollution potential days
compared with the total number of exceedance days. 33
Figure 4-10:Average, 75th percentile, 90th percentile and median PM10 concentrations for
the days when the impacts of meteorological variability have been minimised. 34
Figure 4-11: Comparison of the five year exceedance averages for the period 2006 to
2014. 37
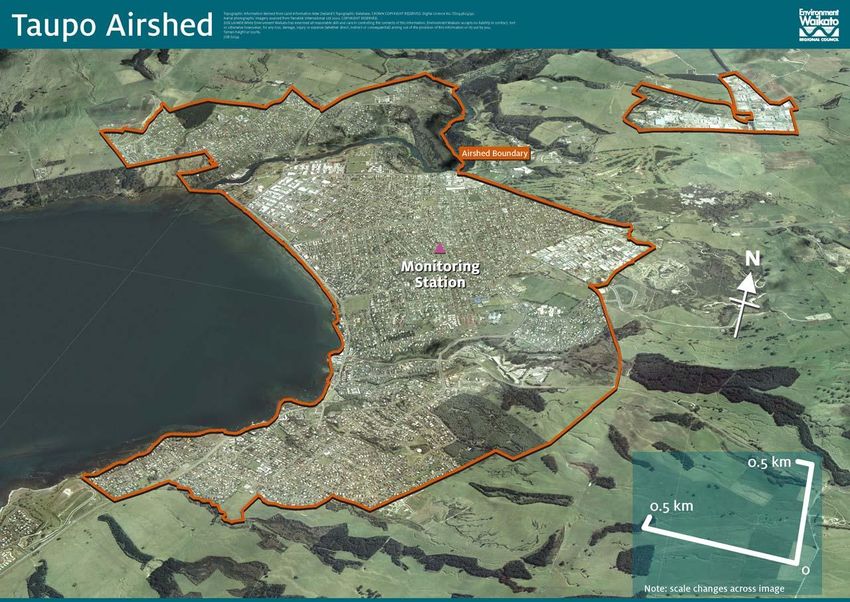
Figure 5-1: Taupo Airshed and air quality monitoring site. 37
Figure 5-2: Daily winter PM10 concentrations measured at Taupo during 2014. 37
Figure 5-3: Comparison of PM10 concentrations measured at the Taupo site from 2006 to
2014 to air quality indicator categories. 38
Figure 5-4: Comparison of daily PM10 concentrations each month during 2014 to air
quality indicator categories. 38
Figure 5-5: Number of days when 50 µg/m3 was exceeded compared with the maximum
concentration and the 2nd highest concentration measured from 2006 to 2014. 39
Figure 5-6: Comparison of annual averages measured at the Taupo site from 2006 to
2014. 39
Doc # 3267844 Page iii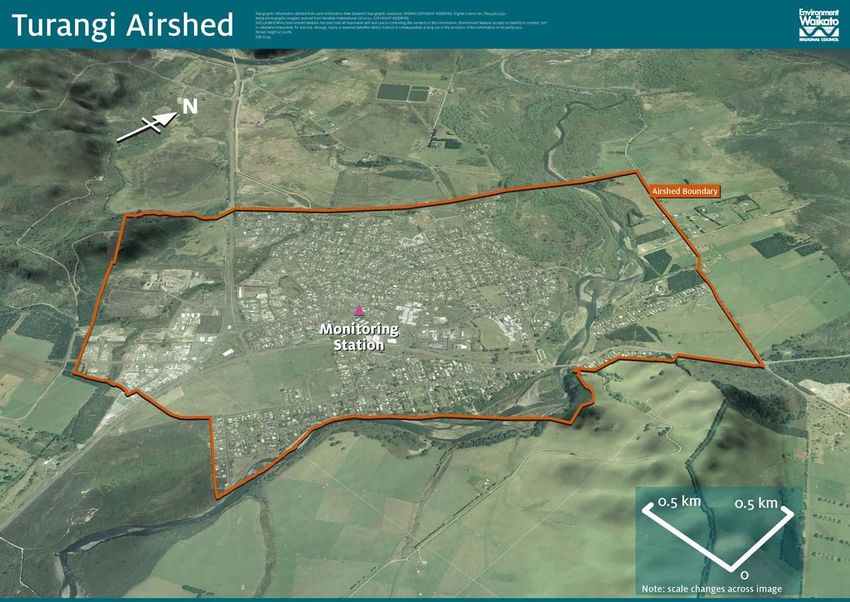
Figure 5-7: Hourly average PM10, wind speed, wind direction and temperature on the 23
of June when the highest 24-hour averagePM10 concentration of 45 µg/m3 was
recorded at Taupo. 41
Figure 5-8: Year-to-year variation of the proportion of high potential pollution days which
resulted in exceedances. 42
Figure 5-9: Year-to-year variation of the absolute number of high pollution potential days
compared with the total number of exceedance days. 43
Figure 5-10:Average, 75th percentile, 90th percentile and median PM10 concentrations for
the days when the impacts of meteorological variability have been minimised. 43
Figure 5-11:Comparison of the five year exceedance averages for the period 2006 to
2014. 43
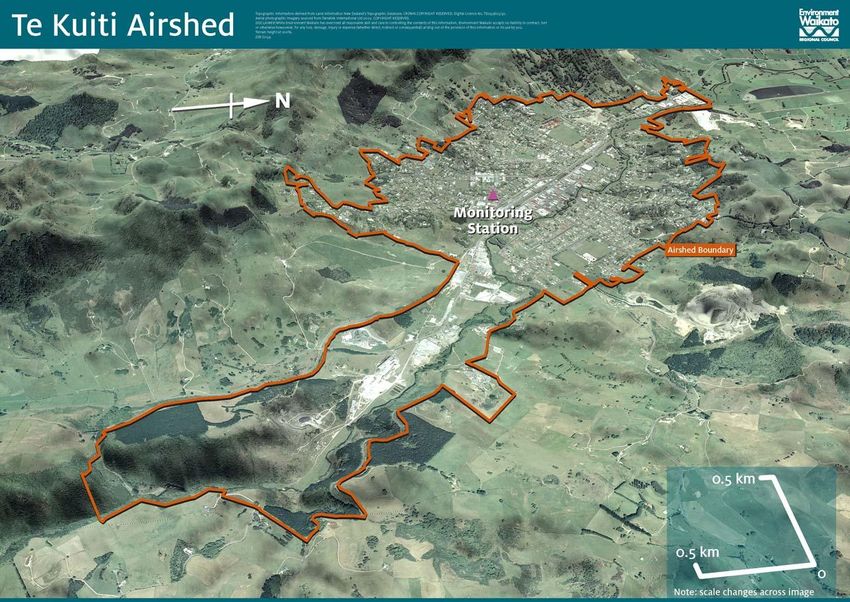
Figure 6-1: Te Kuiti Airshed and air quality monitoring site. 45
Figure 6-2: Daily winter PM10 concentrations measured at the Te Kuiti site during 2014. 45
Figure 6-3: Comparison of PM10 concentrations measured at the Te Kuiti site from 2003 to
2013 to air quality indicator categories. 46
Figure 6-4: Comparison of daily PM10 concentrations each month during 2014 to air
quality indicator categories. 46
Figure 6-5: Number of days when 50 µg/m3 was exceeded compared with the maximum
concentration and the 2nd Highest concentration measured from 2003 to 2014. 47
Figure 6-6: Hourly average PM10, wind speed, wind direction, and temperature on 25 July
when the highest 24-hour average PM10 concentration of 48 µg/m3 was
recorded at Te Kuiti. 49
Figure 6-7: Comparison of the five year exceedance averages for the period 2006 to
2014. 50
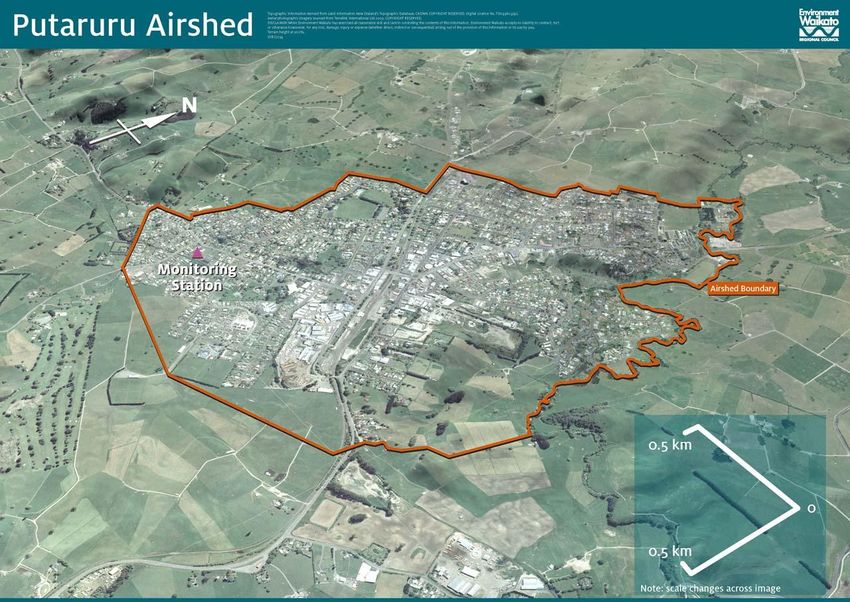
Figure 7-1: Putaruru Airshed and air quality monitoring site. 51
Figure 7-2: Putaruru air quality monitor. 52
Figure 7-3: Daily winter PM10 concentrations measured at the Putaruru site during 2014. 52
Figure 7-4: Comparison of PM10 concentrations measured at the Putaruru site from 2006
to 2014 to air quality indicator categories. 53
Figure 7-5: Comparison of daily PM10 concentrations for 2014 to air quality indicator
categories. 53
Figure 7-6: Number of days when 50 µg/m3 was exceeded compared with the maximum
concentration and the 2nd highest concentration measured from 2007 to 2014. 54
Figure 7-7: Comparison of the monthly averages (April to September) for the period 2007
to 2014. 54
Figure 7-8: Comparison of the annual averages for the period 2007 to 2014. 54
Figure 7-9: Comparison of the five year exceedance averages for the period 2006 to
2014. 54
Figure 8-1: Turangi Airshed and air quality monitoring site. 58
Figure 8-2: Daily average PM10 concentrations measured at the Turangi site for 2014. 59
Figure 8-3:Comparison of PM10 concentrations measured at the Turangi site from 2009 to
2014 to air quality indicator categories. 59
Figure 8-4: Comparison of daily PM10 concentrations each month for 2014 to air quality
indicator categories. 60
Figure 8-5: Number of days when 50 µg/m3 was exceeded compared with the maximum
concentration and the 2nd highest concentration measured from 2009 to 2014. 60
Figure 9-1: Cambridge Airshed and air quality monitoring site. 62
Figure 9-2: Daily winter PM10 concentrations measured at Cambridge during 2014. 63
Figure 9-3: Comparison of PM10 concentrations measured at the Cambridge site from
2013 to 2014 to air quality indicator categories. 63
Figure 9-4: Comparison of daily PM10 concentrations each month during 2014 to air
quality indicator categories. 63
Figure 10-1:Te Awamutu-Kihikihi Airshed and air quality monitoring site. 65
Figure 10-2:Daily winter PM10 concentrations measured at Te Awamutu during 2014. 66
Figure 10-3: Comparison of PM10 concentrations measured at the Te Awamutu site from
2013 to 2014 to air quality indicator categories. 66
Figure 10-4:Comparison of daily PM10 concentrations each month during 2014 to air
quality indicator categories. 66
Figure 11-1:Comparison of changes in annual exceedance averages (per 5 year period)
for Hamilton, Tokoroa, Taupo, Te Kuiti and Putaruru. 66
Page iv Doc # 3267844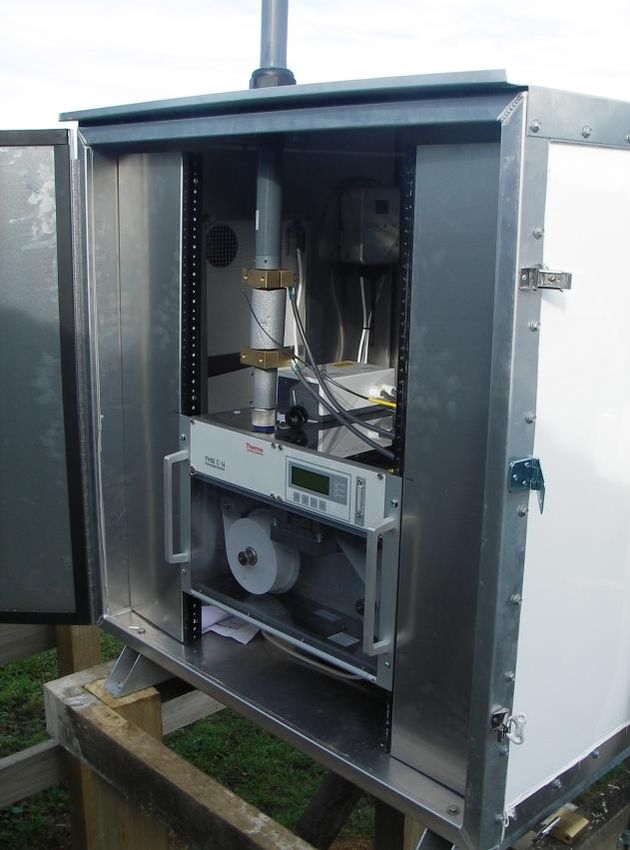
List of tables
Table 1-1  National Environmental Standards for Air Quality (MfE, 2004).                     3
Table 1-2  Ambient air quality guidelines for New Zealand (MfE 2002).                        3
Table 1-3  Environmental Performance Indicator categories for air quality (MfE, 2002).       4
Table 1-4  World Health Organisation guidelines for PM2.5 (2005).                            4
Table 3-1  Exceedances of the WHO guideline for 24-hour average PM2.5 compared with
           PM10 concentrations.                                                             10
Table 3-2: Summary of PM10 concentrations measured at Ohaupo Road in Hamilton for
           2012 to 2014.                                                                    15
Table 3-3: Summary of PM10 concentrations measured at Peachgrove Road/
           Claudelands in Hamilton from 2000 to 2014.                                       16
Table 3-4: Annual average concentrations of volatile organic compounds (VOCs) at
           Hamilton sites between 18 December 2013 to 18 December 2014.                     18
Table 3-5: Summary of 8-hour average CO concentrations measured during March 2014
           to June 2014.                                                                    19
Table 3-6: Summary of 1-hour average NO2 concentrations measured during 2014.               20
Table 4-1: Dates and concentrations for exceedences of 50 µg/m3 in Tokoroa during
           2014.                                                                            26
Table 4-2: Summary of PM10 concentrations measured at the Tokoroa monitoring site
           from 2001 to 2014.                                                               29
Table 5-1: Summary of PM10 concentrations measured at the Taupo monitoring site from
           2001 to 2014.                                                                    40
Table 6-1: Summary of PM10 concentrations measured at the Te Kuiti monitoring site
           from 2003 to 2014.                                                               48
Table 7-1: Summary of PM10 concentrations measured at the Putaruru monitoring site
           from 2006 to 2013.                                                               55
Table 8-1: Summary of PM10 concentrations measured at the Turangi monitoring site
           from 2009 to 2014.                                                               61
Table 9-1: Summary of PM10 concentrations measured at the Cambridge monitoring site
           during 2013 and 2014.                                                            64
Table 10-1:    Summary of PM10 concentrations measured at the Te Awamutu monitoring
           site during 2013 and 2014.                                                       67
Table 11-1:    Summary of PM10 monitoring results for 2014.                                 68
Table 11-2:    Five year exceedance average and trend analysis for the five worst
           airsheds.                                                                        68

Doc # 3267844                                                                            Page v
Executive summary
Air quality monitoring in the Waikato Region focuses primarily on concentrations of PM10,
the main air contaminant of concern. The National Environmental Standards for Air
Quality (NESAQ) has set a maximum concentration limit for PM10 of 50 µg/m3 when
averaged over 24 hours (referred to as an ambient air quality standard). The NESAQ
allows for one exceedance of this standard per rolling 12 month period. More than one
exceedance within a rolling 12-month period is a breach of the standard. The NESAQ
requires air quality monitoring to take place in areas that are likely to exceed the
standard for PM10.
The 2011 amendment to the NESAQ has introduced extended timeframes for Airsheds 1
to comply with the standard for PM10. Airsheds are split in to three categories depending
on the average number of exceedances the airshed has for the previous five year
period.
1. The first category includes airsheds with 10 or more exceedances a year. These
airsheds must achieve no more than three exceedances by 1 September 2016
and no more than one exceedance by 1 September 2020. The Waikato Region
has one such airshed that falls within this category, namely Tokoroa.
2. The second category includes airsheds with more than one exceedance but less
than 10 exceedances. This category of airshed must achieve no more than one
exceedance by 1 September 2016. Based on the air quality monitoring data
collected up to the end of 2014, the Waikato Region has three airsheds that fall
within this category, namely Taupo, Te Kuiti and Putaruru.
3. The third category includes all other airsheds which are currently complying and
must continue to achieve no more than one exceedance of the standard.
During 2014, concentrations of PM10 were measured by Waikato Regional Council in
eight out of the region’s 20 gazetted airsheds with two stations located in the Hamilton
airshed and one each in the Tokoroa, Taupo, Te Kuiti, Putaruru, Turangi, Cambridge
and Te Awamutu-Kihikihi airsheds. Carbon monoxide (CO), nitrogen dioxide (NO2),
benzene, toluene, ethylbenzene and xylenes and PM2.5 were also measured by Waikato
Regional Council in Hamilton during 2014.
This report compares contaminant concentrations measured in these airsheds to the
NESAQ standards and to the Ministry for the Environment’s air quality guidelines and
indicator categories.
There were two airsheds which breached the NESAQ PM10 standard over the winter of
2014.
1. Tokoroa – Nine exceedances were recorded in Tokoroa (the lowest number
since 2003) with a maximum concentration of 69 μg/m3 recorded.
2. Putaruru – Two exceedances were also recorded in Putaruru with a maximum
concentration of 73 μg/m3 recorded, resulting in a five-year extension of the
airshed’s polluted (secondary category) status.
Te Kuiti and Taupo continue to indicate a significant improvement with no exceedances
recorded this year. A statistical analysis of seasonal PM10 data collected in Hamilton, Te
Kuiti and Taupo indicates that concentrations have decreased over the previous six or
more year period. No statistically significant change has been identified for Tokoroa and
the previous decreasing trend identified for Putaruru is no longer significant based on
inclusion of the 2014 data.
1
An airshed is an air quality management area that has been defined by a regional council or unitary authority as an area
that potentially could or is known to breach the standards for air quality. These airshed designations must be gazetted
by the Ministry for the Environment.
Page vi Doc # 3267844In Hamilton, PM2.5 concentrations exceeded the World Health Organisation (WHO) guideline of 25 µg/m3 (24-hour average) on five days during 2014 and coincided with the five days when PM10 was most elevated. Concentrations of CO in Hamilton were well below the NESAQ standard of 10 mg/m3 (8- hour average) during 2014. While concentrations of NO2 in Hamilton were below the NESAQ standard of 200 µg/m3, concentrations reached just under 50% of the standard during 2014. Concentrations of benzene in Hamilton were within the national guideline of 3.6 µg/m3 and an improving or “levelling” trend is evident for annual average concentrations at all sites. The highest annual concentration was measured at the Greenwood Street monitoring site and was 2.5 µg/m3. Concentrations of toluene, ethylbenzene and xylene were also well within acceptable international criteria. Doc # 3267844 Page vii
1   Introduction
    The National Environmental Standards for Air Quality (NESAQ) has mandated ambient
    air quality standards (maximum concentration limits) for five contaminants along with
    averaging periods and number of allowable exceedances (refer to Table 1.1). A breach
    of the standards occurs when more than the allowable number of exceedances occurs
    within the specified period.

    The concept of an “airshed” is defined by the NESAQ regulations as an “air quality
    management area” that has been identified by Regional Councils and Unitary Authorities
    and made public. The Waikato Region has 20 such “airsheds” which typically have
    boundaries that approximate the town boundaries of urban centres (refer to Figure 1.1).

    In the Waikato Region the main air contaminant of concern is PM10 (particles in the air
    less than 10 microns in diameter). PM10 is generated from burning fuels such as wood,
    coal or oil from domestic fires, vehicles and industry, as well as natural sources such as
    sea salt, dust, pollens and volcanic activity.

    A standard for PM10 has been set at 50 micrograms per cubic metre of air (50 µg/m3)
    when averaged over 24-hours. The standard allows for one exceedence per 12 month
    period. More than one exceedance over this period triggers a breach of the standard.
    Concentrations of PM10 have historically exceeded the ambient air quality standard in
    Hamilton, Tokoroa, Taupo, Te Kuiti and Putaruru during winter months. The main source
    of PM10 concentrations in these areas during the winter months is solid fuel burning for
    domestic home heating.

    Under the NESAQ an airshed is classified as a polluted airshed if it has average PM10
    exceedances of more than one per 12 month period, for the immediately prior five year
    period. To get re-classified as non-polluted, a polluted airshed needs to have no more
    than 1 exceedance per 12 months for a period of five years.

    The NESAQ requires a ban on the use of any new open fireplaces installed inside
    domestic dwellings 12 months after an airshed first becomes classified as polluted.
    Restrictions are also imposed on air discharges from industry that have significant PM 10
    emissions which contribute to a polluted airshed.

    In 2014, PM10 concentrations were measured in Hamilton, Tokoroa, Taupo, Te Kuiti,
    Putaruru, Turangi, Cambridge and Te Awamutu-Kihikihi. In Hamilton additional
    monitoring was carried out for PM2.5 (particles in the air less than 2.5 microns in
    diameter), carbon monoxide, oxides of nitrogen as well as benzene, ethyl benzene,
    toluene and xylenes. Prior to April 2013, monitoring of PM10 has also taken place in
    Matamata, Ngaruawahia and Waihi2. Monitoring of PM10, sulphur dioxide and oxides of
    nitrogen were also monitored at two locations within Huntly airshed in 2014 by Genesis
    Energy. Both monitoring sites are owned and operated by Genesis Energy Ltd as part of
    the Huntly Power Station resource consent monitoring requirements.

    The required target date for compliance with the NESAQ for PM10 was reviewed in 2011
    and revised from 2013 to 2016 for most airsheds in New Zealand. Airsheds with more
    than one exceedance but less than 10 exceedances of the 50 µg/m3 standard have to
    achieve no more than one exceedance by 1 September 2016. Airsheds that have 10 or
    more exceedances of 50 µg/m3 have an interim target of no more than three
    exceedances by 1 September 2016 and a final target of no more than one exceedance

    2
        The Waihi air quality monitoring site was disestablished at the beginning of 2012 and the Matamata and Ngaruawahia
        monitoring stations were disestablished in April 2013. Previous monitoring of PM10 in these three airsheds over a period
                                                                                                                         3
        of four or more years indicates that PM10 concentrations are well below the NESAQ 24-hour standard of 50 µg/m (apart
        from Australian dust storm related exceedances in 2009). This disestablishment of monitoring sites where three or more
        years of monitoring has indicated no exceedances of the NESAQ is part of an ongoing monitoring strategy to re-deploy
        monitoring equipment in airsheds where air quality has not yet been monitored.

    Doc # 3267844                                                                                                    Page 1
by 1 September 2020. Based on monitoring data collected up to 2014, Tokoroa has to
meet the interim 2016 target of no more than three exceedances and the 2020 target of
no more than one exceedance. Taupo, Te Kuiti and Putaruru must achieve no more than
one exceedance by 2016. All other airsheds within the Waikato region must always meet
the standard of no more than one exceedance per rolling 12 month period i.e. the
requirement for compliance is current.
Based on previous monitoring, most other contaminants are unlikely to be in breach of
their respective NESAQ standards or ambient air quality guidelines in urban areas of the
Waikato. Generally, the majority of resources for air quality monitoring in the Waikato
Region has focused on PM10. However, there is evidence that nitrogen dioxide can be
reasonably elevated in urban areas of Hamilton where there is a high density of traffic.
Tuakau
Ngaruawahia
Figure 1-1: Map of Waikato Region indicating the 20 urban centres that have been
gazetted as airsheds.
Page 2 Doc # 3267844Table 1-1 National Environmental Standards for Air Quality (MfE, 2004).
NESAQ values
Allowable
Contaminant Concentrationa Averaging period exceedances per
year
Carbon monoxide 10 mg m-3 8-hour 1
-3
Particles (PM10) 50 µg m 24-hour 1
-3
Nitrogen dioxide 200 µg m 1-hour 9
Sulphur dioxideb 350 µg m-3 1-hour 9
b -3
Sulphur dioxide 570 µg m 1-hour 0
-3
Ozone 150 µg m 1-hour 0
The Ministry for the Environment provides guidelines for ambient air quality (refer to
Table 1.2) and air quality indicator categories to assist in the presentation and
management of air quality in New Zealand (refer to Table 1.3). Air quality monitoring
data in this report are presented relative to air quality guidelines and these indicator
categories. These categories provide a useful perspective on the overall quality of the air
and provide an indicative tool for evaluating trends in concentrations over time.
Table 1-2 Ambient air quality guidelines for New Zealand (MfE 2002).
2002 guideline values
Contaminant
Concentrationa Averaging Period
Carbon monoxide 30 mg m-3 1-hour
10 mg m-3 8-hour
Particles (PM10) 50 µg m-3 24-hour
20 µg m-3 Annual
Nitrogen dioxide 200 µg m-3 1-hour
100 µg m-3 24-hour
Sulphur dioxide b 350 µg m-3 1-hour
120 µg m-3 24-hour
Ozone 150 µg m-3 1-hour
100 µg m-3 8-hour
Hydrogen sulphide c 7 µg m-3 1-hour
Lead d 0.2 µg m-3 (lead content of PM10) 3-month moving (calc. monthly)
Benzene (year 2002) 10 µg m-3 Annual
Benzene (year 2010) 3.6 µg m-3 Annual
1,3-Butadiene 2.4 µg m-3 Annual
Formaldehyde 100 µg m-3 30-minutes
Acetaldehyde 30 µg m-3 Annual
Benzo(a)pyrene 0.0003 µg m-3 Annual
Mercury (inorganic) d 0.33 µg m-3 Annual
Mercury (organic) 0.13 µg m-3 Annual
Chromium VI d 0.0011 µg m-3 Annual
Chromium metal & 0.11 µg m-3 Annual
chromium III
Arsenic (inorganic) d 0.0055 µg m-3 Annual
Arsine 0.055 µg m-3 Annual
Notes for Tables 1.1 and 1.2:
a
All values apply to the gas measured at standard conditions of temperature (0° C) and pressure (1
atmosphere).
b
The sulphur dioxide guideline values do not apply to sulphur acid mist.
c
The hydrogen sulphide value is based on odour nuisance and may be unsuitable for use in geothermal
areas.
d
The guideline values for metals are for inhalation exposure only; they do not include exposure from other
routes such as ingestion. These other routes should be considered in assessments where appropriate.
Doc # 3267844 Page 3Table 1-3 Environmental Performance Indicator categories for air quality (MfE, 2002).
Category Value relative to guideline Comment
Of little concern: if maximum values are less than a
Less than 10% of the
Excellent tenth of the guideline, average values are likely to be
guideline
much less
Between 10% and 33% of Peak measurements in this range are unlikely to
Good
the guideline affect air quality
A broad category, where maximum values might be
Between 33% and 66% of of concern in some sensitive locations but generally
Acceptable
the guideline they are at a level which does not warrant urgent
action
Between 66% and 100% of This is a warning level, which can lead to
Alert
the guideline exceedances if trends are not curbed
Exceedances of the guideline are a cause for
More than 100% of the
Action concern and warrant action, particularly if they occur
guideline
on a regular basis
Although the MfE categories are primarily used as air quality indicators, the Waikato
Regional Plan takes a further regulatory step by specifying designated policy responses
that should correspond to each zone. Policy 3 of the Air Module of the Waikato Regional
Plan contains regional ambient air quality categories and the designated response that
the Council will take when developing air quality management framework. Policy 3 states
that air quality in the “Excellent” category is to be protected, while “Good” air quality is to
be maintained or protected. “Acceptable” air quality is to be maintained. Air quality in the
“Alert” category is to be maintained or enhanced. For air quality in the “Action” category,
the only designated policy response is to aim to enhance (improve) the situation.
There are no national guidelines or standards for PM2.5 (particles in the air less than 2.5
microns in diameter). The World Health Organisation guidelines are therefore the most
relevant for application in New Zealand (refer to Table 1.4).
Table 1-4 World Health Organisation guidelines for PM2.5 (2005).
Concentration Averaging Period
25 µg m-3 24-hour
10 µg m-3 Annual
1.1 Reporting period
The reporting period for PM10 was from 1 January to 31 December 2014 (a calendar
year). In 2006 Waikato Regional Council introduced a September to August reporting
period. This reporting period was introduced for a number of reasons including ensuring
that results were reported as soon as possible after the peak winter PM10 concentrations.
However, the 2011, 2012, 2013 and 2014 annual air quality reports have been prepared
based on a reporting period of January to December. This is the same format as
historical reports and is consistent with other regional council reporting around the
country.
The reporting period for carbon monoxide was 6 March 2014 to 10 June 2014 and the
reporting period for oxides of nitrogen was 10 June 2014 to 10 September 2014 (two
consecutive three month surveys).
The reporting period for benzene, toluene, ethylbenzene and xylenes (BTEX) was 18
December 2014 to 18 December 2014. Aligning the reporting period for BTEX with the
Page 4 Doc # 3267844calendar year is not feasible as it would require staff to deploy passive sampling equipment on 1 January. This 10 day misalignment with the calendar year is of little concern when reporting annual averages and it is not expected that there would be any difference in the annual averages if the passive samplers were instead deployed on 1 January each year. Doc # 3267844 Page 5
2   Methodology
    Measured concentrations of PM10 can be influenced by the method used to monitor
    PM10. From 2006 a number of air quality monitoring sites in the Waikato region have
    had gravimetric samplers run in conjunction with existing Beta Attenuation Monitors
    (BAMs). Waikato Regional Council staff have used the results to determine site specific
    differences between methods and data and have adjusted accordingly, where
    appropriate, for gravimetric equivalence. Prior to 2007, data were not adjusted. Some
    adjustment equations were updated in 2010 as a result of additional monitoring and
    these equations have been used in the 2011, 2012, 2013 and 2014 reports.

    Prior to 2014, PM10 concentrations were monitored at the now decommissioned
    Peachgrove Road air quality monitoring site in Hamilton, using a Tapered Elemental
    Oscillation Microbalance (TEOM) with a sample temperature setting of 40 degrees
    centigrade. Concentrations of PM10 measured using the TEOM were adjusted based
    on equation 2.1.

         Corrected PM10 = 1.19975 x RawTEOM - 3.9182                    Equation 2.1

    In Tokoroa, a ThermoAndersen FH62 C14 BAM has been used to monitor air quality
    since 2005. A Sequential Partisol gravimetric sampler was co-located at this site.
    Equation 2.2 shows the adjustments made to the FH62 data for consistency with the
    gravimetric method.

         Corrected PM10 = 10 (1.09945logBAM - 0.08595)                  Equation 2.2

    Gravimetric sampling was conducted at the Gillies Street site in Taupo from March
    2007. Concentrations of PM10 measured using the FH62 C14 BAM during 2011 were
    adjusted based on equation 2.3.

         Corrected PM10 = 1.255BAM – 1.538                              Equation 2.3

    Air quality data at the Putaruru site have been adjusted based on Equation 2.4. This
    equation was updated in 2010.

         Corrected PM10 = 1.106BAM - 2.38                               Equation 2.4

    Concentrations of PM10 at Hamilton (Ohaupo Road and Claudelands Event Centre), Te
    Kuiti, Matamata, Ngaruawahia and Turangi sites were measured using an FH62 C14
    BAM. No adjustments have been made to concentrations measured at these sites. In
    the case of Te Kuiti and Matamata, reference method sampling has confirmed that no
    adjustment of BAM data is necessary. For the other sites, the possible need for any
    site-specific correction remains to be assessed.

    At the Hamilton (Claudelands Event Centre), Tokoroa, Taupo and Te Kuiti air quality
    monitoring sites, meteorological data, including temperature, wind speed and wind
    direction were collected. Relative humidity was also collected at Hamilton (Claudelands
    Event Centre) and Taupo. Meteorological data were not available for the Putaruru,
    Turangi, Cambridge and Te Awamutu sites. At sites where it was available,
    meteorological data were compared with PM10 on days when pollution was elevated.

    Waikato Regional Council staff has managed most sites in the Waikato air quality
    monitoring network since August 2005. Prior to that the monitoring network was
    operated and maintained by NIWA. The Partisol Model 2000 PM10 sampler at the
    Taupo site was operated by the Institute of Geological and Nuclear Sciences Ltd (GNS)
    on behalf of Waikato Regional Council.

    Page 6                                                                    Doc # 3267844
Hourly data from the BAM monitors are recorded and logged by an iQuest iRIS 320 datalogger. Results are telemetered hourly to Waikato Regional Council and stored in the hydrotel database. Doc # 3267844 Page 7
3 Hamilton
3.1 Air quality monitoring in Hamilton
In Hamilton air quality has been measured, prior to 2014, at a monitoring site in
Peachgrove Road located on the south-east side of Hamilton City since November
1997. The site met the requirements of the “Residential Peak” site classification as
described in the ‘Good Practice Guideline for Air Quality Monitoring and Data
Management 2009’ report (MfE, 2009). During 2014,
The monitoring station at Peachgrove Road was decommissioned on 18 October 2013
because the property, previously owned by Mighty River Power, changed ownership in
December 2013 and Waikato Regional Council was required to remove the station as
part of the sale agreement. A replacement station has been installed, as of April 2014,
in the grounds of Claudelands Events Centre on Heaphy Terrace. This new station is
currently operating as the main “residential” monitoring site for Hamilton. During 2014,
daily and hourly average PM10 and PM2.5 concentrations were measured at the
Claudelands site using two separate FH 62 BAMs.
From March 2012, air quality has also been measured at a second monitoring site
located adjacent to the NZ Blood Service at the Waikato Hospital on the corner of
Ohaupo Road and Lorne Street. This site is traffic and industry focussed. During 2014,
daily and hourly average PM10 concentrations were measured at the site using a FH 62
BAM.
From 6 March 2014 to 10 June 2014 carbon monoxide was monitored and from 10
June 2014 to 10 September 2014 oxides of nitrogen were monitored at Ohaupo Road
using an Ecotech ML/EC 9830 CO analyser (gas phase infrared) and a Ecotech ML/EC
9841 NOx analyser (gas phase chemiluminescence) respectively. Operational aspects
of the carbon monoxide and oxides of nitrogen monitoring including maintenance,
calibration and quality assurance were carried out by Watercare Ltd for Waikato
Regional Council.
Benzene, ethyl-benzene, toluene and xylenes (BTEX) have also been monitored at
various locations of high traffic around Hamilton. These include Bridge Street,
Claudelands Road, Peachgrove Road Intermediate School, Greenwood Street and
Tristram Street.
Passive sampling for the volatile organic compounds (VOCs) benzene, ethyl-benzene,
toluene and xylenes was carried out using 3M Passive Diffusion Monitors. The method
used is as described in Stevenson and Narsey (1999) with filters being deployed for
periods of three months. The analysis was carried out by Hill Laboratories in Hamilton.
While this type of passive sampling is recommended as a screening method only, it is
the most common approach to benzene monitoring in New Zealand and is significantly
more cost effective than the method recommended by the Ministry for the
Environment's ambient air quality guidelines (MfE 2002).
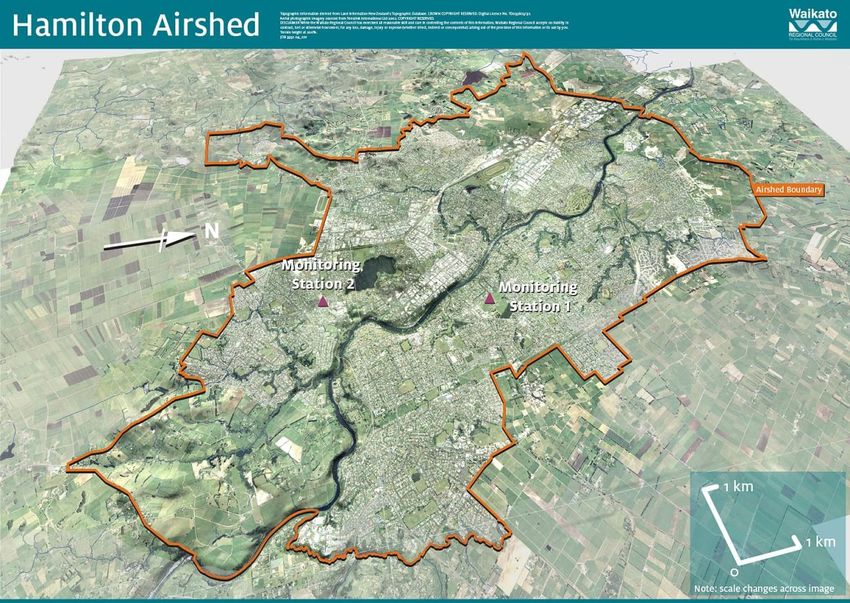
Figure 3.1 shows the main Claudelands air quality monitoring station site (Monitoring
Station 1 on the eastern side of the Waikato River) and the Ohaupo Road monitoring
station site (Monitoring Station 2 on the western side of the Waikato River).
Page 8 Doc # 3267844*
Figure 3-1: Hamilton Airshed and air quality monitoring station sites. Station 1 is
located at Claudelands Events Centre grounds, and Station 2 is located at
Ohaupo Rd (*Station 1 was previously located at Peachgrove Rd).
3.2 PM10 concentrations for Hamilton
There were no PM10 exceedances of 50 µg/m3 (24-hour average) measured in
Hamilton during 2014. A maximum 24 hour average concentration of 46 µg/m3 was
measured on 15 June at the Claudelands site and a maximum 24 hour average
concentration of 32 µg/m3 was measured on 28 May at the Ohaupo Road site. This
compares with eight exceedances3 in 2013 and a maximum of 136 µg/m3 (caused by
works associated with the upgrading of the Peachgrove Road/Te Aroha Street/Ruakura
Road intersection), no exceedances during 2012, one exceedance during 2011, no
exceedances during 2010 and two exceedances with concentrations of 54 µg/m3
measured during 2009. A further exceedance in 2009 (the previous maximum PM10
concentration recorded at Hamilton) with a concentration of 101 µg/m3 coincided with a
dust storm event in Australia.
There were five PM2.5 exceedances of the World Health Organisation (WHO) guideline of
25 µg/m3 (24-hour average) measured during 2014. A maximum 24 hour average PM2.5
concentration of 46 µg/m3 was measured on 15 June at the Claudelands site which is the
same day as the maximum PM10 concentration was recorded. The five PM2.5 exceedances
coincided with the five days when PM10 was most elevated (refer to Table 3.1). On
average over these five days, PM2.5 represented approximately 95% of the PM10
concentration.
3
An application was made to the Minister for the Environment in August 2013 and an exemption for the eight
exceedances was provided by the Minister in November 2013. As a result, the exceedances do not count towards
determining the polluted status of the Hamilton airshed i.e. Hamilton remains a non-polluted airshed and the
industry offset and open fire place ban regulations of the NESAQ are not triggered.
Doc # 3267844 Page 9Table 3-1: Exceedances of the WHO guideline for 24-hour average PM2.5 compared
with PM10 concentrations.
Date PM2.5 concentration PM10 concentration
(g/m3) (g/m3)
17/05/2014 32 34
28/05/2014 36 37
14/06/2014 26 29
15/06/2014 46 46
10/08/2014 26 29
Daily PM10 and PM2.5 concentrations measured at Hamilton during 2014 are shown in
Figures 3.2, 3.3 and 3.4.
70
Air quality standard
60
50
PM10 g/m3
40
30
20
10
0
Figure 3-2: Daily average PM10 concentrations measured at Claudelands during 2014.
70
60
WHO Air quality
50 guideline
PM2.5 g/m3
40
30
20
10
0
Figure 3-3: Daily average PM2.5 concentrations measured at Claudelands during 2014.
Page 10 Doc # 326784470
Air quality standard
60
50
PM10 g/m3
40
30
20
10
0
Figure 3-4: Daily average PM10 concentrations measured at Ohaupo Road during 2014.
Figure 3.5 compares daily PM10 concentrations measured from 2000 to 2014, for
Peachgrove Road/ Claudelands site, to the MfE air quality indicator categories (shown
in Table 1.3). During 2014 the majority of the PM10 concentrations measured were less
than 33% of the air quality guideline and similar to the indicator category mix observed
in 2012.
24-hour PM10 (annual comparisons)
100%
"Action" >Guideline
80%
60% "Alert" 66-100% of
guideline
40% "Acceptable" 33-66% of
guideline
20% "Good" 0-33% of
Guideline
0%
2000
2001
2002
2003
2004
2005
2006
2007
2008
2009
2010
2011
2012
2013
2014
Claudelands site
Figure 3-5: Comparison of PM10 concentrations measured at Peachgrove Road/
Claudelands site in Hamilton from 2000 to 2014 to air quality indicator
categories.
Figure 3.6 shows the seasonal variations in the distribution of PM10 concentrations
during 2014 for Claudelands with an increased proportion of concentrations above 33%
of the air quality category during the winter months.
Doc # 3267844 Page 1124-hour PM10 (monthly comparisons 2014)
100%
80% Action >Guideline
60%
Alert 66-100% of
40% guideline
Acceptable 33-66% of
20%
guideline
0% Good 0-33% of Guideline
September
November
December
February
August
October
March
January
April
June
July
May
Figure 3-6: Comparison of daily PM10 concentrations measured at Claudelands each
month during 2014 to air quality indicator categories.
Figure 3.7 compares daily PM10 concentrations measured from 2012, 2013 and 2014,
for Ohaupo Road, to the MfE air quality indicator categories (shown in Table 1.2).
During 2014 the majority of the PM10 concentrations measured were less than 33% of
the air quality guideline, similar to 2012 and 2013.
24-hour PM10 (annual comparisons)
100%
"Action" >Guideline
80%
"Alert" 66-100% of
60%
guideline
40% "Acceptable" 33-66% of
guideline
20% "Good" 0-33% of
Guideline
0%
2012 2013 2014
Figure 3-7: Comparison of PM10 concentrations measured at Ohaupo Road in Hamilton
from 2012 to 2014 to air quality indicator categories.
Figure 3.8 shows the seasonal variations in the distribution of PM10 concentrations
during 2014 for Ohaupo Road with an increased proportion of concentrations above
33% of the air quality category during the winter months
Page 12 Doc # 326784424-hour PM10 (monthly comparisons 2014)
100%
80% Action >Guideline
60%
Alert 66-100% of
40% guideline
Acceptable 33-66% of
20%
guideline
0% Good 0-33% of Guideline
September
November
December
February
August
October
March
January
April
June
July
May
Figure 3-8: Comparison of daily PM10 concentrations measured at Ohaupo Road in
Hamilton each month during 2014 to air quality indicator categories.
Figure 3.9 shows the variations in the monthly average PM10 concentrations during
2014 for Claudelands and Ohaupo Road which were very similar for both stations.
Claudelands Ohaupo
24
22
20
18
PM10 g/m3
16
14
12
10
8
6
4
2
0
Figure 3-9: Comparison of monthly PM10 concentrations measured at Claudelands and
Ohaupo Road in Hamilton in 2014.
Figure 3.10 shows the number of days when 50 µg/m3 was exceeded, the maximum
concentration and the 2nd highest concentration from 2006 to 2014 for Peachgrove
Road/ Claudelands. The years 2009 and 2013 are considered abnormal due to the
occurrence of exceptional circumstances. An elevated exceedance with a
concentration of 101 µg/m3 occurred in 2009 as result of the Australian dust storm.
Eight exceedances with a maximum concentration of 136 µg/m3 occurred in 2013 as a
result of the works associated with the upgrading of the Peachgrove Road/Te Aroha
Street/Ruakura Road intersection. Since 2010 the general pattern of one or no
exceedances (ignoring 2013) indicates that the NES is likely to continue to be complied
with.
Doc # 3267844 Page 13Exceedances Maximum 2nd Highest
10 140
Number Exceedances
120
8
100
PM10 g/m3
6 80
4 60
40
2
20
0 0
06
07
08
09
10
11
12
13
14
15
20
20
20
20
20
20
20
20
20
20
Figure 3-10: Number of days when 50 µg/m3 was exceeded at Peachgrove Road/
Claudelands compared with the maximum concentration and the 2nd
highest concentration measured from 2006 to 2014.
The annual average PM10 concentration for Ohaupo Road for 2014 was 13.4 µg/m3
which is similar in magnitude to previous years for both Ohaupo Road and Peachgrove
Road. For Claudelands, a winter seasonal average is more appropriate to mitigate the
bias of the missing data prior to late April 2014. The winter average (May to August) for
2014 was 14.1 µg/m3 which is similar to previous years at Ohaupo Rd and Peachgrove
Rd. The Ministry for the Environment specifies an annual average guideline for PM10 of
20 µg/m3 (MfE, 2002). An annual average PM10 concentration is not specified in the
NES.
Summary statistics for PM10 monitoring data from the Ohuapo Road site for 2012 to
2014 and from the Peachgrove Road/ Claudelands site from 2000 to 2014 are shown
in Table 3.2 and 3.3 respectively. Since 2007 concentrations measured at the
Peachgrove Road site were adjusted for differences between the TEOM and
gravimetric sampling methods as detailed in Section 2 of this report.
Page 14 Doc # 3267844Table 3-2: Summary of PM10 concentrations measured at Ohaupo Road in Hamilton for
2012 to 2014.
Indicator 2012 2013 2014
"Good" 0-33% of guideline 74% 77% 74%
"Acceptable" 33-66% of guideline 25% 23% 26%
"Alert" 66-100% of guideline 0.8% 0% 0%
“Action” >Guideline 0% 0% 0%
Percentage of valid data 73% 100% 100%
Annual average (µg/m3) 13.5 13.3 13.4
Measured exceedances 0 0 0
99.7 %ile PM10 concentration (µg/m3) 37 30 31
2nd High PM10 concentration (µg/m3) 35 30 31
Annual maximum (µg/m3) 41 32 32
Number of records 266 365 364
Doc # 3267844 Page 15Table 3-3: Summary of PM10 concentrations measured at Peachgrove Road/ Claudelands in Hamilton from 2000 to 20141.
2001 2002 2003 2004 2005 2006 2007 2008 2009 2010 2011 2012 2013 2014
Monitoring Method TEOM TEOM TEOM TEOM TEOM TEOM TEOM TEOM TEOM TEOM TEOM TEOM TEOM BAM
Peach Peach Peach Peach Peach Peach Peach Peach Peach Peach Peach Peach Peach Claude-
Monitoring Site -grove -grove -grove -grove -grove -grove -grove -grove -grove -grove -grove -grove -grove lands
"Good" 0-33% of
79% 65% 71% 58% 72% 58% 67% 64% 70% 77% 66% 75% 65% 78%
guideline
"Acceptable" 33-66%
18% 34% 25% 37% 26% 37% 31% 34% 26% 23% 32% 23% 31% 21%
of guideline
"Alert" 66-100% of
2% 0.9% 3% 4% 2% 5% 2% 2% 3% 0% 2% 2% 1% 1%
guideline
“Action” >Guideline 1% 0% 0.9% 0.3% 0% 0.6% 0% 0% 0.8% 0% 0.3% 0% 3% 0%
Percentage of valid
70% 93% 90% 94% 77% 100% 100% 100% 100% 99% 100% 100% 80% 69%
data
Annual average
13.5 14.7 14.5 16.4 14.0 16.5 14.7 15.3 14.4 13.1 14.4 13.4 13.73 14.13
(µg/m3)
Measured
3 0 3 1 0 2 0 0 3 0 1 0 8 0
exceedances
99.7 %ile PM10 conc.
64 37 61 48 37 64 44 45 53 30 37 36 128 39
(µg/m3)
2nd Highest PM10 conc.
60 37 60 48 36 65 45 46 52 30 37 37 127 37
(µg/m3)
Annual maximum
76 40 71 62 40 75 46 48 101 30 64 42 136 46
(µg/m3)
Number of records 256 338 328 344 281 363 364 364 363 361 364 364 291 252
1. Data from 2006 to 2013 inclusive is adjusted for gravimetric equivalency. Data from 2014 onwards is collected at the Claudelands site.
2. Note: data for 1998, 1999 and 2000 has been excluded from table due to formatting constraints.
3. Winter average rather than annual average due to limited datasets.
Page 16 Doc # 29431913.3 Concentrations of benzene, toluene and xylenes
In Hamilton, monitoring of benzene at the Peachgrove Road air monitoring site and at a
high-density traffic area at Bridge Street has taken place since 2004. In 2005 an
additional benzene sampling site was established at the intersection of Claudelands
Road and Victoria Street (Claudelands Bridge). This is also a high density traffic area.
Additional sites were established in 2006 in Tristram Street, Greenwood Street and at
Hamilton Intermediate School.
Benzene concentrations measured at all locations in Hamilton during 2014 were within
the Ministry for the Environment's 2010 annual guideline of 3.6 µg/m3 (Table 3.4). The
guideline prior to 2010 was 10 µg/m3 (annual average). The highest annual
concentration for 2014 was measured at the Greenwood Street monitoring site and
was 2.5 µg/m3, a small decrease from the previous maximum of 2.7 µg/m3 measured at
Greenwood Street in 2013 and 2012. (Figure 3.11). An improving or “levelling” trend is
evident for annual average concentrations of benzene at all sites.
Large decreases in benzene concentrations were observed over the period 2004 to
2007. Prior to 2011, benzene concentrations had tapered relative to decreases
observed from 2004 to 2007 (Figure 3.11). These earlier decreases were attributed to
changes in fuel specifications and improved vehicle technology (Smith, 2007).
7.00 2010 guideline
2004
Annual average benzene (g/m3)
6.00 2005
2006
5.00
2007
4.00 2008
2009
3.00
2010
2.00 2011
2012
1.00
2013
0.00 2014
Figure 3-11: Annual average benzene measured at Hamilton sites (2004 to 2014).
Ethyl-benzene, toluene and xylene were also measured at the benzene monitoring
sites for each year. An MfE document discussing amendments to the 1994 ambient air
quality guidelines suggests an annual threshold of 190 μg/m3 and 950 μg/m3 for
toluene and total xylenes respectively (MfE, 2000). The United States EPA Reference
Concentration for ethyl-benzene is 1000 μg/m3 as an annual average. Concentrations
of toluene, total xylenes and ethyl-benzene measured in Hamilton at all sites were
significantly lower than the suggested MfE thresholds and USEPA Reference
Concentration.
Doc # 3267844 Page 17Table 3-4: Annual average concentrations of volatile organic compounds (VOCs) at
Hamilton sites between 18 December 2013 to 18 December 2014.
Peachgrove Claudelands Peachgrove Greenwood Tristram
Bridge St Guidelinea
VOC Rd Rd Intermediate St St
µg/m3 µg/m3 µg/m3 µg/m3 µg/m3 µg/m3 µg/m3
Benzene 1.5 0.9 1.3 0.7 2.5 1.1 3.6 (10a)
Ethyl- b
1.3 0.8 1.1 0.7 1.7 0.9 1000
benzene
Toluene 8.3 5.9 7.3 3.8 15.1 6.1 190b
Total
5.6 3.4 4.8 2.6 7.1 4.1 950b
Xylenes
a 3 3
The historical guideline for benzene of 10 µg/m reduced to 3.6 µg/m in 2010.
b
There are currently no guideline values for ethyl-benzene, toluene and xylenes. Threshold values for
toluene and total xylenes used here are from proposed amendments to the 1994 ambient air quality
guidelines. For ethyl-benzene, the US EPA Reference Concentration has been used.
3.4 Concentrations of carbon monoxide
During 6 March 2014 to 10 June 2014, eight hourly average concentrations of carbon
monoxide (CO) as measured at the Ohaupo Road monitoring station were well below
the NESAQ standard for CO. The NESAQ standard for CO is 10 mg/m3 with one
allowable exceedance per year (Refer to Figure 3.12). The eight-hour average
concentrations of CO were less than 33% of the NES and national and regional
ambient air quality guidelines and therefore fall within the good air quality indicator
category (Refer to Table 3.5).
12
Air quality standard
10
8
CO mg/m3
6
4
2
0
06/03/2014 05/04/2014 06/05/2014 06/06/2014
Figure 3-12: Eight hourly average CO concentrations measured during March 2014 to
June 2014.
Page 18 Doc # 3267844Table 3-5: Summary of 8-hour average CO concentrations measured during March
2014 to June 2014.
Indicator 2014
"Good" 0-33% of guideline 100%
"Acceptable" 33-66% of guideline 0%
"Alert" 66-100% of guideline 0%
“Action” >Guideline 0%
Percentage of valid data 100%
3
Annual average (mg/m ) 0.4
Measured exceedances 0
3
99.7 %ile concentration (mg/m ) 2.4
3
Annual maximum (mg/m ) 3.0
Number of records 2291
3.5 Concentrations of nitrogen dioxide
During 10 June 2014 to 10 September 2014, one hourly average concentrations of
nitrogen dioxide (NO2) as measured at the Ohaupo Road monitoring station were well
below the NESAQ standard for NO2. The NESAQ standard for NO2 is 200 μg/m3 with
nine allowable exceedance per year (Refer to Figure 3.13). A maximum concentration
of 91.1 μg/m3, which is less than 50% of the standard, was recorded on 3 July 2014 at
8 am. The one-hour concentrations of NO2 were less than 66% of the NES and
national and regional ambient air quality guidelines with the majority of data (99.1%)
falling within the good air quality indicator category (Refer to Table 3.6).
Air quality standard
200
NO2 g/m3
150
100
50
0
01/06/2014 01/07/2014 01/08/2014 01/09/2014
Figure 3-13: Hourly average NO2 concentrations measured during June 2014 to
September 2014.
Doc # 3267844 Page 19Table 3-6: Summary of 1-hour average NO2 concentrations measured during 2014.
Indicator 2014
"Good" 0-33% of guideline 99.1%
"Acceptable" 33-66% of guideline 0.8%
"Alert" 66-100% of guideline 0%
“Action” >Guideline 0%
Percentage of valid data 98%
3
Annual average (µg/m ) 22.2
Measured exceedances 0
3
99.7 %ile PM10 concentration (µg/m ) 76.5
3
Annual maximum (µg/m ) 91.1
Number of records 2164
3.6 Comparison of meteorological conditions for
2014 to previous years
The frequency and extent of NES breaches from year to year depends largely on the
prevalence of meteorological conditions conducive to elevated pollution, in particular
low wind speeds, cooler temperatures and temperature inversions. Figure 3.14 and
Figure 3.15 compare summary statistics for wind speed and temperature from 1998 to
2014. The significantly higher wind speed average of 8 m/s in 2009 indicates an
anomaly with the data collected. Other Hamilton meteorological stations averaged
around 3 m/s which is more consistent with that expected for the Peachgrove Rd data.
Collection of meteorological data over the May to August period in 2014 at Claudelands
was sporadic and limited due to delays and problems with commissioning the
meteorological equipment after the initial commissioning of the FH62 BAM in April. For
this reason, the 2014 data is not sufficient to provide a statistical comparison with
previous years.
An evaluation of meteorological conditions and PM10 concentrations in Hamilton from
1998 to 2007 identified 24-hour average wind speed less than 0.74 m/s as the main
meteorological characteristic of elevated PM10 concentrations (Wilton, 2007). Figure
3.16 compares the number of days during the winter months when these
meteorological conditions occurred from 2000 to 2014 and the number of days each
year when PM10 concentrations exceeded 50 µg/m3. Even when excluding the results
for 2009 (refer anomalous data issue discussed above) there does not appear to be
any clear evidence in recent years that elevated concentrations are linked to years
when there is an increased number of days with low wind speeds over the winter
season.
Page 20 Doc # 3267844May to August (24-hour data)
9.0
8.0
7.0
Wind speed m/s
6.0 Mean
5.0 Median
4.0 25th Percentile
3.0 75th Percentile
2.0 Maximum
1.0
0.0
1998
1999
2000
2001
2002
2003
2004
2005
2006
2007
2008
2009
2010
2011
2012
2013
2014
Figure 3-14: Summary wind speed data from 1998 to 2014 at the Peachgrove Road site
(insufficient data available for 2014).
May to August (24-hour data)
30.0
28.0
26.0
24.0
Temperature degrees C
22.0
20.0 Mean
18.0
16.0 Median
14.0
12.0 25th Percentile
10.0 75th Percentile
8.0
6.0 Maximum
4.0
2.0
0.0
1999
2000
2001
2002
2003
2004
2005
2006
2007
2008
2009
2010
2011
2012
2013
2014
Figure 3-15: Summary temperature data from 1998 to 2014 at the Peachgrove Road site
(insufficient data available for 2014).
Doc # 3267844 Page 21Days less than 0.74 m/s Exceedances
45
40
35
30
25
20
15
10
5
0
Figure 3-16: Number of days from May to August when the 24-hr average wind speed
was less than 0.74 m/s and number of PM10 exceedances per year
(insufficient meteorological data available for 2014).
3.7 Daily variations on high pollution days
Meteorological conditions were available for only one of the five high pollution days
recorded in 2014. Figure 3.17 shows the daily variations in PM10 and PM2.5
concentrations and meteorological parameters on the 10 August 2014 when the daily
average PM2.5 concentration exceeded 25 µg/m3 (PM2.5 = 26 µg/m3 and PM10 = 29
µg/m3). The PM10 and PM2.5 concentrations both peaked around 2 am with a very
gradual drop off towards the middle of the day and a smaller peak at around 11 pm that
evening.
The PM10 and PM2.5 profiles are very similar apart from a more pronounced drop off to
zero for PM2.5 during the middle of the day compared with a more elevated
concentration of around 11 µg/m3 for PM10. The profiles are reasonably typical of those
that are observed in situations where woodburner emissions dominate the emission
sources. However, the more elevated concentration of PM10 during the middle of the
day indicates a greater component of the coarser particulate fraction during that part of
the day which is consistent with a dust source.
The wind speed and air temperature were both reasonably low during the peak PM10
and PM2.5 concentrations on the 10 August 2014 compared with the days prior to and
subsequent to this day (average daily wind speed of 1.2 m/s and average daily
temperature of 6.5 degrees) indicative of conditions expected during high pollution
events.
Page 22 Doc # 3267844AT WS WD PM10 PM2.5
20.0 350
Wind direction, PM10 & PM2.5
18.0
Wind speed & Temperature
300
16.0
14.0 250
12.0 200
10.0
8.0 150
6.0 100
4.0
50
2.0
0.0 0
Figure 3-17: Daily variation in PM10 and PM2.5 concentrations, wind speed, wind direction
and temperature on 10 August 2014 when the daily average PM2.5
concentration exceeded 25 µg/m3.
Doc # 3267844 Page 233.8 Trend analysis
Over time, air quality may improve, get worse, or remain the same. Peak levels of PM10
in any given airshed vary from winter to winter depending on meteorological conditions
and human responses. For example, higher PM10 and more exceedances might be
expected if a winter has a greater number of days when the wind speed is low and
there is vertical stability in the lower atmosphere. Over the short term this inter-annual
variability will mask any genuine underlying trend toward better or worse air quality. A
reasonably long monitoring record is needed to confirm or exclude the possibility of any
underlying trend.
Seasonal Mann-Kendall test for monotonic trends (consistently increasing or
decreasing trends) is the preferred approach for detecting underlying trends in variable
environmental time-series data sets, and may suggest presence of an underlying trend
which is not evident from visual inspection of the PM10 record or summary statistics.
This method generates probability (p) values that are used to assess the likelihood that
the apparent relationship is genuine, or comes about fortuitously as a result of a
random alignment of variables. The conventional threshold for deciding whether a
relationship is likely to be genuine is at a probability value of p = 0.05 or lower, which
corresponds to a 95% confidence level and greater. A negative MK-Stat indicates a
decreasing trend.
As reported in the 2013 Air Quality Monitoring Report, Seasonal Mann Kendall test
results for the Peachgrove Rd PM10 data (MK-Stat of -2.05 and p-value of 0.04)
provides possible evidence that PM10 concentrations in Hamilton were decreasing over
the period 2006 to 2013 (data corrections made for ignoring the impact of the eight
exempted exceedances during 2013). The Claudelands site PM10 data collected in
2014 has been excluded from this analysis as it is collected from a different site and
cannot be included in the trend analysis for the Peachgrove Rd site. At least four year’s
data will be required before a trend analysis can be applied to data collected at the
Claudelands site.
Based on this analysis and the current previous five year exceedance average (2010 to
2014) of 0.2 (2013 exceedances excluded), Hamilton could continue to meet the NES
target of no more than one exceedance per 12 month period. But this will be dependent
on meteorological conditions i.e. a particularly cold and calm winter could still result in
more than one exceedance with in a 12 month period resulting in Hamilton being
classified as a polluted airshed.
Page 24 Doc # 3267844You can also read