Modeling the Impact of an Indoor Air Filter on Air Pollution Exposure Reduction and Associated Mortality in Urban Delhi Household - MDPI
←
→
Page content transcription
If your browser does not render page correctly, please read the page content below

International Journal of
           Environmental Research
           and Public Health

Article
Modeling the Impact of an Indoor Air Filter on Air
Pollution Exposure Reduction and Associated
Mortality in Urban Delhi Household
Jiawen Liao 1, *,† , Wenlu Ye 1,† , Ajay Pillarisetti 2 and Thomas F. Clasen 1
 1    Department of Environmental Health, Rollins School of Public Health, Emory University,
      Atlanta, GA 30322, USA; wenlu.ye@emory.edu (W.Y.); thomas.f.clasen@emory.edu (T.F.C.)
 2    Environmental Health Sciences, School of Public Health, University of California, Berkeley, CA 94720, USA;
      ajaypillarisetti@berkeley.edu
 *    Correspondence: jiawen.liao@emory.edu
 †    Both authors contributed equally to the study.

 Received: 21 March 2019; Accepted: 14 April 2019; Published: 17 April 2019

 Abstract: Indoor exposure to fine particulate matter (PM2.5 ) is a prominent health concern. However,
 few studies have examined the effectiveness of long-term use of indoor air filters for reduction of
 PM2.5 exposure and associated decrease in adverse health impacts in urban India. We conducted
 20 simulations of yearlong personal exposure to PM2.5 in urban Delhi using the National Institute
 of Standards and Technology’s CONTAM program (NIST, Gaithersburg, MD, USA). Simulation
 scenarios were developed to examine different air filter efficiencies, use schedules, and the influence
 of a smoker at home. We quantified associated mortality reductions with Household Air Pollution
 Intervention Tool (HAPIT, University of California, Berkeley, CA, USA). Without an air filter, we
 estimated an annual mean PM2.5 personal exposure of 103 µg/m3 (95% Confidence Interval (CI):
 93, 112) and 137 µg/m3 (95% CI: 125, 149) for households without and with a smoker, respectively.
 All day use of a high-efficiency particle air (HEPA) filter would reduce personal PM2.5 exposure to
 29 µg/m3 and 30 µg/m3 , respectively. The reduced personal PM2.5 exposure from air filter use is
 associated with 8–37% reduction in mortality attributable to PM2.5 pollution in Delhi. The findings
 of this study indicate that air filter may provide significant improvements in indoor air quality and
 result in health benefits.

 Keywords: fine particulate matters (PM2.5 ); air filter; indoor air quality; CONTAM program;
 air exchange rate; health impact

1. Introduction
     Air pollution has been linked to increased risk of numerous diseases, including respiratory tract
infections [1], exacerbations of inflammatory lung conditions [2,3], cardiac events [3], cancer [4], and
low birth weight [5], and is regarded as one of the largest global health risk factors [6,7]. In India,
1.24 million (95% CI: 1.09–1.39) deaths in 2017 were attributable to air pollution, which was 12.5%
of the total deaths in the country. Among these, 0.67 million (95% CI: 0.55–0.79) were attributed to
ambient air pollution (AAP) and 0.48 million (95% CI: 0.39–0.58) were attributed to household air
pollution (HAP) [8]. Studies of fine particulate matter (PM2.5 ) predominate air pollution research,
mainly due to the detrimental health effects and high concentrations of PM2.5 in both indoor and
outdoor environments [9–11].
     While solid fuel combustion emits high levels of HAP in rural households [12,13], the combination
of HAP generated from both local and regional sources plus the AAP generated from industrial
activities, the power sector, and transportation elevates the risk in urban settings [14,15]. This is

Int. J. Environ. Res. Public Health 2019, 16, 1391; doi:10.3390/ijerph16081391      www.mdpi.com/journal/ijerph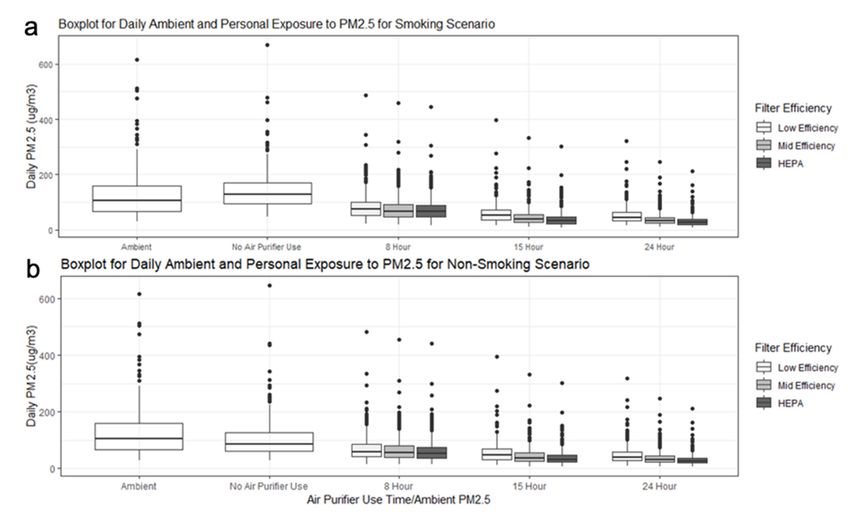
Int. J. Environ. Res. Public Health 2019, 16, 1391                                                   2 of 13

especially evident in India where four of the five cities with the highest ambient PM2.5 levels worldwide
are located [16]. The annual population-weighted mean exposure to ambient PM2.5 in India was
89.9 µg/m3 (95% uncertainty interval (UI) 67.0–112.0) in 2017, which was one of the highest in the
world. Among all Indian states, Delhi had the highest annual population-weighted mean ambient
PM2.5 level in 2017 (209.0 µg/m3 (95% UI 120.9–339.5)), far beyond the limit recommended by the
National Ambient Air Quality Standards in India [8].
     In many parts of the world, both ambient and indoor PM2.5 contributed to personal exposure to
PM2.5 [14]. Personal exposure to PM2.5 is determined by the PM2.5 concentrations in indoor and outdoor
environments, as well as the time-activity patterns of the exposed individual [9]. Many national surveys
and studies have shown that Indians spend most of their time in the indoor environment [9,17,18],
arguably making indoor spaces the most important environment in which to mitigate PM2.5 exposures.
PM2.5 concentrations in the indoor environment are influenced by various factors, including indoor
emission sources, outdoor PM2.5 levels, airflows into the home environment, and removal of the PM2.5
inside the home [19]. Many of these factors are dynamic and vary by time; thus, indoor PM2.5 levels
and exposure to PM2.5 levels change over time with distinct diurnal and seasonal patterns that are
modulated by individual and household level behaviors.
     Previous evidence in both developed [20,21] and developing countries [22,23] show that indoor
PM2.5 concentrations can be reduced effectively and substantially by using air filters. Such air filtration
has also been shown to have cardiovascular and pulmonary health benefits [22,24], including reduced
asthma symptoms and inflammation and improved airway mechanics [25]. Several studies in India
have investigated the effectiveness of HAP interventions on personal exposure to PM2.5 and health
benefits [26–28], and studies in urban Indian cities suggest that an air filter intervention alone cannot
reduce personal exposure to PM2.5 to the interim target guideline recommended by the World Health
Organization (WHO) of 35 µg/m3 [7,23]. This is mainly due to the dynamics of airborne contaminants
and continued infiltration of ambient air pollution [29]. In addition, the existing air filter intervention
studies only provided data on short-term health responses due to reduced exposures, such as changes
in cardiovascular biomarker level [22,30] or pulmonary functions of children with asthma [21,24,31].
The profile of long-term air pollution reduction and health benefits associated with air filter use have
not been assessed or evaluated.
     Models that simulate indoor concentrations and personal exposure to PM2.5 levels can be used
to examine the changes in personal exposure to PM2.5 and estimate the effectiveness of potential
pollution reduction strategies [29,32–34]. One of the validated simulation tools that has been widely
applied is the CONTAM program (National Institute of Standards and Technology NIST, Gaithersburg,
MD, USA, https://www.nist.gov/services-resources/software/contam), a multi-zone computer program
that simulates airflow between each zone and estimates contaminant concentrations or personal
exposures [35]. CONTAM has been applied extensively to assess indoor air quality in existing
residential buildings, and to evaluate the effectiveness of indoor air quality control interventions in
residential homes in United States cities [32,34]. The advantage of using the CONTAM simulation
program is that it is a publicly available program and can simulate time-resolved ventilation rates,
pollutant concentrations, and personal exposure levels based on air pollutants emission, decay rates, as
well as climate and ambient air pollution levels [36]. To our knowledge, this is the first study to utilize
CONTAM to assess the effectiveness of an indoor air quality intervention in residential household in
developing countries.
     In this study, we used CONTAM to simulate PM2.5 exposure over a one-year period for an
occupant living in a typical residential apartment in urban Delhi, the dense urban area with the highest
population-weight ambient PM2.5 concentration in 2017 [8]. We assessed the effectiveness of air filters
at different efficiency levels and under different user scenarios. We further estimated the effects of
reduced PM2.5 exposure on mortality using a customized version of the Household Air Pollution
Intervention Tool (HAPIT v.3.1, University of California, Berkeley, CA, USA https://hapit.org) [37].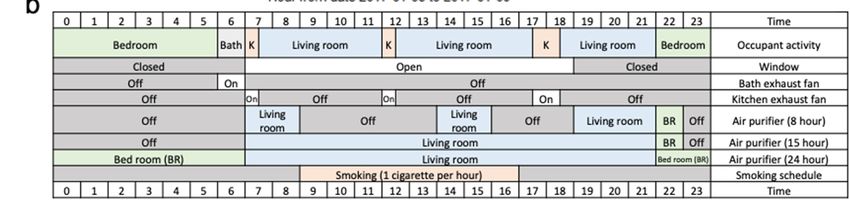
Int. J. Environ. Res. Public Health 2019, 16, x 3 of 13
Int. J. Environ. Res. Public Health 2019, 16, 1391 3 of 13
2. Materials and Methods
2. Materials and Methods
2.1. Study Overview
2.1. Study Overview
We used CONTAM (version 3.2) to estimate indoor air pollution concentrations and
We used CONTAM
concentration reductions (version
from 3.2)
an toairestimate indoor air
filter running pollution
under concentrations
a range and concentration
of scenarios. A flowchart
reductions from
summarizing anstudy
the air filter running under
procedures a range ofin
is illustrated scenarios.
Figure 1. A flowchart
We identifiedsummarizing the study
and defined the
procedures is illustrated in Figure 1. We identified and defined the characteristics
characteristics of a typical home in Delhi, including major PM2.5 sources and sinks and occupant of a typical home
in Delhi, including
schedules, major PMdaily
and incorporated 2.5 sources
weather anddata
sinks and
and occupant
hourly schedules,
ambient and incorporated
air pollution levels in 2017 daily
as
weather data and hourly ambient air pollution levels in 2017 as inputs
inputs for CONTAM simulations (Table 1). Then, we estimated annual indoor PM2.5 levels and indoorfor CONTAM simulations
(Table 1). Then,for
PM2.5 exposure we an
estimated
occupant annual
underindoor PM2.5 levels
20 constructed and indoor
scenarios based PM on exposure
2.5the fordesign
factorial an occupant
of the
under 20 constructed
following scenarios basedofonanthe
factors: Presence/absence airfactorial
filter at design
home, theof the following
efficiency factors:
of the Presence/absence
air filter, air filter use
of an air filter
duration, and at
thehome, the efficiency of
presence/absence of an
theactive
air filter, air filter
smoker use duration,
at home. Finally, and the presence/absence
we quantified the potentialof
an active
health smoker
benefit at home.with
associated Finally, we quantified
exposure reduction the resulted
potentialfrom
health airbenefit associated
filter use based onwiththeexposure
indoor
reduction
PM resulted
2.5 exposure from air filter use based on the indoor PM2.5 exposure differences.
differences.
Input - Home characteristics:
• Floor plan Scenarios:
Output - Scenarios:
• Wall leakage • Air filter presence at home
• Windows size and • Air filter PM2.5 removal
open/close schedule efficiency
• Exhaustive fan efficiency • Air filter in-use time
• Smoker presence at home
Input - PM2.5 source and sink:
• Cooking emission rate
Output - CONTAM:
• Smoking emission rate
• Hourly PM2.5 exposure over
• Indoor deposition rate
a year
• Air filter removal rate
• Hourly air flow in/out of
• Daily weather in Delhi in
home over a year
2017
• Hourly ambient PM2.5 levels
in Delhi in 2017 CONTAM modeling PM2.5
Input - Occupant schedule
Background disease rate in
Delhi HAPIT output: Mortality averted
per million people
Integrated exposure-response
curve
HAPIT modeling mortality
Figure 1.
Figure Flowchart of
1. Flowchart of the
the study
study procedure
procedure and
and model
model input/output.
input/output.Int. J. Environ. Res. Public Health 2019, 16, x 4 of 13
Int. J. Environ. Res. Public Health 2019, 16, 1391 4 of 13
Table 1. Household characteristics inputs for CONTAM simulations.
Table 1. Household characteristics inputs for CONTAM simulations.
Model Input
Parameter Description Schedule Reference
Parameter
Model Input Parameter Parameter Description Schedule Reference
Apartment containing 1 living 1
Apartment containing Residential buildings in India: energy use
Floor plan room, kitchen, bathroom,
living and
room, kitchen, andResidential buildingsGlobal
saving potentials, in India: energy use
building
Floor plan and saving potentials, Global building
bedroom, 30bathroom,
m2 and bedroom, performance network, 2014 [38]
performance network, 2014 [38]
30 m2 Residential buildings in India: energy use
Wall leakage Wall leakage area 5 cm2/m2 andResidential
saving potentials,
buildingsGlobal building
in India: energy use
Wall leakage area 5
Wall leakage and savingnetwork,
performance potentials, Global
2014 [38]building
cm2 /m2
Window 0.8 m2 open area in total Open: 7:00–18:00 performance network, 2014 [38]
Bath exhaust
Window 0.8 m 2 open area in total Open: 7:00–18:00
120 m3/h (70 cfm †) On: 6:00–7:00 Fabian et al., 2011, Indoor Air [31]
fanBath exhaust fan 120 m3 /h (70 cfm †) On: 6:00–7:00 Fabian et al., 2011, Indoor Air [31]
On when cooking
Kitchen On when cooking
Kitchen 170 m3/h (100
170cfm)
m3 /h (100 cfm) (7:00–7:30; 12:00–12:30;
12:00–12:30; Fabian et al., 2011, Indoor Air [31]
exhaust fanexhaust fan (7:00–7:30; Fabian et al., 2011, Indoor Air [31]
17:00–18:00)
17:00–18:00)
† cubic
† cubicfeet
feetper
perminute.
minute.
2.2. Simulated Indoor Environment
2.2. Simulated Indoor Environment
We used CONTAM version 3.2 to estimate the reduction of exposure to indoor PM2.5
concentrations from an air
We used CONTAM filter running
version underthe
3.2 to estimate a range of scenarios.
reduction Weto
of exposure defined
indooraPMhouse template in
2.5 concentrations
CONTAM
from an air to filter
simulate an apartment
running typicalofofscenarios.
under a range urban Delhi—one thataishouse
We defined located on the 1st
template floor of a
in CONTAM
building,
to simulatenaturally ventilated,
an apartment and of
typical contains a bedroom, that
urban Delhi—one living
is room,
locatedkitchen
on theand bathroom,
1st floor with a
of a building,
total area ofventilated,
naturally 30 m2 (Figureand2). This is aone
contains of the most
bedroom, common
living apartment
room, kitchen andfloor plans inwith
bathroom, the afour main
total area
cities 2
of 30ofmIndia [38]. 2).
(Figure TheThis
apartment
is one ofhasthe
a daily
mostair exchange
common rate (AER)
apartment ranging
floor plans from
in the0.3 to 4.5/h,
four main with
cities
annual
of Indiamean
[38].of The
1.5/h. Detailed house
apartment characteristics,
has a daily air exchangeair exchange
rate (AER)schedules,
ranging and
fromthe0.3references for
to 4.5/h, with
the assumptions are presented in Table 1.
annual mean of 1.5/h. Detailed house characteristics, air exchange schedules, and the references for the
assumptions are presented in Table 1.
Figure 2. Simulated floor plan and corresponding CONTAM schematic.
2.3. Contaminant Figure
Sources2.and
Simulated
Sinks floor plan and corresponding CONTAM schematic.
Major sources of indoor PM2.5 include cooking, smoking, and outdoor infiltration through
windows and wall leakages. Indoor PM2.5 removal mechanisms include deposition, exfiltration to
outdoor air through exhaust fan(s), windows and wall leakage, and removal of PM2.5 by a portable air
filter device, which is commonly seen on the Indian market [23]. For cooking emissions, we used the
PM2.5 emission rate from the liquefied petroleum gas (LPG) stove use instead of biomass use [39], sinceInt. J. Environ. Res. Public Health 2019, 16, 1391 5 of 13
Delhi has very high LPG coverage and traditional biomass only accounts for a small proportion of
cooking energy in urban India [40,41]. We estimated the PM2.5 emission rate for smoking cigarettes at
0.33 mg/min [31] and with an average frequency of 8 cigarettes per day [42]. In addition, we assumed
a PM2.5 deposition rate of 0.19/h [31] and simulated PM2.5 removal by the portable air filter devices
with different minimal efficiency removal values (MERV), corresponding to different PM2.5 removal
rates [43]. Table 2 summarizes the emission and removal rates used for each PM2.5 source and sink.
Table 2. Indoor fine particulate matter (PM2.5 ) sources, sinks, emission/removal rates, air filter PM2.5
removal efficiency, weather, and ambient air pollution data used in CONTAM simulation.
Source/Sink and Parameter Emission/Removal Rate Schedule Source
Cooking +0.14 mg/min 2 h a day
Shen et al., 2018,
7:00–7:30; 12:00–12:30; 17:00–18:00 Environmental Science
and Technology [39]
8 cigarettes per day, one
Smoking +0.33 mg/min per hour from 9:00–14:00 Fabian et al., 2011, Indoor Air [31]
in the day time
PM2.5 deposition −0.19/h Fabian et al., 2011, Indoor Air [31]
Either 8 h, 15 h, or 24 h a Azimi et al., 2014, Atmospheric
Air Filter at 200 Clean Air HEPA filter: 0.99
day Environment [44]
Delivery Rate (CADR), PM2.5
Medium efficiency filter:
removal efficiency
0.65
Low efficiency filter: 0.3
Typical meteorological year (TMY)
Weather hourly weather data from Energy
Plus [45]
The hourly ambient PM2.5 data in urban Delhi were obtained from all available air pollution
monitoring stations of the Central Pollution Control Board between 01/01/2017 and 12/31/2017 [46].
While India has expanded ground air pollution monitoring in recent years [47], only 9 air pollution
monitoring stations are available in Delhi over the whole year of 2017 [46]. Table S1 lists the name,
latitude, and longitude of all air pollution monitoring stations used in this study. The maximum distance
between the monitoring stations is less than 10 km. We constructed hourly PM2.5 concentrations in
2017 over 365 days from all ambient air pollution monitoring stations (N = 9) to represent hourly PM2.5
concentrations in the urban Delhi region. Figure S1 shows the map of the Delhi region and the location
of ambient air monitoring stations used in this study.
Hourly weather parameters (including temperature, wind speed, wind direction, relative humidity,
and pressure) for a typical meteorological year were obtained from Energy Plus (United States
Department of Energy) [45] to represent normal weather conditions in Delhi. All of these parameters
are inputs to model the hourly transient airflow and PM2.5 concentrations in indoor settings.
2.4. Simulation Scenarios
We conducted a factorial design to allow inclusion of scenarios that might be observed in a typical
apartment in urban Delhi. The key dimensions in our CONTAM factorial design were (i) air filter
types (low-efficiency filter with minimal efficiency removal values, MERV = 8; mid-efficiency filter,
MERV = 12; and HEPA filter [43]), (ii) air filter use schedule (8-hour, 15-hour, and all-day), and (iii)
smoking status of household member (yes or no). We ran CONTAM modeling across all combinations
of the above dimensions, resulting in 20 simulations in total (Table S2). The air filter we modeled has
a clean air delivery rate (CADR) of 200 cubic feet per minute (cfm), corresponding to 5.66 m3 /min.
The CADR rating system was used by American National Standards Institute (ANSI), indicating the
volume of filtered air by an air-filtering device over time [48]. The portable air purifier of CADR
200 with HEPA filter represents the average level of dominant commercial air filters available on the
Indian market; prices range between $250 and $1500 [23]. We also modeled air filters with lower(iii) smoking status of household member (yes or no). We ran CONTAM modeling across all
combinations of the above dimensions, resulting in 20 simulations in total (Table S2). The air filter we
modeled has a clean air delivery rate (CADR) of 200 cubic feet per minute (cfm), corresponding to
5.66 m3/min. The CADR rating system was used by American National Standards Institute (ANSI),
indicating the volume of filtered air by an air-filtering device over time [48]. The portable air purifier
Int. J. Environ. Res. Public Health 2019, 16, 1391 6 of 13
of CADR 200 with HEPA filter represents the average level of dominant commercial air filters
available on the Indian market; prices range between $250 and $1500 [23]. We also modeled air filters
with lower to
efficiency efficiency to reflect lower-quality
reflect lower-quality and more air
and more affordable affordable air filterTable
filter products. products. Tablethe
S3 shows S3detailed
shows
the detailed microenvironmental
microenvironmental locations oflocations of indoorand
indoor occupants occupants and user
user schedule of schedule
air filter. of air filter.
The CONTAM output files included PM
The CONTAM output files included PM2.5 concentrations in each room,PM
2.5 concentrations in each room, PM2.52.5personal
personalexposure
exposure
levels,
levels, and airflow rates into and out of each apartment wall, in hourly time incrementover
and airflow rates into and out of each apartment wall, in hourly time increment overoneoneyear.
year.
2.5.
2.5.Statistical
StatisticalAnalysis
Analysis
We
Weused
usedthetheCONTAM
CONTAMResult ResultExport
ExportTool,
Tool,ananonline
onlinedata
dataexport
exporttool
tool[49],
[49],totoconvert
convertCONTAM
CONTAM
output
outputfiles
files into txt and
into txt andcsv
csvfiles.
files.We
We used
used R (version
R (version 3.4, 3.4,
the Rthe R Foundation,
Foundation, Vienna,Vienna, Austria)
Austria) to
to analyze
analyze personal indoor PM exposure concentrations across all rooms in the apartment.
personal indoor PM2.5 exposure concentrations across all rooms in the apartment. Figure 3 shows the
2.5 Figure 3
shows theof
line plot line plot of aperiod
a one-day one-day ofperiod
ambient of PM
ambient PM2.5 concentrations
2.5 concentrations and PM2.5 and PM2.5 personal
personal exposure exposure
during a
during
heavilya polluted
heavily polluted day (9 2017)
day (9 January January 2017) combined
combined with occupant
with occupant activitiesactivities and use
and air filter air filter use
schedules
schedules
applied inapplied in simulations.
simulations. We analyzed We analyzed all year-round
all year-round personal PM personal PM2.5 exposure
2.5 exposure derived
derived from from
CONTAM
CONTAM
models and models andthe
assessed assessed
reductionthe reduction
of annual PM of annual PM2.5 exposure
2.5 personal personal exposure fromuse.
from air filter air filter use.
IllustrationofofCONTAM
Figure3.3.Illustration
Figure CONTAMmodelmodeloutput
outputand
anddata
dataanalysis
analysisfrom
from8 8January
Januarytoto9 9January
January2017;
2017;
(a) line plot of ambient PM
(a) line plot of ambient PM2.5 2.5 and personal exposure to PM
and personal exposure to PM2.5 under
2.5 under different air filter efficiencies;
different air filter efficiencies; (b)
(b) occupant
occupant schedule
schedule (K: kitchen,
(K: kitchen, BR: bedroom).
BR: bedroom).
2.6. Mortality Reduction Associated with Air Filter Use
2.6. Mortality Reduction Associated with Air Filter Use
To estimate mortality associated with indoor PM exposure and mortality associated with air
To estimate mortality associated with indoor PM2.52.5exposure and mortality associated with air
filter use, we modeled mortality per 100,000 population over one year for a customized version of the
filter use, we modeled mortality per 100,000 population over one year for a customized version of the
Household Air Pollution Intervention Tool (HAPIT) [37]. Additional details on the methodology are
available in the Supplemental Information, and it has been published elsewhere [37]. Briefly, HAPIT
estimated averted death using standard Global Burden of Disease Methods and counted for five causes
of death—chronic obstructive pulmonary disease, ischemic heart disease, stroke, and lung cancer
(for all ages), and acute lower respiratory infection (ALRI) in those under five years old. The main
modification to the current version of HAPIT was the utilization of sub-national background diseaseHousehold Air Pollution Intervention Tool (HAPIT) [37]. Additional details on the methodology are
available in the Supplemental Information, and it has been published elsewhere [37]. Briefly, HAPIT
estimated averted death using standard Global Burden of Disease Methods and counted for five
causes of death—chronic obstructive pulmonary disease, ischemic heart disease, stroke, and lung
Int.cancer (forRes.
J. Environ. all Public
ages),Health
and acute lower
2019, 16, 1391 respiratory infection (ALRI) in those under five years old. The 7 of 13
main modification to the current version of HAPIT was the utilization of sub-national background
disease specific to Delhi generated as part of the 2016 GBD India Exercise [50] and calculation of
specific
benefits tofor
Delhi generated
a single as part
year. We of theaverted
estimated 2016 GBD India rates
mortality Exercise [50] andtocalculation
attributable of benefits
the scenarios outlined for
previously,
a single year. with different air
We estimated filter mortality
averted efficiencies, air attributable
rates filter uses patterns, and presence/absence
to the scenarios of a
outlined previously,
smoker.
with different air filter efficiencies, air filter uses patterns, and presence/absence of a smoker.
3. 3.Results
Results
Figure4 4shows
Figure showsaaboxplot
boxplotfor forestimated
estimated daily
daily ambient
ambient PM 2.5concentration
PM2.5 concentrationand and personal
personal PM PM
2.5
2.5
exposures for all 20 simulated scenarios over a year. The annual mean personal indoor
exposures for all 20 simulated scenarios over a year. The annual mean personal indoor PM2.5 exposure PM 2.5 exposure
without
without smokingwas
smoking was103
103µg/m
µg/m33(95%(95% CI:
CI: 93–112).
93–112). ItItwas
waslower
lowerthan
thanthetheannual
annual ambient
ambient PM 2.5 mean
PM 2.5 mean
concentration of 123 µg/m 3
3 (95% CI: 115–131). The annual mean personal indoor
concentration of 123 µg/m (95% CI: 115–131). The annual mean personal indoor PM2.5 exposure PM 2.5 exposure with
an active
with smoker
an active was 137
smoker wasµg/m
3 (95%3CI: 125–149), higher than the ambient PM2.5 concentration. Figure 4
137 µg/m (95% CI: 125–149), higher than the ambient PM2.5 concentration.
also shows
Figure 4 also that
shows with increasing
that PM2.5 removal
with increasing efficiencyefficiency
PM2.5 removal and air filter
and use time,use
air filter the time,
annual themean
annual
personal PM2.5 exposure decreased in both smoking and non-smoking households.
mean personal PM2.5 exposure decreased in both smoking and non-smoking households.
Figure4.4.Boxplot
Figure Boxplotfor
fordaily
daily ambient
ambient PM2.5 concentrationsand
2.5concentrations andpersonal
personal exposure
exposure at different
at different air air filter
filter
use schedules;
use schedules;(a)
(a)smoking,
smoking,(b)(b) non-smoking.
non-smoking.
Based
Basedon onCONTAM
CONTAMsimulations,
simulations, the highest reductionof
highest reduction ofestimated
estimatedpersonal
personalPM PM exposure
exposure
2.5 2.5
occurred
occurred in in
scenarios
scenarios with
withall-day airair
all-day filter use.use.
filter However,
However, only all-day
only useuse
all-day of HEPA filterfilter
of HEPA yielded annual
yielded
annual mean PM personal exposure levels below 3
35 µg/m 3, the WHO Indoor Air Quality Guideline
mean PM2.5 personal exposure levels below 35 µg/m , the WHO Indoor Air Quality Guideline Interim
2.5
Interim
Target Target
1 [7]. 1 [7]. Theair15-hour
The 15-hour filter useairscenario
filter usealso
scenario
reduced alsoairreduced
pollutionair exposure
pollution levels
exposure levels
significantly,
significantly,
especially for HEPAespecially forwhere
filters, HEPA thefilters,
exposurewhere thewas
level exposure level was39approximately
approximately µg/m3 (without 39 aµg/m 3
smoker)
and(without
40 µg/m a smoker)
3 (with aand 40 µg/m
smoker
3 (with aScenarios
at home). smoker atinvolving
home). Scenarios
8-hour air involving 8-hour
filter use air filter
did not use as
perform
did not perform as well as the others, even for HEPA filters; all the annual mean
well as the others, even for HEPA filters; all the annual mean PM2.5 exposures with 15-hour and 8-hour PM 2.5 exposures with
air15-hour and
filter use 8-hour air
exceeded thefilter
WHO useIndoor
exceeded Airthe WHOGuideline
Quality Indoor Air Quality
Interim Guideline
1 Target of 35Interim
µg/m31. Target
This may
be due to the relatively high air exchange rate (annual mean AER = 1.5/h) of the whole apartment,
leading to the infiltration of ambient air pollution to the indoor environment.
Table 3 shows CONTAM simulated annual mean personal indoor PM2.5 exposures as well as
mortality averted for our scenarios with varied filter use and efficiency and the presence or absence
of a smoker. Using air filters can reduce PM2.5 exposures dramatically, ranging from 31%–72% for
smoker-absent scenarios and 38%–78% for smoker-present scenarios. From HAPIT, we estimated
698 deaths and 895 deaths per 100,000 person/year are associated with indoor PM2.5 exposure without
air filter use in Delhi, for smoker-absent and smoker-present scenarios, respectively. Based on personalInt. J. Environ. Res. Public Health 2019, 16, 1391 8 of 13
PM2.5 exposure reduction from air filter use, we estimated that using an air filter all day can reduce
mortality associated with indoor air pollution by between 8% and 37%.
Table 3. Annual mean exposure to PM2.5 indoors and health benefits due to air filter use at different
scenarios from CONTAM program.
Mortality (% of
Annual Mean PM2.5
Avoidable †) Averted
Exposure (µg/m3 )
per Million People
Smoker Smoker Smoker Smoker
Absent Present Absent Present
No Air Filter 103 137 NA NA
Low efficiency filter 71 84 61 (8.3) 75 (10.2)
8-hour Air Filter use
Mid efficiency filter 65 77 77 (10.3) 90 (12.1)
HEPA filter 62 78 85 (11.5) 88 (11.9)
Low efficiency filter 56 60 104 (14) 134 (18.1)
15-hour Air filter use Mid efficiency filter 44 46 150 (20.2) 184 (24.8)
HEPA filter 39 40 174 (23.5) 212 (28.6)
Low efficiency filter 50 56 125 (16.9) 146 (19.8)
All day air filter use Mid efficiency filter 35 38 196 (26.5) 222 (30)
HEPA filter 29 30 235 (31.8) 271 (36.6)
† Percent of the total air pollution burden in Delhi avoided by the intervention in one year.
In our sensitivity analyses, we evaluated the influence of window open time, window size, floor
level, and time spent outdoors on the effectiveness of air filters (Table S4). We found that with increased
duration of windows open and increased window area, annual mean AERs increased from 1.5/h
to 3.3/h when windows with 1 m2 cross-sectional area were opened for 24 hours per day, and the
effectiveness of the air filter decreased. Under that scenario, the annual mean PM2.5 exposure increased
from 29 µg/m3 to 58 µg/m3 , mainly due the infiltration of ambient air pollution from the outdoor
environment. When increasing the duration of time spent outdoors by 2 hours (from 14:00–16:00),
we also found an increase in annual PM2.5 personal exposure and decrease in effectiveness of air filters.
The floor of the apartment building did not significantly influence PM2.5 exposure, with less than 5%
difference in AERs and annual mean PM2.5 exposures. This is partly due to the fact that CONTAM
simulations did not show large difference in AERs across first and fourth floor apartments, leading to
similar PM2.5 personal exposure levels.
4. Discussion
We simulated use of an air filter in a residential household in urban Delhi for one year with the
CONTAM program and estimated its impact on the reduction of personal exposure to PM2.5 from
indoor and outdoor origins for one occupant living at home. We also estimated the effect on mortality
from different air filter use scenarios through PM2.5 exposure reduction. This is the first study modeling
the effectiveness of air filter use in developing countries. Results suggest that using air filters can
achieve substantial reductions in air pollution exposures, and these reductions could avert significant
ill-health associated with air pollution. The protective effects of the filter are greater with increased use
of higher quality, high-efficiency filters.
Our simulations are based on the CONTAM modeling program that makes certain assumptions
on indoor particle dynamics and on an occupant’s schedule over a year. Previous evaluations of
CONTAM have shown that its simulations of airflow, AERs, and particle concentrations were in good
agreement with field measurements [51,52]. In our CONTAM simulations, airflow across each room
and in/out of each room was calculated hourly, as were indoor PM2.5 concentrations under a well-mixed
microenvironment assumption. Our CONTAM simulation has an annual mean AER of 1.5/h (daily
range 0.3 to 4.5/h) for residential homes in Delhi, which is smaller than the previously measured AER
of 2.5/h–5.1/h from urban roadside homes near Agra, India [53]. Our simulated AER was also based onInt. J. Environ. Res. Public Health 2019, 16, 1391 9 of 13
the assumption that the occupants would adjust their behaviors to close windows at night and reduce
air exchange when the air filter was in use, leading to smaller AERs compared to the scenarios when
windows are always open in previous studies [53]. Nevertheless, the AER of 1.5/h is still considered
very high in urban homes in United States [31], and this also causes a relatively high infiltration of
outdoor air pollution to the indoor environment. In the sensitivity analysis, we conducted simulations
to allow larger window areas and longer periods with the windows open. The AERs increased to 3.3/h
annual mean (daily range 0.5/h–11.1/h) when windows with 1 m2 cross-sectional area are open for
24 hours per day, and annual PM2.5 exposure levels with all-day use of HEPA air filter increased to
58 µg/m3 , indicating considerable reduction in air filter effectiveness (Table S4).
The indoor PM2.5 exposure results from our study are consistent with prior studies that investigated
indoor air filter use and air pollutant exposure, either by modeling [31,34] or field measurement [20,22–24].
Our study adds to the current evidence base by modeling the effects of air filters with different efficiencies
and various user scenarios for a year, as well as by estimating mortality reduction. The relatively
small health benefits, compared to larger PM2.5 exposure reduction, are mainly due to the shape of the
state-of-the-science exposure-response curve used in HAPIT tool [37], indicating further reduction of PM2.5
exposure level is needed to achieve more substantial public health benefits. When the air filter is used all
day, we found little difference in personal exposure to PM2.5 between smoker-absent and smoker-present
scenarios (29 µg/m3 vs. 30 µg/m3 ). This implies minimal offset of health risks from passive smoking by
using indoor air filters. This also suggests that outdoor PM2.5 infiltration may have more influence on
personal exposure than other factors, including the presence of a smoker in the home. Indoor smoking in
homes, however, poses numerous other risks and, naturally, use of an air filter would not abate exposures
to the smoker and likely would reduce but not eliminate second-and-thirdhand smoke exposures to
individuals in proximity of the smoker.
As these results are derived from hypothetical intensive air filter use, they may not fully represent
real-life situations. Our model indicated 15-hour and 8-hour air filter use cannot reduce PM2.5 below
35 µg/m3 . This limited exposure and health risk reduction capacity was mainly due to the relatively
high AER (1.5/h) and high ambient air pollution in Delhi. Considering the fact that many residential
buildings have AER higher than 1.5/h, [53] the effectiveness of air filters could be further diminished if
the buildings have more leaks or windows are open for longer periods of time, as indicated in our
sensitivity analysis (Table S4). Therefore, we believe that air filters may not be considered as the sole
intervention strategy to reduce health risk from indoor air pollution exposure; other interventions and
exposure reduction strategies targeting the sources and transport of high-level ambient air pollution in
Delhi should also be in place [23]. Additionally, the price range of dominant commercial air filters on
the Indian market is $250–$1500. Air filter is still a costly home appliance compared to the average
monthly expenditure of urban Delhi residents [23]. Therefore, cost–benefit analyses for air filter use
could be another important future research direction to maximize the potential of air filter use in
combating this pressing environmental health issue.
A limitation of this study is that we did not conduct field investigations (personal PM2.5 exposure
measurement and population epidemiological studies) to validate the assumptions or results. Thus,
while this study is suggestive of potential reductions in exposure and associated health benefits,
these must to confirmed in the field. One such study is underway in Ulaanbaatar, Mongolia, where
wintertime ambient PM2.5 concentrations often exceed those of Delhi [54–56]. Another limitation of
this study is that some of our assumptions may not fully reflect the building environment in urban
Delhi and the variabilities in population behaviors, due to lack of building stock data and population
time–activity pattern data. Though we conducted sensitivity analysis to model the effectiveness of air
filter use in apartments with different window open schedules, AERs, and occupant schedules, there
will often be gaps between simulation results and actual effectiveness assessment of air filter use in
real urban Delhi homes.Int. J. Environ. Res. Public Health 2019, 16, 1391 10 of 13
5. Conclusions
Our simulation suggests that consistent use of indoor air filters can reduce indoor air pollution
exposure for urban Delhi households. The reduced exposure from air filtration could avert between
8% and 37% of air pollution related mortality, depending on air filter efficiency, use time, and passive
smoking behaviors. If these results were confirmed experimentally, air filters could offer significant
health benefits to residents of highly polluted urban environments.
Supplementary Materials: The following are available online at http://www.mdpi.com/1660-4601/16/8/1391/
s1, Figure S1: Map of study area and ambient air monitoring stations; Table S1: Ambient air pollution
station and corresponding longitude and latitude; Table S2: Details of CONTAM simulation models; Table S3:
Microenvironment schedule of occupants and user schedule for air filter; Table S4: Sensitivity analysis with
different window opening times, window sizes, floors, and time spent outdoors.
Author Contributions: Conceptualization, J.L., W.Y., and T.F.C.; data curation, J.L.; formal analysis, J.L., W.Y.,
and A.P.; funding acquisition, T.F.C.; investigation, J.L. and W.Y.; methodology, J.L., W.Y., and A.P.; project
administration, T.F.C.; resources, W.Y.; software, J.L, W.Y., and A.P.; supervision, T.F.C.; validation, J.L. and A.P.;
visualization, J.L and W.Y.; writing—original draft, J.L., W.Y., A.P., and T.F.C.; writing—review and editing, W.Y.
and T.F.C.
Funding: This research was partially funded by a grant from Unilever, Ltd., which manufactures and sells air
filters designed for household use. The content is solely the responsibility of the authors and does not necessarily
represent the official views of Unilever, Ltd.
Conflicts of Interest: The authors declare no conflict of interest.
References
1. Smith, K.R.; McCracken, J.P.; Weber, M.W.; Hubbard, A.; Jenny, A.; Thompson, L.M.; Balmes, J.; Diaz, A.;
Arana, B.; Bruce, N. Effect of reduction in household air pollution on childhood pneumonia in Guatemala
(RESPIRE): A randomised controlled trial. Lancet 2011, 378, 1717–1726. [CrossRef]
2. Meng, X.; Wang, C.; Cao, D.; Wong, C.-M.; Kan, H. Short-term effect of ambient air pollution on COPD
mortality in four Chinese cities. Atmos. Environ. 2013, 77, 149–154. [CrossRef]
3. Dominici, F.; Peng, R.D.; Bell, M.L.; Pham, L.; McDermott, A.; Zeger, S.L.; Samet, J.M. Fine Particulate Air
Pollution and Hospital Admission for Cardiovascular and Respiratory Diseases. JAMA 2006, 295, 1127–1134.
[CrossRef]
4. Iii, C.A.P.; Burnett, R.T.; Thun, M.J.; Calle, E.E.; Krewski, D.; Ito, K.; Thurston, G.D. Lung Cancer,
Cardiopulmonary Mortality, and Long-term Exposure to Fine Particulate Air Pollution. JAMA 2002,
287, 1132–1141.
5. Pope, D.P.; Mishra, V.; Thompson, L.; Siddiqui, A.R.; Rehfuess, E.A.; Weber, M.; Bruce, N.G. Risk of Low Birth
Weight and Stillbirth Associated with Indoor Air Pollution From Solid Fuel Use in Developing Countries.
Epidemiol. Rev. 2010, 32, 70–81. [CrossRef]
6. Gakidou, E.; Afshin, A.; Abajobir, A.A.; Abate, K.H.; Abbafati, C.; Abbas, K.M.; Abd-Allah, F.; Abdulle, A.M.;
Abera, S.F.; Aboyans, V.; et al. Global, regional, and national comparative risk assessment of 84 behavioural,
environmental and occupational, and metabolic risks or clusters of risks, 1990–2016: A systematic analysis
for the Global Burden of Disease Study 2016. Lancet 2017, 390, 1345–1422. [CrossRef]
7. World Health Organization. WHO Guidelines for Indoor Air Quality: Household Fuel Combustion; World Health
Organization: Geneva, Switzerland, 2014.
8. Balakrishnan, K.; Dey, S.; Gupta, T.; Dhaliwal, R.S.; Brauer, M.; Cohen, A.J.; Stanaway, J.D.; Beig, G.; Joshi, T.K.;
Aggarwal, A.N.; et al. The impact of air pollution on deaths, disease burden, and life expectancy across the
states of India: The Global Burden of Disease Study 2017. Lancet Planet. Health 2019, 3, e26–e39. [CrossRef]
9. Pant, P.; Guttikunda, S.K.; Peltier, R.E. Exposure to particulate matter in India: A synthesis of findings and
future directions. Environ. Res. 2016, 147, 480–496. [CrossRef]
10. Smith, K.R. National burden of disease in India from indoor air pollution. Proc. Natl. Acad. Sci. USA 2000,
97, 13286–13293. [CrossRef]
11. Balakrishnan, K.; Ghosh, S.; Ganguli, B.; Sambandam, S.; Bruce, N.; Barnes, D.F.; Smith, K.R. State and
national household concentrations of PM2.5 from solid cookfuel use: Results from measurements and
modeling in India for estimation of the global burden of disease. Environ. Health 2013, 12, 77. [CrossRef]Int. J. Environ. Res. Public Health 2019, 16, 1391 11 of 13
12. Satsangi, P.G.; Yadav, S.; Pipal, A.S.; Kumbhar, N. Characteristics of trace metals in fine (PM2.5 ) and inhalable
(PM10) particles and its health risk assessment along with in-silico approach in indoor environment of India.
Atmos. Environ. 2014, 92, 384–393. [CrossRef]
13. Balakrishnan, K.; Sambandam, S.; Ramaswamy, P.; Mehta, S.; Smith, K.R. Exposure assessment for respirable
particulates associated with household fuel use in rural districts of Andhra Pradesh, India. J. Expo. Sci.
Environ. Epidemiol. 2004, 14, S14–S25. [CrossRef] [PubMed]
14. Pant, P.; Habib, G.; Marshall, J.D.; Peltier, R.E. PM2.5 exposure in highly polluted cities: A case study from
New Delhi, India. Environ. Res. 2017, 156, 167–174. [CrossRef] [PubMed]
15. Conibear, L.; Butt, E.W.; Knote, C.; Arnold, S.R.; Spracklen, D.V. Residential energy use emissions dominate
health impacts from exposure to ambient particulate matter in India. Nat. Commun. 2018, 9, 617. [CrossRef]
16. WHO Global Ambient Air Quality Database. Available online: http://www.who.int/airpollution/data/cities/
en/ (accessed on 14 August 2018).
17. Rajivan, A.K. Policy Implications for Gender Equity: The India Time Use Survey, 1998–1999. In Proceedings
of the International Seminar on Time Use Surveys, Ahmedabad, India, 7–10 December 1999; p. 31.
18. Shimada, Y.; Matsuoka, Y. Analysis of indoor PM2.5 exposure in Asian countries using time use survey.
Sci. Total Environ. 2011, 409, 5243–5252. [CrossRef]
19. Nazaroff, W.W. Indoor particle dynamics. Indoor Air 2004, 14, 175–183. [CrossRef] [PubMed]
20. Batterman, S.; Du, L.; Mentz, G.; Mukherjee, B.; Parker, E.; Godwin, C.; Chin, J.-Y.; O’Toole, A.; Robins, T.;
Rowe, Z.; et al. Particulate matter concentrations in residences: An intervention study evaluating stand-alone
filters and air conditioners. Indoor Air 2012, 22, 235–252. [CrossRef]
21. Noonan, C.W.; Semmens, E.O.; Smith, P.; Harrar, S.W.; Montrose, L.; Weiler, E.; McNamara, M.; Ward, T.J.
Randomized Trial of Interventions to Improve Childhood Asthma in Homes with Wood-burning Stoves.
Environ. Health Perspect. 2017, 125, 097010. [CrossRef]
22. Chen, R.; Zhao, A.; Chen, H.; Zhao, Z.; Cai, J.; Wang, C.; Yang, C.; Li, H.; Xu, X.; Ha, S.; et al. Cardiopulmonary
benefits of reducing indoor particles of outdoor origin: A randomized, double-blind crossover trial of air
purifiers. J. Am. Coll. Cardiol. 2015, 65, 2279–2287. [CrossRef]
23. Vyas, S.; Srivastav, N.; Spears, D. An Experiment with Air Purifiers in Delhi during Winter 2015–2016.
PLoS ONE 2016, 11, e0167999. [CrossRef]
24. Cui, X.; Li, F.; Xiang, J.; Fang, L.; Chung, M.K.; Day, D.B.; Mo, J.; Weschler, C.J.; Gong, J.; He, L.; et al.
Cardiopulmonary effects of overnight indoor air filtration in healthy non-smoking adults: A double-blind
randomized crossover study. Environ. Int. 2018, 114, 27–36. [CrossRef]
25. Xu, Y.; Raja, S.; Ferro, A.R.; Jaques, P.A.; Hopke, P.K.; Gressani, C.; Wetzel, L.E. Effectiveness of heating,
ventilation and air conditioning system with HEPA filter unit on indoor air quality and asthmatic children’s
health. Build. Environ. 2010, 45, 330–337. [CrossRef]
26. Dutta, K.; Shields, K.N.; Edwards, R.; Smith, K.R. Impact of improved biomass cookstoves on indoor air
quality near Pune, India. Energy Sustain. Dev. 2007, 11, 19–32. [CrossRef]
27. Hanna, R.; Duflo, E.; Greenstone, M. Up in Smoke: The Influence of Household Behavior on the Long-Run
Impact of Improved Cooking Stoves. Am. Econ. J.: Econ. Policy, Am. Econ. Assoc. 2012, 8, 80–114.
28. Mukhopadhyay, R.; Sambandam, S.; Pillarisetti, A.; Jack, D.; Mukhopadhyay, K.; Balakrishnan, K.;
Vaswani, M.; Bates, M.N.; Kinney, P.; Arora, N.; et al. Cooking practices, air quality, and the acceptability
of advanced cookstoves in Haryana, India: An exploratory study to inform large-scale interventions.
Glob. Health Act. 2012, 5, 19016. [CrossRef]
29. Johnson, M.; Lam, N.; Brant, S.; Gray, C.; Pennise, D. Modeling indoor air pollution from cookstove emissions
in developing countries using a Monte Carlo single-box model. Atmos. Environ. 2011, 45, 3237–3243.
[CrossRef]
30. Shao, D.; Du, Y.; Liu, S.; Brunekreef, B.; Meliefste, K.; Zhao, Q.; Chen, J.; Song, X.; Wang, M.; Wang, J.; et al.
Cardiorespiratory responses of air filtration: A randomized crossover intervention trial in seniors living in
Beijing: Beijing Indoor Air Purifier StudY, BIAPSY. Sci. Total Environ. 2017, 603–604, 541–549. [CrossRef]
[PubMed]
31. Fabian, M.P.; Stout, N.K.; Adamkiewicz, G.; Geggel, A.; Ren, C.; Sandel, M.; Levy, J.I. The effects of indoor
environmental exposures on pediatric asthma: A discrete event simulation model. Environ. Health Glob.
Access Sci. Source 2012, 11, 66. [CrossRef] [PubMed]Int. J. Environ. Res. Public Health 2019, 16, 1391 12 of 13
32. Fabian, P.; Adamkiewicz, G.; Levy, J.I. Simulating indoor concentrations of NO2 and PM2.5 in multi-family
housing for use in health-based intervention modeling. Indoor Air 2012, 22, 12–23. [CrossRef] [PubMed]
33. Johnson, M.A.; Chiang, R.A. Quantitative Guidance for Stove Usage and Performance to Achieve Health
and Environmental Targets. Environ. Health Perspect. 2015, 123, 820–826. [CrossRef] [PubMed]
34. Myatt, T.A.; Minegishi, T.; Allen, J.G.; MacIntosh, D.L. Control of asthma triggers in indoor air with air
cleaners: A modeling analysis. Environ. Health 2008, 7, 43. [CrossRef] [PubMed]
35. Polidoro, B. CONTAM. Available online: https://www.nist.gov/services-resources/software/contam (accessed
on 13 August 2018).
36. Dols, W.S.; Polidoro, B.J. CONTAM User Guide and Program Documentation Version 3.2; Technical Note. NIST
TN-1887; National Institute of Standards and Technology: Gaithersburg, MD, USA, 2015.
37. Pillarisetti, A.; Mehta, S.; Smith, K.R. HAPIT, the Household Air Pollution Intervention Tool, to Evaluate
the Health Benefits and Cost-Effectiveness of Clean Cooking Interventions. In Broken Pumps and Promises;
Springer: Cham, Switzerland, 2016; pp. 147–169. ISBN 978-3-319-28641-9.
38. Rawal, R.; Shukla, Y. Residential Buildings in India: Energy Use Projections and Savings Potentials; Global
Buildings Performance Network (GBPN): Paris, France, 2014.
39. Shen, G.; Yang, Y.; Wang, W.; Tao, S.; Zhu, C.; Min, Y.; Xue, M.; Ding, J.; Wang, B.; Wang, R.; et al. Emission
Factors of Particulate Matter and Elemental Carbon for Crop Residues and Coals Burned in Typical Household
Stoves in China. Environ. Sci. Technol. 2010, 44, 7157–7162. [CrossRef] [PubMed]
40. Ministry of Petroleum and Natural Gas, Government of India. LPG Profile - data on LPG Marketing; Ministry
of Petroleum & Natural Gas: New Delhi, India, 2017.
41. Bureau of Energy Efficiency (BEE). User Guide for India’s 2047 Energy Calculator—Cooking Sector; Ministry of
Power: New Delhi, India, 2015.
42. International Institute for Population Sciences. Global Adult Tobacco Survey—India 2009–2010; International
Institute for Population Sciences: Mumbai, India, 2010.
43. Method of Testing General Ventilation Air-Cleaning Devices for Removal Efficiency by Particle Size: ANSI/ASHRAE
Standard 52.2-2017; ASHRAE: Atlanta, GA, USA, 2017.
44. Azimi, P.; Zhao, D.; Stephens, B. Estimates of HVAC filtration efficiency for fine and ultrafine particles of
outdoor origin. Atmos. Environ. 2014, 98, 337–346. [CrossRef]
45. EnergyPlus. Available online: https://energyplus.net/weather (accessed on 14 April 2018).
46. Ministry of Environment & Forests of Government of India Central Pollution Control Board (CPCB). Available
online: http://www.cpcb.gov.in/CAAQM/frmUserAvgReportCriteria.aspx (accessed on 15 April 2019).
47. Gordon, T.; Balakrishnan, K.; Dey, S.; Rajagopalan, S.; Thornburg, J.; Thurston, G.; Agrawal, A.; Collman, G.;
Guleria, R.; Limaye, S.; et al. Air pollution health research priorities for India: Perspectives of the Indo-U.S.
Communities of Researchers. Environ. Int. 2018, 119, 100–108. [CrossRef] [PubMed]
48. American National Standards Institute Method for Measuring Performance of Portable Household Electric Room Air
Cleaners: ANSI/AHAM AC-1-2015; Association of Home Appliance Manufacturers: Washington, DC, USA, 2015.
49. CONTAM Results Export Tool. Available online: https://pages.nist.gov/CONTAM-apps/webapps/contam_
results_exporter/index.htm (accessed on 20 June 2018).
50. ICMR; PHFI; IHME Indian Council of Medical Research, Public Health Foundation of India, and Institute for
Health Metrics and Evaluation. Available online: http://vizhub.healthdata.org/gbd-compare/india (accessed
on 6 December 2018).
51. Haghighat, F.; Megri, A.C. A Comprehensive Validation of Two Airflow Models—COMIS and CONTAM.
Indoor Air 1996, 6, 278–288. [CrossRef]
52. Emmerich, S.J.; Nabinger, S.J. Measurement and Simulation of the IAQ Impact of Particle Cleaners in a Single-Zone
Building; NIST InteragencyInternal Rep. NISTIR-6461; National Institute of Standards and Technology:
Gaithersburg, MD, USA, 2000.
53. Massey, D.; Kulshrestha, A.; Masih, J.; Taneja, A. Seasonal trends of PM10 , PM5.0 , PM2.5 & PM1.0 in indoor
and outdoor environments of residential homes located in North-Central India. Build. Environ. 2012, 47,
223–231.
54. Barn, P.; Gombojav, E.; Ochir, C.; Boldbaatar, B.; Beejin, B.; Naidan, G.; Galsuren, J.; Legtseg, B.; Byambaa, T.;
Hutcheon, J.A.; et al. The effect of portable HEPA filter air cleaner use during pregnancy on fetal growth:
The UGAAR randomized controlled trial. Environ. Int. 2018, 121, 981–989. [CrossRef]Int. J. Environ. Res. Public Health 2019, 16, 1391 13 of 13
55. Barn, P.; Gombojav, E.; Ochir, C.; Laagan, B.; Beejin, B.; Naidan, G.; Boldbaatar, B.; Galsuren, J.; Byambaa, T.;
Janes, C.; et al. The effect of portable HEPA filter air cleaners on indoor PM2.5 concentrations and second
hand tobacco smoke exposure among pregnant women in Ulaanbaatar, Mongolia: The UGAAR randomized
controlled trial. Sci. Total Environ. 2018, 615, 1379–1389. [CrossRef]
56. Yuchi, W.; Gombojav, E.; Boldbaatar, B.; Galsuren, J.; Enkhmaa, S.; Beejin, B.; Naidan, G.; Ochir, C.; Legtseg, B.;
Byambaa, T.; et al. Evaluation of random forest regression and multiple linear regression for predicting
indoor fine particulate matter concentrations in a highly polluted city. Environ. Pollut. 2019, 245, 746–753.
[CrossRef]
© 2019 by the authors. Licensee MDPI, Basel, Switzerland. This article is an open access
article distributed under the terms and conditions of the Creative Commons Attribution
(CC BY) license (http://creativecommons.org/licenses/by/4.0/).You can also read