Where to enhance rural palliative care? Developing a spatial model to identify suitable communities most in need of service enhancement - BMC ...
←
→
Page content transcription
If your browser does not render page correctly, please read the page content below
Schuurman et al. BMC Health Services Research            (2020) 20:168
https://doi.org/10.1186/s12913-020-5024-y

 RESEARCH ARTICLE                                                                                                                                  Open Access

Where to enhance rural palliative care?
Developing a spatial model to identify
suitable communities most in need of
service enhancement
Nadine Schuurman1* , Michael E. Martin2, Valorie A. Crooks1 and Ellen Randall3

  Abstract
  Background: In Canada, access to palliative care is a growing concern, particularly in rural communities. These
  communities have constrained health care services and accessing local palliative care can be challenging. The Site
  Suitability Model (SSM) was developed to identify rural “candidate” communities with need for palliative care
  services and existing health service capacity that could be enhanced to support a secondary palliative care hub.
  The purpose of this study was to test the feasibility of implementing the SSM in Ontario by generating a ranked
  summary of rural “candidate” communities as potential secondary palliative care hubs.
  Methods: Using Census data combined with community-level data, the SSM was applied to assess the suitability of
  12 communities as rural secondary palliative care hubs. Scores from 0 to 1 were generated for four equally-
  weighted components: (1) population as the total population living within a 1-h drive of a candidate community;
  (2) isolation as travel time from that community to the nearest community with palliative care services; (3)
  vulnerability as community need based on a palliative care index score; and (4) community readiness as five
  dimensions of fit between a candidate community and a secondary palliative care hub. Component scores were
  summed for the SSM score and adjusted to range from 0 to 1.
  Results: Population scores for the 12 communities ranged widely (0.19–1.00), as did isolation scores (0.16–0.94).
  Vulnerability scores ranged more narrowly (0.27–0.35), while community readiness scores ranged from 0.4–1.0.
  These component scores revealed information about each community’s particular strengths and weaknesses. Final
  SSM scores ranged from a low of 0.33 to a high of 0.76.
  Conclusions: The SSM was readily implemented in Ontario. Final scores generated a ranked list based on the
  relative suitability of candidate communities to become secondary palliative care hubs. This list provides
  information for policy makers to make allocation decisions regarding rural palliative services. The calculation of each
  community’s scores also generates information for local policy makers about how best to provide these services
  within their communities. The multi-factorial structure of the model enables decision makers to adapt the relative
  weights of its components.
  Keywords: Spatial modelling, Palliative care services, Rural, Decision support

* Correspondence: nadine@sfu.ca
1
 Geography Department, Simon Fraser University, Robert C. Brown Hall, 8888
University Road, Burnaby, BC V5A 1S6, Canada
Full list of author information is available at the end of the article

                                       © The Author(s). 2020 Open Access This article is licensed under a Creative Commons Attribution 4.0 International License,
                                       which permits use, sharing, adaptation, distribution and reproduction in any medium or format, as long as you give
                                       appropriate credit to the original author(s) and the source, provide a link to the Creative Commons licence, and indicate if
                                       changes were made. The images or other third party material in this article are included in the article's Creative Commons
                                       licence, unless indicated otherwise in a credit line to the material. If material is not included in the article's Creative Commons
                                       licence and your intended use is not permitted by statutory regulation or exceeds the permitted use, you will need to obtain
                                       permission directly from the copyright holder. To view a copy of this licence, visit http://creativecommons.org/licenses/by/4.0/.
                                       The Creative Commons Public Domain Dedication waiver (http://creativecommons.org/publicdomain/zero/1.0/) applies to the
                                       data made available in this article, unless otherwise stated in a credit line to the data.
Schuurman et al. BMC Health Services Research (2020) 20:168 Page 2 of 8
Background increasingly moves beyond hospitals to be delivered at
Palliative care encompasses a range of services provided home, there is a need for strong community nursing
to support people “living with, or dying from, advanced capacity which is often not adequate in rural communi-
illness” [1] in ways that optimize the quality of their life ties, and these nurses can be hindered by lack of suffi-
and, ultimately, their death [1, 2]. Palliative care also ex- cient support services and equipment [25]. These rural
tends beyond the patient, providing support to family realities are troubling given the desire of many Cana-
members during end of life and bereavement; these fam- dians to die “in-place.” Further, lack of adequate
ily members, in turn, are often themselves key informal community-based care can impede the wishes of rural
providers of palliative care [3]. Beyond family members, residents who want to die at home; in Western Canada,
formal palliative services are delivered by a wide variety for example, rural residents have been found to spend
of providers including primary care physicians, specialist more time in hospital in the last year of life compared to
physicians, hospital staff, home care nurses, social those living in urban centres [18].
workers, and spiritual advisors—with a goal of facilitat-
ing an end-of-life experience that is comfortable and
Spatial locational analysis modelling in support of
dignified [3, 4].
improved access to rural palliative care
Access to palliative care is a growing concern for
Given the challenges with rural provision of palliative
Canada’s aging population, where the number of Cana-
care services, there is a “need for innovative models of
dians over 65 years of age is projected to grow to almost
service provision” ([14], p., 256) in order to provide
one in four (23%) by 2031 [5]. This growing population
ready, local access to palliative care services in rural
will necessitate adjustments in healthcare provision to
communities. In response, our research team has under-
ensure the range of and capacity for end-of-life services
taken a multi-year research program that has resulted in
that are required to meet the needs of individuals during
the development of a spatial locational analysis model
this life stage [6–9]. Canada, however, has lagged behind
that supports the creation of secondary palliative care
in preparing for its aging population and there are con-
hubs (SPCHs) at regional levels [26–30]. Understanding
cerns about the gap between palliative care needs and
the locational implications of health services as a dimen-
available services [6, 10–12]. While the increasing de-
sion of access to adequate health care is recognized as a
mand for palliative care is now beginning to receive
valuable input to decision making about siting health
greater attention in research literature, there remains an
services [31–34], including palliative care [26]. An SPCH
insufficient focus on the particular barriers to accessing
is a site that can enable access to local palliative care by
this type of care in rural communities [13, 14].
combining existing health care provision with support
Place of residence is recognized as a social determin-
from palliative care specialists in primary urban centres,
ant of health [15, 16]. The mechanisms underwriting dif-
through telemedicine and video-conferencing. The Site
ferences in health status between urban and rural
Suitability Model (SSM), which we introduce in this
residents are various (e.g., income, employment, socio-
paper, enables the identification of rural communities
economic status) and include access to health care ser-
with need for and community interest in palliative care
vices [15]. Globally, access to palliative care within one’s
services, as well as existing health service and personnel
home region is relatively limited in rural areas [17], and
capacity, that have the potential to be enhanced to en-
this holds true in Canada [18–20], where roughly 19% of
able the creation of an SPCH [27, 28].
the population lives in areas designated as rural [21].
Working with a spatial sensibility, the SSM provides a
Across Canada, rural regions are characterized by geo-
locational analysis of rural communities with regard to
graphic isolation, vast distances between communities,
their suitability as potential sites for an SPCH.
and relatively small populations. These factors contrib-
The purpose of this study was to test the feasibility of
ute to challenges in the recruitment and retention of
implementing the newly refined SSM in order to identify
health care providers; in 2016, while 19% of Canadians
and rank a set of rural communities in the province of
lived in rural communities, only 8% of physicians prac-
Ontario based on their suitability as SPCH candidates. A
ticed in these communities [22]. For specialized pallia-
secondary goal was to use the ranked suitability list as a
tive care, which ideally draws on a multi-disciplinary
form of evidence to allocate secondary palliative care
team of practitioners and specialists, the reality is even
hubs.
more stark: only 2.3% of Canada’s specialists work in
rural communities [22]. Palliative care in rural settings,
therefore, is seldom provided by dedicated specialists Methods
[23]. Instead, rural patients rely on generalist providers The assessment of a community’s suitability as a candi-
and the limited formal and informal services available in date site for a rural SPCH rests a community’s final SSM
their communities [23, 24]. As palliative care score. As a summative model, the SSM generates a totalSchuurman et al. BMC Health Services Research (2020) 20:168 Page 3 of 8
community score from four equally-weighted compo- Community readiness
nent scores. Community readiness is a measure of fit between an
SPCH and a candidate community and introduces as-
sessments of capacity. Operationalized as five binary
Components of the site suitability model Yes/No variables, it captures both community willing-
Population ness and structural capacity (Table 2) [29]. Data for this
Using readily available Canadian Census data, this com- component came from the Census as well as from infor-
ponent assesses need for local services and is operation- mation gathered through the review of relevant websites
alized as the total population living within a 1-h drive of and by phone calls to relevant organizations.
a potential hub community. The working assumption is As a summative score, in order to achieve an overall
that the larger the catchment population, the larger the maximum score of 1, each community readiness meas-
potential need for services. The choice of 1 h reflects ure was assigned a value of 0.2 for a Yes.
considerations of barriers to patients’ and providers’ abil-
ity to reasonably travel during the end-of-life phase [27]. Site suitability model scoring
Travel-time catchments were generated with ArcGIS The SSM generates community scores by totalling the
[35] using road data from the CanMap Network dataset four component scores—population, isolation, vulner-
[36] and Statistics Canada Census Blocks within each 1- ability, and community readiness. Each component score
h catchment aggregated to provide population counts. was equally weighted and summed yielding an initial
The population component is scored as a range from 0 model score ranging from 0 to 4. Final values were
to 1, based on the populations of the dissemination scaled to 0–1. A cut-point of 0.6 is suggested as a lower
blocks within an hour drive time. The largest population bound for eligibility, based on past experience; this value
is given a score on 1, and the remaining population cen- is discretionary and will need testing and possible adjust-
tres are scored as a proportion relative to that centre. ment in subsequent applications of the model.
Isolation Community selection criteria
Using the ArcGIS “near facility” tool, travel times were For consideration in this study, the community selection
estimated between SPCH candidate communities and process worked with the set of all population centres in
the nearest community with palliative care services. This Ontario, based on the 2011 Canadian Census [41]. We
determinant of need assumes that the greater the travel elected to implement the SSM at the provincial level be-
time, the greater the need for access to local palliative cause the provinces in Canada bear the primary respon-
care [27]. The isolation score is scored as a range from 0 sibility for the provision of health care services. Ontario
to 1. Communities that are a minimum of 4 h driving was selected because it is Canada’s most populous prov-
travel time from a community with existing specialized ince. The first step was to reduce this set to communi-
palliative care services are given a score of 1. Communi- ties with over 5000 residents [42]. This constraint
ties whose travel time is less than 4 h are given propor- ensured that a new SPCH would service a sufficient
tional scores relative to the communities that scored 1. catchment population. The set of population centres was
then further reduced to only include those over a 1-h
drive time to the nearest palliative care centre. The def-
Vulnerability inition for a palliative care centre included general hos-
The vulnerability component is a community’s palliative pitals with more than 500 beds, identified from the
care index (PCIX) score [30]. The PCIX incorporates Guide to Canadian Healthcare Facilities [43], as well as
four key variables associated with increased potential dedicated hospice facilities with more than three hospice
need for palliative care services, all drawn or generated beds, identified from government and community web-
from Statistics Canada data (Table 1). sites and verified over the telephone. This ensured we
Composite PCIX scores have a value between 0 and 1: were identifying communities without easy spatial access
all four variables are evenly weighted and scored be- to palliative care services.
tween 0 and 1, then summed and divided by 4. Each
PCIX element is scaled relative to the minimum and Results
maximum values in each province; for example, the Community selection
community (or communities) with the highest percent- The 2011 Canadian Census lists 270 population centres
age of people over 75 is assigned a 1, and all other com- in Ontario; applying the criterion of a population of at
munities are scored relative to that community. More least 5000 people reduced the set of possible population
information on the PCIX scoring methodology is avail- centres to 104 [44]. The set was further reduced by ap-
able in a paper by Schuurman et al. [30]. plying a 1-h drive time from the centroid of eachSchuurman et al. BMC Health Services Research (2020) 20:168 Page 4 of 8
Table 1 The elements of the PCIX, which is used as the vulnerability component for the SSM. See referenced papers for more detail
on scoring [30, 37, 38]
Variable Measure Data sources
Age Percentage of catchment population over age 75 Statistics Canada
Census data
Sex Percentage of catchment population that is female Statistics Canada
Census data
Living Percentage of catchment population that lives alone Statistics Canada
arrangement Census data
VANDIX score Composite of 7 dissemination area-level indicators: percentage of residents who have not completed high Statistics Canada
school; unemployment rate over age 15 years; percentage of lone-parent families; average total income; percent- Census data
age of homeowners; and employment ratio [37, 38]
population centre to the closest palliative care centre; communities, as are training and education resources.
using the criterion of a drive greater than 1 h to such a Telemedicine is being used in all communities and
centre produced a final list of 12 population centres nearly all of the population centres had adequate access
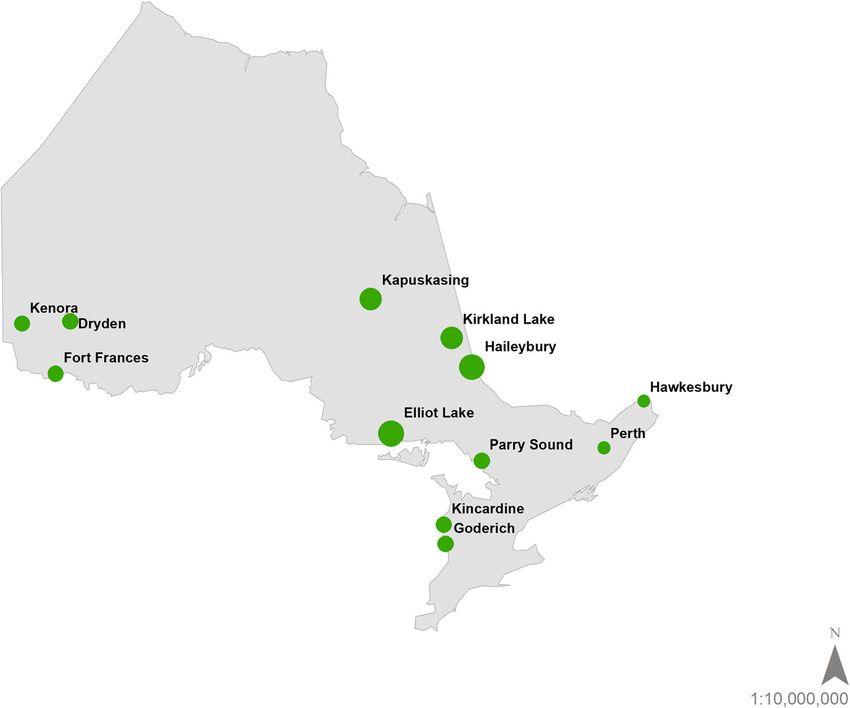
across the province of Ontario (Fig. 1). These communi- to physicians, with the exception of Haileybury. The mo-
ties, for the most part, were found in the southern re- mentum scores, however, show that formal initiatives to-
gions of the province. wards local palliative services are largely lacking.
Site suitability model scores
Component scores
Scores for the 12 communities (Table 5) ranged from a
The population component scores for the 12 communi-
low of 0.33 for Hawkesebury to a high of 0.76 for Fort
ties, indicating the size of local population an SPCH
Frances, indicating the latter may be the most suitable
would serve, ranged widely from a low of 0.19 for the
location of this particular set of communities for further
town of Perth to a high of 1.00 for Fort Frances. The iso-
investigation and investment. Three communities had
lation scores for these communities, signalling their rela-
scores above the preliminary cut-point of 0.6, designated
tive distance from specialized palliative care services that
as the proposed threshold for suitability. Having the
were not available in their home communities, also
component scores reveals where communities have
ranged widely from a low of 0.16 for Hawkesbury to a
weaknesses and strengths, and these can vary across site
high of 0.94 for Dryden.
with the same score. For example, Kapuskasing and Kin-
Using the PCIX formula [30], overall vulnerability
cardine have identical SSM scores, but their component
scores were generated from four sub-scores for these 12
scores reveal that while Kincardine had a fairly high
Ontario communities. The vulnerability scores and
community readiness score, Kapuskasing did not.
ranged narrowly, from 0.27 to 0.35 (Table 3).
The community readiness scores for the Ontario com-
munities are presented in Table 4. The municipality of Discussion
Parry Sound is the only population centre to achieve the The SSM represents a data-driven approach to identify-
maximum score of 1. The sub-scores reveal that com- ing potential sites for SPCHs in rural areas that incorpo-
munity awareness is largely present across the set of rates multiple factors that affect a community’s need for
Table 2 The elements of the community readiness component for the SPCH SSM. See referenced papers for more detail on scoring
Variable Measure (Yes/No) Data sources
Community Presence of local hospice society Community websites; BC Hospice Palliative Care Association listings
awareness
Training and Presence of local college or university Maximum 1 h drive time to college or university. List of facilities collated using the
education Association of Accredited Universities and Colleges of Canada website
Telemedicine Regular use of telemedicinea Confirmation from administrators at local hospitals of regular telemedicine use.
utilization
Adequate supply of Family physician to population ratio: at Number of family physicians: MDSelect database
family doctors most 1307 persons per physician Population: Statistics Canada Census data
Momentum Expression of interest for local hospice Confirmation from local hospice(s) of discussions or proposals for local hospice
residence
a
For the purposes of this study, telemedicine is considered the provision of clinical support to local health care providers through use of information and
communication technologies [39, 40]Schuurman et al. BMC Health Services Research (2020) 20:168 Page 5 of 8
Fig. 1 Potential SPCH sites in Ontario. The 12 communities identified as potential SPCH sites in the province of Ontario. Dot size correlates to
SPCH score. This map was created by the authors in ESRI ArcGIS
and appropriateness as a potential SPCH hub. Developed
and tested in the province of BC, the latest model was
tested in the province of Ontario, demonstrating its
portability and utility in any context where there are
Table 3 Sub-scores and final vulnerability scores, based on the readily accessible Census, spatial, and local resource data
PCIX methodology, for potential SPCH host communities in to generate the component and final SSM scores. The
Ontario model, therefore, enhances the ability of provincial
Vulnerability (PCIX) Scores for possible Ontario SPCH sites health care decision makers to utilize these types of pub-
Community Age Sex Living VANDIX VulnerabilityScore
licly available data to generate assessments of rural com-
Name (%) (%) Arrangement munities’ suitability as potential SPCH sites which can
(%) provide much needed local end-of-life resources for
Dryden 0.08 0.46 0.08 0.53 0.29 aging ex-urban populations in Canada and beyond.
Elliot Lake 0.13 0.46 0.12 0.67 0.35 Though designed and tested in individual provinces in
Fort Frances 0.10 0.46 0.10 0.52 0.30 Canada, this model has transferability to other contexts
that face similar challenges in rural health service
Goderich 0.11 0.49 0.09 0.47 0.29
provision, such as Australia and the United States.
Haileybury 0.12 0.51 0.10 0.67 0.34
The results detailed for the Ontario communities re-
Hawkesbury 0.09 0.50 0.08 0.48 0.28 veal the architecture of the SSM. Constructed using a
Kapuskasing 0.10 0.47 0.12 0.64 0.33 set of key information-rich components, the model
Kenora 0.09 0.42 0.09 0.55 0.29 returns a corresponding set of component sub-scores
Kincardine 0.12 0.50 0.10 0.49 0.30 that extend the model’s value. Each component on its
own provides valuable information for health care deci-
Kirkland 0.10 0.46 0.10 0.63 0.32
Lake sion makers about key aspects of the populations they
Parry Sound 0.18 0.47 0.10 0.52 0.30
are trying to serve. This is particularly apparent in a
component like community readiness, which provides
Perth 0.08 0.43 0.08 0.49 0.27
stakeholders with key information about a community’sSchuurman et al. BMC Health Services Research (2020) 20:168 Page 6 of 8 Table 4 Community Readiness scores for potential SPCH host communities in Ontario Community Readiness Scores for possible Ontario SPCH sites Community Name Community awareness Training/education Telemedicine Adequate supply of FPs Momentum Score Dryden 0.2 0.2 0.2 0.2 0 0.8 Elliot Lake 0.2 0 0.2 0.2 0 0.6 Fort Frances 0.2 0.2 0.2 0.2 0 0.8 Goderich 0.2 0 0.2 0.2 0 0.6 Haileybury 0.2 0.2 0.2 0 0 0.6 Hawkesbury 0 0.2 0.2 0.2 0 0.6 Kapuskasing 0 0 0.2 0.2 0 0.4 Kenora 0.2 0.2 0.2 0.2 0 0.8 Kincardine 0.2 0.2 0.2 0.2 0 0.8 Kirkland Lake 0.2 0.2 0.2 0.2 0 0.8 Parry Sound 0.2 0.2 0.2 0.2 0.2 1.0 Perth 0.2 0.2 0.2 0.2 0 0.8 relative strengths and weaknesses in this domain. Kelly needs. For example, in the Atlantic province of New- et al. [24], for example, identified insufficient foundland & Labrador the factor of drive time might community-level understanding of palliative care as a benefit from being adjusted or weighted differently in potential challenge to overcome in the development of acknowledgement of the impact of the coastal environ- local rural palliative services. The community readiness ment on the road network [45]. This adaptability facili- component has indicators that speak directly to this tates a critical input to ensuring successful need for local understanding—e.g., the community implementation of the tool at the provincial or local awareness indicator—and can aid decision makers in level, and ultimately, the validation of its output— pinpointing particular vulnerabilities within their com- namely, the expert knowledge of local stakeholders. munities that need prioritizing. These decision makers can draw on their experience and Further, the model is inherently flexible. Components expertise to recalibrate the SSM to best represent the can be modified, dropped, or added according to site- current reality within their communities. specific priorities. Similarly, weights can be valued and Given the importance of “on-the-ground” knowledge revalued based on evolving resources and population and expertise to the optimal calibration of the SSM, Table 5 Summary of the SSM component scores and final SPCH SSM scores. Component scores are summed and divided by four to generate the final scores SSM Scores for possible Ontario SPCH sites Community Name Population Score Isolation Score VulnerabilityScore Community Readiness Score SSM Score Dryden 0.81 0.94 0.29 0.80 0.71 Elliot Lake 0.68 0.45 0.35 0.60 0.52 Fort Frances 1.00 0.93 0.30 0.80 0.76 Goderich 0.23 0.22 0.29 0.60 0.34 Haileybury 0.56 0.41 0.34 0.60 0.48 Hawkesbury 0.26 0.16 0.28 0.60 0.33 Kapuskasing 0.46 0.44 0.33 0.40 0.41 Kenora 0.87 0.56 0.29 0.80 0.63 Kincardine 0.25 0.27 0.30 0.80 0.41 Kirkland Lake 0.26 0.26 0.32 0.80 0.41 Parry Sound 0.21 0.25 0.30 1.00 0.44 Perth 0.19 0.22 0.27 0.80 0.37
Schuurman et al. BMC Health Services Research              (2020) 20:168                                                                           Page 7 of 8

future research with this model is intended in order to                         original manuscript. VAC helped conceptualize and develop the model, and
explore the “fit” between SSM community scores and                              participated in reviewing and revising the manuscript. ER participated in the
                                                                                conceptualization of the manuscript and undertook manuscript revising and
community stakeholders’ perceptions of their communi-                           editing. The authors read and approved the final manuscript.
ties’ actual suitability and viability for becoming an
SPCH. A series of case studies comprising interviews                            Funding
                                                                                This study was funded by an Operating Grant awarded by the Canadian
with key stakeholders is envisioned.                                            Institutes of Health Research (CIHR). The funding did not affect the design of
                                                                                the study, data collection, analysis or interpretation. VAC holds the Canada
Limitations and considerations                                                  Research Chair in Health Service Geographies and a Scholar Award from the
                                                                                Michael Smith Foundation for Health Research. Her research time is
One of the key strengths of the SSM, the ability to adjust                      protected through both awards.
weights to reflect individual local contexts, is also a po-
tential shortcoming in that the model does not offer a                          Availability of data and materials
                                                                                1) Statistics Canada Census of the Population, and GIS Data, as facilitated
“one-size-fits-all” weighting system that is sure to be ap-
                                                                                through the University of Toronto CHASS Database:
propriate across all communities. Deployment of the                             StatsCan Data: https://www150.statcan.gc.ca/n1/en/type/data?MM=1
tool at a provincial level across multiple communities,                         CHASS: http://datacentre.chass.utoronto.ca/. This is a closed dataset, open
                                                                                only to Canadian University researchers.
for example, will require input from community-level
                                                                                2) DMTI CanMap Route Logistics network Datasets:
stakeholders who will need to bring their expert know-                          https://www.dmtispatial.com/canmap/. This is a closed dataset, open only to
ledge to bear on assigning appropriate weights to the                           Canadian University researchers.
                                                                                3) AUCC lists of Canadian university and colleges:
model’s components. The SSM may also not always ac-
                                                                                https://www.aucc.ca/. This is an open dataset.
count for particular contextual factors that could influ-                       4) Scott’s Directories MD Select Canadian Medical Directory:
ence the delivery of palliative care within individual rural                    https://www.mdselect.ca/canadian-doctors-directory/. This dataset is available
                                                                                to purchase.
communities, for instance a factor such as health system
                                                                                5) Community hospice societies:
bureaucracy [24]. Interpreting the community scores                             This data was gathered from individual community websites, direct calls to
within the context of a larger structural influences such                       hospitals and practitioners as well as direct calls to Telehealth Ontario.
                                                                                https://www.ontario.ca/page/get-medical-advice-telehealth-ontario . These
as the health system will again depend on the expertise
                                                                                data are freely a.
of the decision makers tasked with making decisions
about allocating palliative care resources.                                     Ethics approval and consent to participate
                                                                                Ethics Approval was waived by Simon Fraser University Office of Research
                                                                                Ethics based on the nature of the analysis and absence of human subjects.
Conclusions
The SSM is the product of over a decade of iterative de-                        Consent for publication
velopment to create a nuanced and flexible model that                           Not applicable.
can draw upon available public data and readily collected
                                                                                Competing interests
local data to generate information that will aid decision                       The authors declare that they have no competing interests.
makers at community and provincial levels to identify a
                                                                                Author details
community’s suitability as an SPCH site. The model is                           1
                                                                                 Geography Department, Simon Fraser University, Robert C. Brown Hall, 8888
information-rich: given its multi-factorial structure, even                     University Road, Burnaby, BC V5A 1S6, Canada. 2University of Auckland, 23
if communities are not ultimately selected as SPCH sites,                       Symonds Street, Auckland 1142, New Zealand. 3School of Population and
                                                                                Public Health, University of British Columbia, 2206 East Mall, Vancouver, BC
the calculation of their population, isolation, vulnerabil-
                                                                                V6T 1Z3, Canada.
ity, and community readiness component scores pro-
vides policy makers and other stakeholders with key                             Received: 4 June 2019 Accepted: 24 February 2020
information that can inform decisions about resource al-
location. Given the multi-factorial structure of the                            References
model, the SSM will enable decision makers to adapt the                         1. Canadian Hospice Palliative Care Association. What is palliative care? http://
relative weights of its components to generate scores                               www.chpca.net/family-caregivers/faqs.aspx. Accessed 23 February 2018.
                                                                                2. World Health Organization. WHO Definition of Palliative Care. http://www.
that reflect their individual knowledge about the needs                             who.int/cancer/palliative/definition/en/. Accessed 21 Feb 2018.
and resources of their jurisdictions.                                           3. Canadian Hospice Palliative Care Association. Who provides palliative care?
                                                                                    http://www.chpca.net/family-caregivers/faqs.aspx. Accessed 21 Feb 2018.
Abbreviations                                                                   4. National Consensus Project for Quality Palliative Care. Clinical Practice
BC: British Columbia; PCIX: Palliative Care Index; SPCH: Secondary Palliative       Guidelines for Quality Palliative Care. 3rd ed. Pittsburgh; 2013.
Care Hub; SSM: Site Suitability Model                                           5. Statistics Canada. Age and sex, and type of dwelling data: Key results from
                                                                                    the 2016 Census. https://www150.statcan.gc.ca/n1/daily-quotidien/170503/
Acknowledgements                                                                    dq170503a-eng.htm? HPA=1. Accessed 1 Nov 2018.
Not applicable.                                                                 6. Canadian Hospice Palliative Care Association. The pan-Canadian gold
                                                                                    standard for palliative home care-towards equitable access to high quality
Authors’ contributions                                                              hospice palliative and end-of-life Care at Home. Ottawa: Canadian Hospice
NS helped conceptualize the model, was involved in all stages of its                Palliative Care Association; 2006.
development and analysis, and participated in reviewing and revising the        7. Connor SR. Development of hospice and palliative care in the United States.
manuscript. MM undertook all the GIS analyses for this study and drafted the        OMEGA. 2008;56:89–99.
Schuurman et al. BMC Health Services Research (2020) 20:168 Page 8 of 8
8. Krakauer EL. Just palliative care: responding responsibly to the suffering of 35. Schuurman N, Fiedler RS, Grzybowski SCW, Grund D. Defining rational
the poor. J Pain Symptom Manag. 2008;36:505–12. hospital catchments for non-urban areas based on travel-time. Int J Health
9. Kuebler KK, Lynn J, Von Rohen J. Perspectives in palliative care. Semin Oncol Geogr. 2006;5:1–11.
Nurs. 2005;21:2–10. 36. DMTI Spatial. CanMap Route Logistics Network Dataset v2011.3. 2011.
10. Carstairs S. Still not there: quality end-of-life care: a progress report; 2005. 37. Bell N, Hayes MV. The Vancouver area Neighbourhood deprivation index
11. Romanow RJ. Shape the future of health care: interim report. Saskatoon: (VANDIX): a census-based tool for assessing small-area variations in health
Commission on the Future of Health Care in Canada; 2002. status. Can J Public Health. 2012;103:S28–32.
12. Standing Senate Committee on Social Affairs Science and Technology. 38. Bell N, Schuurman N, Oliver L, Hayes MV. Towards the construction of place-
Quality end-of-life care: The right of every Canadian. Final report. https:// specific measures of deprivation: a case study from the Vancouver
sencanada.ca/content/sen/committee/362/upda/rep/repfinjun00-e.htm. metropolitan area. Can Geogr. 2007;51:444–61.
Accessed 3 Mar 2018. 39. Wootton R, Menzies J, Ferguson P. Follow-up data for patients managed by
13. Crooks VA, Schuurman N. Reminder: palliative care is a rural medicine issue. store and forward telemedicine in developing countries. J Telemed
Can J Rural Med. 2008;13:139–41. Telecare. 2009;15:83–8.
14. Robinson CA, Pesut B, Bottorff JL, Mowry A, Broughton S, Fyles G. Rural 40. World Health Organization. Telemedicine. Opportunities and development
palliative care: A comprehensive review. J Palliat Med. 2009;12:253–8. in Member States. In: Global Observatory for eHealth. Geneva: World Health
15. Canadian Institute for Health Information & Canadian Population Health Organization; 2010.
Initiative. How healthy are rural Canadians? An assessment of their health 41. Statistics Canada. 2011 census of the population. Ottawa: Statistics Canada; 2011.
status and health determinants. Ottawa: Canadian Institute for Health 42. Statistics Canada. 2006 census of the population. Ottawa: Statistics Canada; 2006.
Information; 2006. 43. Canadian Health Association. HealthCareCAN | Guide to Canadian
16. Kelly MP, Morgan A, Bonnefoy J, Butt J, Bergman V. The social determinants Healthcare Facilities. 2012.
of health: Developing an evidence base for political action. Final Report to 44. Ontario Ministry of Health and Long-term Care. Ontario Health Insurance
World Health Organization Commission on the Social Determinants of Plan – Out of Province Services (OOP)- Prior Approval. http://www.health.
Health. http://cdrwww.who.int/social_determinants/resources/mekn_final_ gov.on.ca/en/public/programs/ohip/outofprovince/priorapproval.aspx.
report_102007.pdf; 2007. Accessed 11 Nov 2018.
17. Evans R, Stone D, Elwyn G. Organizing palliative care for rural populations: a 45. Schuurman N, Amram O, Crooks VA, Johnston R, Williams A. A comparative
systematic review of the evidence. Fam Pract. 2003;20:304–10. analysis of potential spatio-temporal access to palliative care services in two
18. Canadian Institute for Health Information. Health care use at the end of life Canadian provinces. BMC Health Serv Res. 2015;15:270.
in Western Canada. Ottawa: CIHI; 2007.
19. Collier R. Access to palliative care varies widely across Canada. CMAJ. 2011;183:E87–8. Publisher’s Note
20. Bacon J. Hospice palliative home care in Canada: A progress report. Ottawa: Springer Nature remains neutral with regard to jurisdictional claims in
Quality End-of-Life Care Coalition of Canada (QECCC); 2008. published maps and institutional affiliations.
21. Statistics Canada. Population counts, for Canada, provinces and territories,
census divisions, population centre size groups and rural areas, 2016 Census –
100% data. http://www12.statcan.gc.ca/census-recensement/2016/dp-pd/hlt-
fst/pd-pl/Table.cfm? Lang=Eng&T=703&S=87&O=A. Accessed 12 Mar 2018.
22. Canadian Institute for Health Information. Supply, distribution and migration
of physicians in Canada, 2016: Data Tables. Ottawa: Canadian Institute for
Health Information. https://secure.cihi.ca/estore/productSeries.htm?pc=
PCC34; 2017.
23. Kelley ML. Developing rural communities’ capacity for palliative care: a
conceptual model. J Palliat Care. 2007;23:143–53.
24. Kelley ML, Williams A, DeMiglio L, Mettam H. Developing rural palliative
care: validating a conceptual model. Rural Remote Health. 2011;11:1717.
25. Kaasalainen S, Brazil K, Williams A, Wilson D, Willison K, Marshall D, Taniguchi
A. Barriers and enablers to providing palliative care in rural communities: a
nursing perspective. J Rural Community Dev. 2012;7:4–19.
26. Cinnamon J, Schuurman N, Crooks VA. A method to determine spatial
access to specialized palliative care services using GIS. BMC Health Serv Res.
2008;8:140.
27. Cinnamon J, Schuurman N, Crooks VA. Assessing the suitability of host
communities for secondary palliative care hubs: a location analysis model.
Health Place. 2009;15:822–30.
28. Crooks VA, Castleden H, Schuurman N, Hanlon N. Visioning for secondary
palliative care service hubs in rural communities: a qualitative case study
from British Columbia's interior. BMC Palliative Care. 2009;8:15.
29. Crooks VA, Schuurman N, Cinnamon J, Castleden H, Johnston R. Refining a
location analysis model using a mixed methods approach: community
readiness as a key factor in siting rural palliative care services. J Mixed
Methods Res. 2011;5:77–95.
30. Schuurman N, Martin M, Crooks VA, Randall E. The development of a spatial
palliative care index instrument for assessing population-level need for
palliative care services. Health Place. 2018;49:50–8.
31. Mahar S, Bretthauer KM, Salzarulo PA. Locating specialized service capacity
in a multi-hospital network. Eur J Oper Res. 2011;212:596–605.
32. Rahman S, Smith DK. Use of location-allocation models in health service
development planning in developing nations. Eur J Oper Res. 2000;123:437–52.
33. Syam SS, Côté MJ. A location–allocation model for service providers with
application to not-for-profit health care organizations. Omega. 2010;38:157–66.
34. Shah T, Bell S, Wilson K. Spatial accessibility to health care services:
identifying under-serviced neighbourhoods in Canadian urban areas. PLoS
One. 2016;11:e0168208.You can also read