2020 Harvard Community Health Needs Assessment - Our Mission: Exceptional health care services with a passion for making lives better - Mercy ...
←
→
Page content transcription
If your browser does not render page correctly, please read the page content below
2020 Harvard
Community Health Needs
Assessment

Our Mission:
Exceptional health care services
with a passion for making lives better.
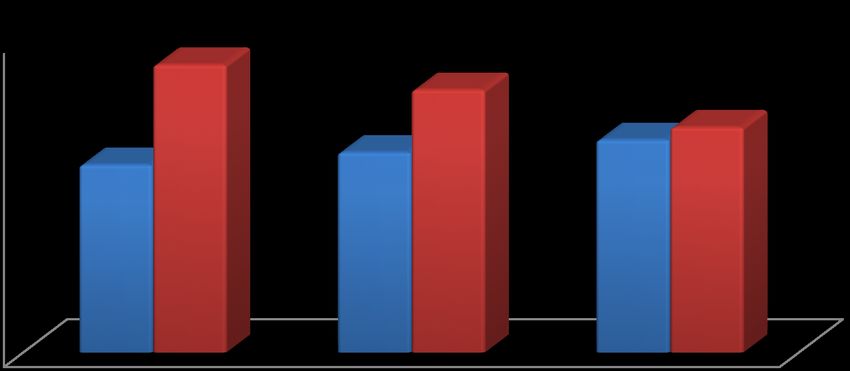
TABLE OF CONTENTS

Executive Summary …………………………………..…………..….....                   2
Methodology ………………………………………..……………..…....                       3
Demographic Profile
     Population …..………………………………………….……….....                    4
     Age, Gender and Race Distribution.……………………………….            6
     Economic Factors ……………………………………………….....                   7
     Education …………………………………………………………..                        10
Prevention Behaviors
     Accessibility ……………………………………………………….                      11
     Wellness …………………………………………………………...                        12
Symptoms and Predictors
     Tobacco Use ……………………………………………………….                        14
     Substance Abuse …………………………………………………...                    14
     Adolescent Substance Use………………………………………….                 15
     Overweight and Obesity ….…………………………………..........          16
Disease / Morbidity
     Chronic Conditions ………………………………………………..                   17
     Morbidity & Mortality …………………………………………….                  19
Prioritization of Health-Related Issues
     Perceptions of Health Issues and Factors…………………………..      20
     Perceptions of Unhealthy Behaviors …………..………………….         22
     Perceptions of Personal and Community Well-being …………….   23
     Perceptions of Community Leaders ……………………………….            24
     Community Resources …………………………………………...                   25
     Summary of Community Health Issues …………………………...          25
     Prioritization ……………………………………………………...                    25
Appendices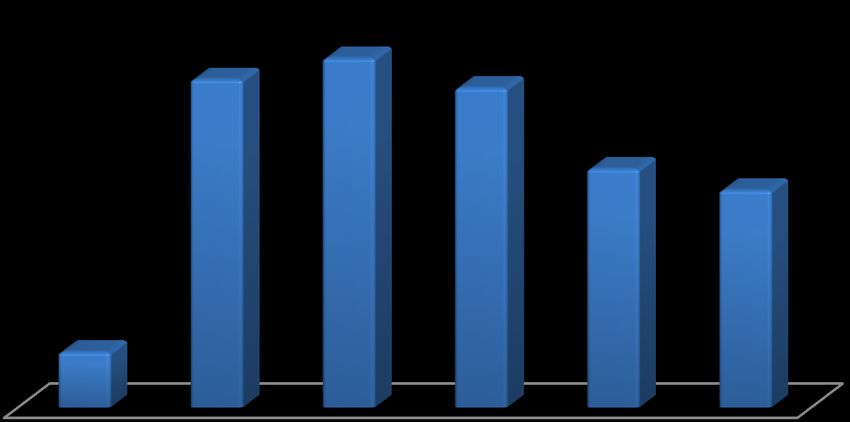
EXECUTIVE SUMMARY

Mercyhealth conducted a Community Health Needs Assessment (CHNA) in winter 2019 and spring 2020
designed to identify health and quality of life issues in the Harvard, Illinois community. This approach
identifies issues where there are opportunities for improvement in the health care delivery system, which
could improve patient care, preventive service utilization and
the overall health and quality of life in the community.                      Mercyhealth Hospital and
                                                                             Medical Center – Harvard
Results from this study can be used for strategic decision-
making purposes as they relate to the health needs of the
community and to ensure that programs and services closely
match the priorities and needs of the Harvard community.

In addition, this report has been prepared in compliance with
IRS Notice 2011-52 relating to community health needs
assessment (CHNA) required by Internal Revenue Code
Section 501-r-(3). It includes the following components:

•   Study Methodology: A detailed description as to how the
    study was conducted in order to identify key trends and
    needs in the community.

•   Community Analysis: A compilation of data from
    external sources on a wide variety of community health issues and trends.

•   Household Survey: A random survey of residents in Harvard; a link to the survey was also
    distributed by several organizations in the Harvard community.

•   Key Informant Interview: Selected community leaders in business, government, health care,
    nonprofit, and other community sectors were interviewed as to their views on the health of the
    community and how it can be improved.

•   Key Findings: A summary of the community analysis, household survey, and key informant
    interviews identifying trends and important health-related needs in the community as well as a
    prioritization of those issues.

                                                                                                        2
METHODOLOGY

Secondary Data
Mercyhealth analyzed demographic, socioeconomic and health-related data from a variety of publicly
available sources, including the Illinois Department of Public Health, the United States Census Bureau
and the Center for Disease Control’s and Prevention’s County Health Rankings. Within each section of
the report there are definitions, category importance, data and interpretations.
Primary Data Collection
In addition to secondary data sources, primary data was also collected. This section describes the
methods used to distribute, collect, verify and analyze primary survey data.
Survey Design: An initial review of publicly available health needs assessments was conducted to
evaluate and identify common themes and approaches to collecting the necessary data. Working with a
group designing a survey for another county, we adapted the survey to ensure all critical areas were being
addressed for our specific area. The survey was conducted in the 60033 area code, though individuals
working and spending recreational time in the Harvard area were also asked to participate. Versions of
both the online and paper survey were translated and distributed in Spanish. A copy of the survey is
available in APPENDIX A (English & Spanish).

To properly assess the perceived health needs of the community, the surveys included specific questions
to rate and assess:
   1.   Health issues in the community;
   2.   Unhealthy behaviors in the community;
   3.   Well-being;
   4.   Accessibility to health care; and
   5.   Healthy behaviors
Sample Size: We calculated sample size needed by using a standard formula based on the population size,
margin of error, confidence level and standard of deviation. Our calculation encompasses a 90%
confidence level, a +0.5 margin of error and a standard deviation of 0.5.
        Necessary Sample Size = (Z-score)2 X StdDev X (1-StdDev) / (margin of error)2
For this survey, the minimum sample size was 263 surveys. The data collection for this CHNA yielded a
total of 358 usable responses, exceeding the threshold of the desired 90% confidence interval.
Survey Distribution and Data Collection: Several distribution and collection techniques were used.
The primary technique was the acquisition of a mailing list and the distribution of surveys via the United
States Postal Service. The secondary technique used was creation of an online survey (English and
Spanish). The survey also included a bar-code allowing for access to the survey electronically via Survey
Monkey. A link to the survey in both Spanish and English was also included in the Mercyhealth Health
News on-line newsletter, the Mercyhealth McHenry Facebook page, and the Mercyhealth Wire. The final
distribution technique involved in-person distribution of surveys to the third grade class families of
Harvard’s Crosby Elementary School, various businesses, churches, and charitable organizations.

                                                                                                          3
DEMOGRAPHICS
Population
Population data characterize individuals residing in the Harvard community, providing an overview of
population growth trends. Population data are the foundation for analysis of data.
Total Population
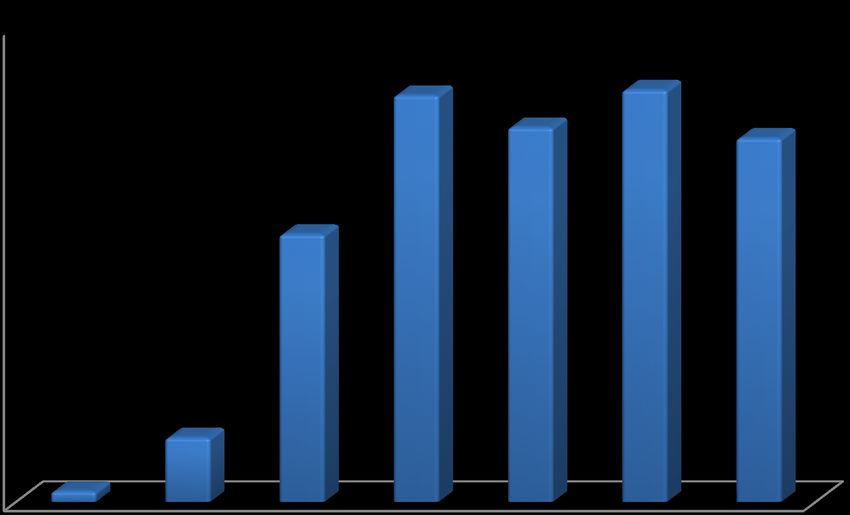
Population in Harvard increased from 2000 to 2018 by 1,134 or 14%. However, the U.S. Census data and
population estimates indicate the population of Harvard has decreased by 6.9% between 2015 and 2018.
The total population for McHenry County has remained consistent.
Population Growth - Harvard, Illinois
1990 - 2018 (Est)
2000
9,130
2010
9,802
2015 (Est)
9,447
2018 (Est)
7,996
- 2,000 4,000 6,000 8,000 10,000 12,000
Source: U.S. Census Bureau, American Community Survey, 2000 and 2010, American Fact Finder, 2015 and 2018 Estimates
Citizenship of Harvard Population
All U.S. Citizens are considered U.S. nationals; however, there are some U.S. Nationals are considered
Noncitizens. Harvard’s population consists of 18% Noncitizens and 82% citizens.
Harvard Residents -
Citizens and Noncitizens
1,640,
18%
Citizen
Noncitizen
7,652,
82%
Source: US Census Bureau, ACS, Health Insurance Status &
Type of Citizenship Status, 2018
4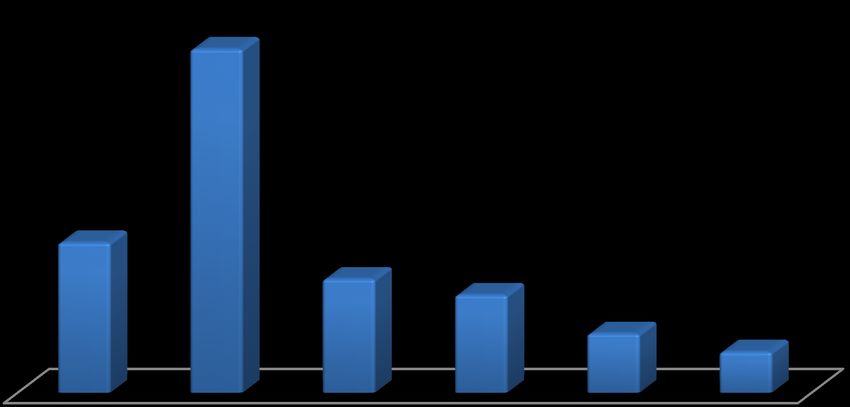
Veteran Population
The veteran population in McHenry County makes up 6.7% of the population aged 18 and older. This is
slightly higher than the Illinois state rate of 6.2% but below the U.S. national rate of 7.7%.
Approximately three-fourths of the veteran population is 55 and older and nearly three-fifths are older
than age 65.

                                      Veteran Population by Age Group
                                                Harvard, IL

                                                                             18 to 34 years
                                         12%
                               22%                                           35 to 54 years
                                                 13%
                                                                             55 to 64 years

                                               15%                           65 to 74 years
                                 38%                                         75 years and over

               Source: U.S. Census Bureau, 2017 American Community Survey (ACS), 1-Year Estimates

Disabled Population
According to Healthy People 2020, individuals with disabilities represent 18.7% (about 56.7 million
people) of the U.S. population. A diagnosis of impairment or disabling condition is capable of occurring
to any individual within the population at any point in their lives. Taking part in meaningful daily and
extracurricular activities adds growth, development, fulfillment and community contribution to the lives
of all individuals with or without disabilities. The U.S. Census Bureau estimates that the rate of disable
persons grew from 7.7% of the population in Harvard 2009 – 2013 to 9.4% in 2014 – 2018.

           40.0%
                                          % Harvard Population
                                       Estimated to have a Disability
           30.0%

           20.0%

           10.0%

             0.0%
                              Total               Under 18               18 to 64                65+
         2009-2013            7.7%                 2.6%                   6.3%                  29.1%
         2014-2018            9.4%                 3.0%                   7.1%                  32.2%

    Source: U.S. Census Bureau, ACS, Comparative Social Characteristics, 5-Year Estimates 2009-2013 and 2014-2018

                                                                                                                    5
Age, Gender and Race Distribution
Population data broken out by age, gender and race provide a foundation to analyze issues and trends
impacting demographic factors, including economic growth and the distribution of health care services.
Understanding the cultural diversity of communities is necessary when considering health care service
delivery systems and infrastructure.

Age
The graph below shows that the percentage of individuals in Harvard in the age groups Under 18 and
18-24 decreased, while the age groups of 25-44, 45-64, and 65+ increased. The median age of Harvard
residents is 30.1 years, much lower than the McHenry County median age of 39.9.

                                  Age Distribution - Harvard, Illinois
                                           2010-2017 (Est.)
                               Under 18        18 - 24       25 - 44      45 - 64         65+
   2017
                       32.8%                 10.1%              28.7%                     18.5%        10.1%
   (Est)
   2015
                         35.7%                  10.2%              28.6%                    18.0%        7.5%
   (Est)
   2010                 35.3%                  7.6%              29.6%                     19.2%         8.3%
                             Median age of Harvard residents in 2017: 30.1 years

Source: U.S. Census Bureau, American Community Survey, 2011-2017 ACS 5-year Estimates

Gender
The gender distribution of Harvard residents has remained consistent with a slight decrease in the number
of male residents and increase in the female residents when comparing 2010 to 2017.

                 Gender Distribution                                     Gender Distribution
                    Harvard, IL                                             Harvard, IL
                        2010                                                 2017 (Est)

                                      Male                                                      Male
           49%       51%                                           47%          53%
                                      Female                                                    Female

                             Source: U.S. Census Bureau, 2010 Census and 2018 Estimates

                                                                                                                6
Race & Ethnicity

Hispanic ethnicity is different than race. An individual identifying with a Hispanic/Latino ethnicity can
be White, Black, Asian, or some other combination of race categories. The Hispanic/Latino population
when viewed by racial categories is predominately White. The majority of Hispanic/Latino residents are
from Mexico (91%) followed by Puerto Rico (3%). The estimated ethnic distribution in Harvard has
changed considerably from 2010 to 2018. Hispanics/Latino ethnicity comprises approximately 49% of
the population, compared to 35% in 2010. In comparison, Harvard has a significantly larger
Hispanic/Latino population than McHenry County.

                   Race Distribution - Harvard, IL                                    Race Distribution -
                                                                                      McHenry County, IL
                                               2010    2009-2013       2014-2018        2009-2013       2014-2018
                                                           (Est.)          (Est.)           (Est.)          (Est.)
White                                        71.5%          76.0%           91.1%           91.5%           92.0%
Black or African American                      0.9%           0.1%           0.3%             1.3%           1.9%
American Indian and Alaska                     0.8%           0.0%           0.1%             0.1%           0.1%
Native
Asian                                          0.7%           0.9%           0.1%             2.6%           2.9%
Other                                        22.9%          19.0%            6.5%             2.6%           1.1%
Two or more races                              3.0%           1.7%           1.9%             1.8%           2.1%
                        Ethnicity – Harvard, IL                                          Ethnicity –
                                                                                      McHenry County, IL
Hispanic or Latino (any race)                35.2%          50.3%           49.8%           12.1%           13.4%
         Source: U.S. Census Bureau, 2010 Census, 2015 and 2019, American Community Survey 5-Yr Estimates

Economic Factors

Median income divides households into two segments, with one-half of households earning more than the
median income and the other half earning less. Median income is considered a more reliable factor than
average income because it is not significantly impacted by unusually high- or low-income values.
The definition of poverty is “lacking sufficient income to meet one’s basic needs.” Therefore, poverty is
associated with numerous chronic social, health, education, and employment conditions.

                                                                                                               7
Median Income Level
The median household income of Harvard, McHenry County and the State of Illinois residents has
increased an average of approximately 10.6% from 2010 to 2017. It is noted that Harvard’s median
household income is significantly lower than that of both McHenry County and the State of Illinois.

            $90,000                     Median Household Income
            $80,000
            $70,000
            $60,000
            $50,000
            $40,000
            $30,000
            $20,000
            $10,000
                $-
                                    2010                           2015                           2017
     Harvard                       $45,991                        $45,689                        $52,585
     McHenry County                $76,482                        $77,222                        $82,230
     Illinois                      $55,735                        $57,574                        $61,229
Source: U.S. Census Bureau, American Community Survey, Selected Economic Characteristics, 2010, 2015, and 2017

Unemployment
Harvard’s most recent unemployment rate is currently at 8.4%, compared to 3.8% for McHenry County
and 4.8% for the State of Illinois.
                16.0%                        Unemployment Rate
                14.0%
                12.0%
                10.0%
                 8.0%
                 6.0%
                 4.0%
                 2.0%
                 0.0%
                            2010          2011         2012         2013         2014         2015         2017
      Harvard               9.3%         13.5%        12.3%        13.9%        12.0%        10.7%         8.4%
      McHenry County        7.6%         8.8%         9.8%         10.3%        9.5%         8.0%          3.8%
      Illinois              8.6%         9.3%         9.9%         10.5%        10.0%        9.1%          4.8%
      U.S.                  9.6%         9.0%         8.8%         7.5%         9.2%         8.3%          4.1%

Source: U.S. Census Bureau, American Community Survey, Selected Economic Characteristics, 2010-2017

                                                                                                                  8
Families in Poverty

Poverty has a significant impact on the development of children and youth. In Harvard, the percentage of
families living in poverty between 2015 and 2017 has decreased by 14.8%. The overall poverty rate in
Harvard is 5.7% higher than the McHenry County poverty rate of 6.1%. The percentage of children in
poverty within Harvard is higher than

   30.0%
                                    Poverty Status in the Past 12 Months
   25.0%

   20.0%

   15.0%

   10.0%

     5.0%

     0.0%
                         Harvard                       McHenry County                      State of Illinois
        2010             22.7%                             6.2%                                 12.6%
        2015             26.6%                             7.9%                                 14.3%
        2019             13.2%                             5.9%                                 12.1%
Source: U.S. Census Bureau, 2013-2019, Small Area Income and Poverty Estimates (SAIPE), 2010, 2015, and 2019

               % of Children in Poverty                                   % of Children in Poverty
30.0%               under 5 Years                             25.00%            5-17 Years
            24.8%                                                        19.90%
25.0%                                                         20.00%                                           17.50%
                                               19.5%                                            15.70%
20.0%                              17.7%
                                                              15.00%
15.0%                                                                                9.70%
                                                              10.00%
10.0%                  6.9%
                                                               5.00%
 5.0%
                                                               0.00%
 0.0%
          Harvard McHenry          Illinois     U.S.                    Harvard McHenry Illinois                US
                   County                                                        County
 Source: US Census Bureau, ACS,                               Source: US Census Bureau, ACS, 2018

Source: U.S. Census Bureau's American Community Survey, Age by Ratio of Income to Poverty Level in the Past 12 Months
(Universe: Population for whom poverty status is determined), 2014 to 2018 1-Year Estimates, Table C17024

                                                                                                                        9
Education
Research suggests that the higher the level of educational attainment and the more successful one is in
school, the better one’s health will be and the greater likelihood of making healthy lifestyle choices.
Accordingly, an increase in years of education is strongly related to an individual’s propensity to earn a
higher salary, obtain better employment and foster multidimensional success in life.
Harvard has a higher rate of residents graduating high school than both McHenry County and the State of
Illinois. Conversely, Harvard has fewer residents with a college degree than both McHenry County and
the State of Illinois.
40.0% Educational Attainment (Ages 25+)
35.0%
30.0%
25.0%
20.0%
15.0%
10.0%
5.0%
0.0%
Some High High Some Graduate or
Less than Associate's Bachelor's
School, No School College, No Professional
9th Grade Degree Degree
Diploma Graduate Degree Degree
Harvard 16.0% 15.4% 35.5% 18.0% 5.1% 6.1% 3.8%
McHenry County 2.9% 4.3% 26.5% 24.2% 8.9% 22.1% 11.1%
Illinois 5.2% 6.3% 26.3% 20.9% 7.9% 20.5% 13.0%
Source: U.S. Census Bureau, American Community Survey, Educational Attainment, 2017
10PREVENTION BEHAVIORS
Accessibility
The availability of health care services is critical. As such, health care accessibility must address both the
associated financial costs and the supply and demand of medical services.
Insurance Coverage
Information gathered from the County Health Rankings and the U.S. Department of Health and Human
Services show McHenry County residents possess health care coverage at a higher rate than the national
average. The overall trend shows the uninsured rate dropping significantly from 2013 to 2017, most
likely due to the passage and implementation of the Affordable Care Act in 2010.
% of Harvard Residents -
With and Without Insurance
Harvard McHenry County Illinois US
100.0% 95.2% 93.2% 91.3%
86.2%
80.0%
60.0%
40.0%
20.0% 13.8% 8.7%
4.8% 6.8%
0.0%
With Health Insurance Without Health Insurance
Source: US Census Bureau, ACS, 2017
Insured community survey respondents indicated that 98.2% were able to see health care providers that
accept their insurance and 88.6% had seen a health care provider they consider their regular provider
within the past 12 months.
Access to Care
Harvard is unique in the fact that it is a small community, and there are a wide variety of health care
services available. According to the 2019 County Health Rankings, access to care data from 2016,
residents of McHenry County have 1 primary care physician per every 1,940 residents, 1 mental health
provider per every 570 residents, and 1 dentist per every 1,650 residents. All three ratios listed for
Harvard are higher than the state ratios. In the CHNA survey, respondents were asked a series of
questions in regard to accessing various types of health services ranging from providers that accept the
respondents’ health insurance to mental health services.
The CHNA survey respondents were asked, “Was there a time when you needed care but were not able to
get it?” Access to various types of health care was assessed, including primary care provided by a
physician (patients presented to ED or Urgent Care instead), dental care, mental health services, drug and
alcohol treatment and medications.
11Unable to Access Care
40.0% 37.9%
35.0%
30.0%
25.0%
20.0%
14.5%
15.0% 12.0% 12.1% 12.1%
10.0%
5.0% 2.0%
0.0%
Physician Medical Care Dentist Mental Health Alcohol/ Drug Medications
Treatment
Source: 2020 Harvard CHNA Survey
Medical Care
Respondents selected “can’t afford to pay for a doctor’s visit” and “feel like I don’t need one” as the top
reasons they don’t have a primary physician or seek medical care. When asked why they don’t have
health insurance, “too expensive” and “not qualified for medical assistance” were listed as the primary
reasons. Access to health care is greatly diminished when residents are uninsured and lack a primary care
provider.
Dental Care
Respondents selected “can’t afford to pay for a dental visit” and “feel like I don’t need one” as primary
reasons they don’t have a regular dental provider. When asked why they don’t have dental insurance,
“too expensive” and “feel like you don’t need dental insurance” were selected as the primary reasons.
Mental Health
14.5% of respondents reported that in the past 12 months, they or someone in their household needed to
see a mental health professional but could not.
Alcohol/Drug Treatment
2.0% of respondents reported that in the past 12 months, they or someone in their household needed drug
or alcohol treatment but could not access it.
Medications
12.1% of respondents reported that in the past 12 months, they or someone in their household needed
medications but could not get them. The primary reason selected was “too expensive” and the secondary
reason was the “specific medication I needed was not available.”
Wellness
Preventative health care measures, including a routine well-visit, obtaining a flu shot, living a healthy
lifestyle and getting screenings for diseases are essential to fighting morbidity and mortality while
reducing health care costs.
12Frequency of Checkups
The Centers for Disease Control and Prevention reports that regular health exams and tests can help find
problems before they start. These checkups can also help identify problems early, when chances for
treatment and cure are better. By getting the appropriate health services, screenings, and treatments,
individuals are taking steps to improve their chances for living a longer, healthier life. The Illinois
Behavioral Risk Factor Surveillance System’s (IBRFSS) 2017 data shows that an average of 70% of
Collar County residents - which includes northern Illinois residents from five counties DuPage, Kane,
Lake, McHenry, and Will - had a checkup within the past 12 months, which is consistent with the State of
Illinois’s health care utilization rate of 70%. No recent information was available for Harvard.
Regular Health Care Provider
Research suggests that individuals with a regular or established health care provider are more likely to
seek preventive care and less likely to use emergency services for care. This saves both resources and
funds in the health care system overall. In 2017, 82.6% of Collar County residents had a regular health
care provider, compared to 81.9% for the State of Illinois (IBRFSS, 2017). No recent information was
available for Harvard.
Immunizations
Preventive measures, including immunizations and vaccinations, greatly impact the overall health and
well-being of a community. Data available from the 2017 IBRFSS shows that 38.3% of Collar County
residents received a flu shot within the past 12 months, compared to 37.5% at the State level, and 38.7%
had received a pneumonia vaccination, compared to 38.1% for the State of Illinois. No recent information
was available for Harvard.
Immunizations are a critical step in protecting those that are most vulnerable to illness – infants and
young children, the elderly, and those with chronic conditions and weakened immune systems (CDC,
2019). The Illinois State Board of Education reports the protection rate averages for the Harvard
Community School District are overall above 98.1%.
Harvard Immunization Status of School-Age Children
2018-2019
Immunization Average % Rate of Immunization
Protection
Polio 99.1%
Invasive Meningococcal Disease 98.5%
Varicella/Chickenpox 99.1%
Invasive Pneumococcal Disease 98.7%
Haemophilus Influenza Type B (Hib) 98.7%
Hepatitis B 99.4%
Measles, Mumps & Rubella 98.8%
Tetanus, Diphtheria and Acellular Pertussis 98.9%
(TDAP)
Diphtheria, Pertussis, Tetanus (DTP/DTaP/Td) 98.1%
Source: Illinois State Board of Education, School Year Immunization Status
13SYMPTOMS AND PREDICTORS
Tobacco Use
An analysis of the leading indicators regarding morbidity and mortality must be conducted in order to
properly allocate health care resources. This allows health care organizations to more effectively target
affected populations. Research suggests tobacco use causes a wide variety of adverse medical conditions.
In 2016, the County Health Rankings reported 15% of adults (18+) in McHenry County use tobacco
products. This is lower than the Illinois and United States rates; however, all of the rates are higher than
the Healthy People 2020 goal of 12%. No recent information was available for Harvard.
% of Adults Smoking Cigarettes
McHenry County, IL Illinois United States
19.0%
17.8%
18.0%
17.0%
16.1%
16.0%
15.0%
15.0%
14.0%
13.0%
McHenry County, IL Illinois United States
Source: Centers for Disease Control and Prevention; County Health Rankings 2016
According to the CDC, smoking remains the leading cause of preventable death and leads to disease,
disability and harms nearly every organ of the body. Tobacco use continues to decline in the US, but
remains high in certain populations. Those at risk for increased exposure to and use of tobacco are those
with low levels of education, males, young adults, those living in the South and Midwest, LGBT
individuals, individuals living below the poverty level, disabled people and certain races and ethnicities.
Substance Abuse
Excessive alcohol use impairs decision-making, often leading to adverse consequences and outcomes.
Excessive alcohol use/binge drinking directly contributes to a number of short- and long-term health risks.
Short-term health risks include injuries such as automobile accidents, falls and other avoidable bodily
injuries. Violence and risky sexual behaviors are also short-term health risks associated with binge
drinking. Long-term health risks include cancers, heart disease, high blood pressure, mental health
problems, social problems and alcoholism (CDC, 2017).
A 2016 CDC study shows 23% of adults in McHenry County report binge drinking and heavy alcohol
consumption, higher than both the state of Illinois rate (21%) and national rate (17%). No recent
information was available for Harvard.
14Adult Tobacco Use and Binge Drinking
23%
25% 21%
17% 18%
20% 16%
15% Tobacco
Use
15%
10% Excessive
Alcohol
Consumption
5%
0%
McHenry County Illinois National
Source: Centers for Disease Control and Prevention; County Health Rankings 2016
Adolescent Substance Use
Substance use in young people may impact their academic achievements, which lead to employment
challenges and also places them at risk for developing substance disorders and other related health
consequences.
The 2018 Illinois Youth Survey reports show that 29% of the 10th and 12th grade students surveyed in
Illinois admitted to participating in a binge drinking session (5 or more drinks of alcohol at one occasion)
in the past 2 weeks. McHenry County students reported a slightly lower percentage rate of 27%, for 10th
and 12th grade students participating in binge drinking within the last 2 weeks. However, the reported use
of alcohol and any tobacco or vaping products in the past year for 10th and 12th grade students was higher
in McHenry County than the rates reported for the overall state of Illinois. No recent information was
available for Harvard.
McHenry County
70% Substances Used by Grade in the Last 12 Months
60%
50%
40%
30%
20%
10%
0%
Any
Any other
Tobacco
Alcohol Cigarettes Inhalants Marijuana Illicit
or Vaping
Drugs
Products
10th Grade 42% 26% 4% 2% 20% 3%
12th Grade 59% 38% 8% 2% 33% 6%
Source: Illinois Youth Survey (2018) by Illinois Center for Prevention Research &
Development and Illinois Department of Human Services, McHenry County
15Overweight and Obesity
Nationally, obesity is a significant problem. Overweight and obese individuals have a greater risk and
occurrence of health issues due to the increased stress on their bodies caused by excess weight.
Medical costs to treat weight related health issues are staggering and put a financial crunch on state and
federal health care monies.
According to a 2018 study by the State of Obesity Project, Illinois now has the 24th highest adult obesity
rate in the United States. McHenry county ranks lower in the percentage of overweight and obese people
in both the state of Illinois and the nation. In McHenry County, the percentage of obese adults between
2014 and 2016 increased by 4.0%. The McHenry County percentage of obese adults is 3.6% higher than
the percentage of obese adults in Illinois, which is 29.0%.
% Adults Obese (BMI >30.0) by Year,
35.0% 2004 - 2016 32.6%
30.0% 29.0%
23.9% 28.3%
25.0%
20.0%
2004 2005 2006 2007 2008 2009 2010 2011 2012 2013 2014 2015 2016
McHenry County Illinois United States
Source: Centers for Disease Control and Prevention, National Center for Chronic Disease Prevention and Health Promotion.
2016.
16SYMPTOMS AND PREDICTORS
DISEASES/MORBIDITY
Chronic Conditions
Chronic diseases such as heart disease, cancer, and diabetes are the leading causes of death and disability
in the United States, which are also leading drivers of the nation’s $3.5 trillion in annual health care costs.
Lack of adequate health care for these conditions can lead to recurrent hospital and physician visits, an
increase in overall health issues and an increase in health care costs.
Heart Disease
Heart disease is the leading cause of death in the United States, causing about 1 in 4 deaths (CDC, 2019).
Hypertension (high blood pressure), high cholesterol and smoking are considered major risk factors for
developing heart disease. Additionally, there are numerous additional health conditions that occur as a
consequence of cardiovascular disease, atherosclerosis, cardiac arrhythmia, myocardial infarction, stroke,
carotid artery disease and renal dysfunction or failure.
McHenry County percentage rates of Medicare Beneficiaries with High Blood Pressure and High
Cholesterol remain slightly below the state and county rates.
Source: Centers for Medicare and Medicaid Services, 2017
Cancer
Cancer is the second leading cause of death in the U.S., only exceeded by heart disease. There are
numerous types of cancer, each having their own symptoms, cure rates and methods for treatment.
Cancer Incidence Rates – McHenry County
Males Females
Type Cases Rate* Type Cases Rate*
Prostate 869 101.8 Breast (invasive) 1233 137.2
Lung & Bronchus 450 63.1 Lung & Bronchus 509 59.3
Colon & Rectum 353 47.2 Uterus 280 29.1
Bladder 269 39.1 Colon & Rectum 311 35.4
Kidney & Renal Pelvis 179 21.7 Kidney & Renal Pelvis 104 11.9
All Cancers Combined 3,671 478.7 All Cancers Combined 3,890 444.5
*Age adjusted incidence rate per 100,000 population
Source: Illinois Department of Public Health, Illinois Cancer Registry, 2012-2016
17Diabetes
In a study published in December 2019, JAMA Network, CDC researchers examined the percentage of
people living with diagnosed and undiagnosed diabetes in Hispanic and non-Hispanic Asian
subpopulations. The study results show the percentage of adults living with diagnosed or undiagnosed
diabetes in the U.S. is 22% in Hispanics, 20% in non-Hispanic blacks, 19% for non-Hispanic Asians and
12% for non-Hispanic whites. This study is significant based on the U.S. progressively becoming a more
diverse nation, as Hispanics and non-Hispanic Asians collectively now account for 23% of the U.S.
population and are expected to account for 38% by 2060, according to Census data.
From 2012 through 2015, the McHenry County percentage rate of adults with diabetes diagnosis
remained slightly above the state and national rates. However, in 2016 McHenry County’s rate of 10.1%
decreased slightly below the state rate of 10.4%, but remains above the U.S. rate of 9.4%.
Adults 18+ Diagnosed with Diabetes
11
Crude Rate Percentage
10.5
10
9.5
9
8.5
8
2012 2013 2014 2015 2016
United States 9.1 9.3 9.1 9.6 9.4
Illinois 9.4 9.8 10.1 9.9 10.4
McHenry County 9.5 10.1 10.5 10.3 10.1
Note: Crude Rate = Count / Population * 100,000
Source: United States Diabetes Surveillance System, Division of Diabetes Translation, CDC, 2012-2016
18Morbidity & Mortality
The morbidity and mortality measures describe the progression and severity of a given health event and
provide useful data to learn about risk factors of diseases. The leading causes of death in the McHenry
County Community include cancer, heart disease and accidents.
Leading Causes of Death
McHenry County in 2017
Cause Crude Rate
Cancer 147.4
Heart Disease 156.2
Accidents 59.8
Stroke 36.2
Chronic Lower Respiratory Diseases 34.9
Diabetes Mellitus 24.6
Alzheimer's Disease 23.9
Kidney Disease 12.3
Intentional Self-Harm 12.3
Sepsis 11.6
Note: Crude Rate = Count / Population * 100,000
Source: Illinois Department of Public Health (IDPH), Leading Cause of Death for McHenry in 2017
19PRIORITIZATION OF HEALTH-RELATED ISSUES
The CHNA is an in-depth study of the community that will allow us to identify the most critical health
needs that specifically impact the Harvard community. To fully explore those needs, we collect and
consider community perceptions of health issues, unhealthy behaviors and issues related to well-being.
By combining community perception with the data outlined previously within this assessment, and taking
community resources into account, we can strategically plan and prioritize the most vital health concerns
in the community.
Perceptions of Community Health Issues and Factors
Survey participants were asked to rate the overall health of the Harvard community. Based on survey
responses, 54.8% rated Harvard as “somewhat healthy,” while 28.8% rated Harvard as “healthy.”
Harvard Community Health Rankings
54.8%
28.8%
5.5% 9.5%
1.4%
Very healthy Healthy Somewhat Unhealthy Very
healthy unhealthy
Source: 2020 Harvard CHNA Survey Response Data
The CHNA also asked survey participants, “What do you think are the five factors that make a healthy
community?” Access to health care was the primary answer chosen by 14.9% of respondents.
Low crime/safe neighborhoods, good jobs and a healthy economy, good schools, and good place to raise
children followed closely.
What Makes Harvard a Healthy Community
Top 5 Factors
8.6% Access to health care
14.9% Low crime/safe neighborhoods
8.6%
Good jobs and a healthy economy
12.6% Good schools
9.5%
Good place to raise children
Source: 2020 Harvard CHNA Survey Response Data
20Community perceptions of health problems may vary from the actual health issues in the area.
The CHNA survey asked participants to choose the top five health problems in their community based on
a list of 23 options. Participants ranked obesity as the top health problem with drug and alcohol abuse
directly following.
Top 5 Harvard Community Health Problems
Obesity 15.7%
Drug Abuse 10.6%
Alcohol Abuse 8.8%
Mental Health 7.6%
Diabetes 7.2%
Source: 2020 Harvard CHNA Survey Response Data
Cancer was ranked 7th and high blood pressure and heart disease/stroke were ranked 8th and 10th by
survey respondents. However, these risk factors contribute to the top three leading causes of death in
McHenry County (Morbidity & Mortality Chart, page 18).
Perception of Health Issues - Harvard, IL 2020
Obesity
Drug abuse
Alcohol abuse
Mental health
Diabetes
Substance abuse disorders
Cancers
High blood pressure
Aging problems
Heart disease and stroke
Domestic violence
Teen pregnancy
Dental problems
Dementia
Violence
Suicide
Lung disease
Sexually transmitted diseases
Rape/sexual assault
Gun injuries
HIV/AIDS
Infant death
0% 5% 10% 15% 20%
Source: 2020 Harvard CHNA Survey Response Data
21Perceptions of Unhealthy Behaviors
Respondents were asked to choose the top five most concerning risky behaviors in Harvard. They were
given a list with eighteen choices. Alcohol abuse was ranked number one, closely followed by drug
abuse. Drunk driving, poor eating habits and lack of exercise rounded out the bottom three with very
close numbers. These responses directly tie into the responses received for the perception of the top five
community health problems.
Top 5 Unhealthy Behaviors
Alcohol Abuse 13.7%
Drug Abuse 12.7%
Poor Eating Habits 10.9%
Lack of Exercise 10.1%
Not Receiving Medical Care 9.1%
Source: 2020 Harvard CHNA Survey
Unhealthy Behavior Rankings
Alcohol abuse
Drug abuse
Poor eating habits
Lack of exercise
Not receiving medical care
Drunk Driving
Tobacco use
Dropping out of school
Racism
Not seeking preventive dental care
Not getting “shots” to prevent disease
Unsafe sex
Not using seat belts or child safety seats
Not seeking prenatal care
Unlocked guns
Not using bike helmets
Homicide
0% 2% 4% 6% 8% 10% 12% 14% 16%
Source: 2020 Harvard CHNA Survey Response Data
22Perceptions of Personal and Community Well-Being
Residing in a safe community with adequate housing, food and health care resources plays a large role in
personal and community well-being. Survey participants were asked questions regarding their
perceptions of personal health, household concerns and community environment.
Participants were asked, “How would you rate your own personal health?” Over half of the survey
participants chose “healthy,” while more than 30% chose “somewhat healthy.”
Havard Community
52.1% Personal Health Rankings
31.4%
12.5%
3.7% 0.3%
Very healthy Healthy Somewhat Unhealthy Very
healthy unhealthy
Source: 2020 Harvard CHNA Survey Response Data
Participants were asked about household health problems or concerns. Participants ranked
exercising/fitness as the top household health concern with eating well/nutrition and managing weight
directly following.
Top 5 Household Health Concerns
Exercising/fitness 12.4%
Eating well/nutrition 11.5%
Managing weight 10.5%
Stress management 8.7%
Access to safe, affordable places to exercise 7.5%
Source: 2020 Harvard CHNA Survey
23The health of the environment directly impacts the health and well-being of the community.
Survey respondents were asked to choose their top five concerning environmental issues from a list of 22
options. Lack of sidewalks/walking paths ranked number one.
Top 5 Harvard Community Environmental Concerns
Lack of bike lanes/bike paths 7.2%
Mosquito/tick carried diseases 7.4%
Unsafe neighborhoods/crime 8.0%
Trash or litter in public areas 8.2%
Lack of sidewalks/walking paths 12.2%
0.0% 2.0% 4.0% 6.0% 8.0% 10.0% 12.0% 14.0%
Source: 2020 Harvard CHNA Survey
Community Leader Health Perceptions
A key informant survey was conducted among leaders in the Harvard community. Eighteen stakeholders
were contacted ranging from school leaders, business owners, religious leaders, city officials, community
program leaders to police and fire officials. Nine leaders agreed to participate in our survey. The purpose
of surveying this specific group of individuals was to gather insight from those members of the
community that are directly involved in the care and well-being of the community and its residents.
Key informants were asked several subjective questions. Answers varied based on the participant’s
occupation/role in the community. Though there were large variances in answers, four barriers emerged
repeatedly among respondent responses, which include access to transportation, lack of employment
opportunities, low income and language barriers.
When asked to rate the overall health and quality of life in Harvard over the past three years, over two-
thirds of respondents agree that the health and quality of life has stayed the same or improved, which they
attributed to the critical access hospital and new initiatives made by the new mayor and other new
community leaders within the school district.
Health & Quality of Life
Over the Past 3 Years
22% 22% Improved
Stayed the Same
Declined
56%
Source: 2020 Harvard CHNA Key Informant Survey
24Community Resources
Several respondents shared their appreciation for the health care services made available to the Harvard
Community through Mercyhealth Hospital and Medical Center – Harvard and clinics. CHNA key
informant survey participants were also asked their opinion about the most critical health and quality of
life issues within the community. Community leaders shared their opinions of what critical health issues
the community has experienced and desired health care services that would improve the health and quality
of life in Harvard. Women’s health care services, urgent care, mental health, and drug and substance
abuse treatment were the top critical health care needs and services mentioned.
Desired Health care Services in Harvard
Dental Services 6%
Mental Health 12%
Urgent Care 18%
Veteran Healthcare 6%
Cancer Treatment 6%
Drug and Substance Abuse 18%
Woman's Health/Maternity 24%
Senior Care 12%
Source: 2020 Harvard CHNA Key Informant Survey
Summary of Key Findings - Community Health Issues
A thorough analysis of the data in this document was used to identify the most important health-related
issues in the community.
§ Poverty and unemployment rates in Harvard continue to exceed the county and state averages.
§ Education achievement greater than high school for Harvard residents is below county and state rates.
§ The median household income of Harvard residents is lower than both the county and state.
§ Nearly half of the Harvard population identifies as Hispanic or Latino.
§ The portion of McHenry County residents with diabetes is greater than the state and national rates.
§ Compared to state and national average, McHenry County has a higher rate of obesity.
§ Excessive alcohol consumption by McHenry County residents is higher than state and national rates.
§ Obesity, physical activity and access to safe exercise locations are concerns for residents of Harvard.
Prioritization
Mercyhealth reviewed and prioritized the health needs of the Harvard community. They are as follows:
1. Prevention and General Wellness (i.e. Obesity, Diabetes, Heart Disease, & Stroke)
2. Physical Activity & Nutrition
3. Senior Care and Services
4. Poverty
5. Mental Health
6. Alcohol & Drugs
25APPENDIX A
2627
28
29
30
31
32
33
APPENDIX B

             34
35
36
37
38
39
40
41
42
APPENDIX C

                 Characteristics of Survey Respondents

                   Survey Respondent Age
                          23.2%
                21.8%                21.2%

                                                  15.8%
                                                              14.4%

 3.7%

18-24       25-39        40-54      55-64        65-74       75 or
                                                             older
                                        Source: 2020 Harvard CHNA Survey

                        Survey Respondent Gender
         0.3%
                        0.3%
          0.0%           0.3%                Male

                                             Female
                         19.9%
                                             Trans Male

                                             Trans Female

                                             Gender Nonconforming

        79.3%                                No Response

                                            Source: 2020 Havard CHNA Survey

                                                                              43
Survey Respondent Race/Ethnicity
0.6% 0.8%
3.1% White (Non-Hispanic)
5.9% 0.8%
Hispanic/Latino
American Indian/Alaska Native
Black/African American
Asian
Two or more races
88.8%
Source: 2020 Harvard CHNA Survey
Survey Respondent Education
25%
21% 22%
20% 19%
20%
14%
15%
10%
3%
5%
1%
0%
Less than Some High High Some Associate's Bachelor's Graduate
High School School College Degree Degree Degree
School
Source: 2020 Harvard CHNA Survey
44Survey Respondent Household (HH) Size
43%
19%
14%
12%
7%
5%
People in People in People in People in People in People in
HH-1 HH-2 HH-3 HH-4 HH-5 HH-6 or
more
Source: 2020 Harvard CHNA Survey
Survey
Survey Respondents Household Income
19.8%
18.5% 18.8%
15.4%
10.5% 10.8%
6.2%
Under $15,000 - $25,000 - $45,000 - $65,000 - $95,000 - Over
$14,999 $24,999 $44,999 $64,999 $94,999 $134,999 $135,000
Source: 2020 Harvard CHNA Survey
45APPENDIX D
McHenry County Community Health Resources
Facility Name Type of Service City
Inpatient
Mercyhealth Hospital and Medical
Center Critical access and stroke hospital Harvard
Mercyhealth Care Center Inpatient rehabilitation Harvard
Northwestern Medicine
Woodstock Hospital Full-service hospital Woodstock
Outpatient
Family medicine; pediatrics; diabetes
center; occupational health and wellness;
Mercyhealth Harvard South and gastroenterology Harvard
Cardiology; gastroenterology;
general surgery; pulmonology; sleep
medicine, urology, ophthalmology; heart
Mercyhealth Hospital Clinic and vascular; podiatry Harvard
Diabetes self-management and education
Mercyhealth Diabetes Center programs Harvard, Woodstock
Physical therapy; occupational
Mercyhealth Rehabilitation Center therapy Harvard
Sleep testing; sleep apnea treatment;
Mercyhealth Sleep Center sleep disorders Harvard and Walworth
Mercyhealth Pain Center Pain management Harvard
Harvard, McHenry, and
Mercyhealth Eye Center Vision services Woodstock
Echocardiography laboratory, a nuclear
medicine laboratory, a stress laboratory,
Mercyhealth Heart and Vascular halter monitoring and an event analysis Harvard, McHenry, and
Center system Woodstock
Mercyhealth at Home/Home Home health, medical equipment &
Medical Equipment and Supplies supplies Harvard
Mercyhealth Cardiac and
Pulmonology Rehabilitation Physical therapy Harvard
Wound care and dressing changes;
IV therapy; medication administration;
transfusion services; catheter care;
Mercyhealth Harvard Treatment port care; PICC line care; phlebotomy;
Coordination Center caregiver and patient education Harvard
Internal, family, pediatrics, and sleep
Mercyhealth Algonquin medicine; pulmonology; lab Algonquin
Mercyhealth Crystal Lake
Chiropractic Chiropractic; massage therapy Crystal Lake
Audiology; allergy/immunology;
diabetes care; family medicine; lab;
otolaryngology; pediatrics;
Mercyhealth Crystal Lake East pulmonology; weight management Crystal Lake
Family medicine; gastroenterology; lab;
OB/GYN; orthopedic surgery;
Mercyhealth Crystal Lake South pediatrics; podiatry; radiology Crystal Lake
46Mercyhealth Crystal Lake
OB/GYN OB/GYN Crystal Lake
Mercyhealth Northwest Women's
Group OB/GYN; women's health services Lake in the Hills
Mercyhealth Richmond Family medicine; senior care; lab Richmond
Cardiology; dermatology; family
medicine; gastroenterology; general
surgery; OB/GYN; hand surgery,
imaging services; internal medicine; lab;
massage therapy; neurology; nutrition;
occupational health & medicine;
occupational therapy; orthopedic
surgery; pediatrics; physical therapy;
plastic & cosmetic surgery; radiology;
podiatry; pulmonology; rheumatology;
Mercyhealth Woodstock weight management; pharmacy Woodstock
Mercyhealth Memory Center Memory loss services Woodstock
Mercyhealth Orthotics and
Prosthetics Center Orthotics & prosthetic services Woodstock
Internal medicine; family practice;
cardiology; psychology; chiropractic;
Northwestern Physician Care endocrinology; OB/GYN Woodstock
Algonquin; Fox Lake;
Northwestern Physician Care Family practice Spring Grove
Northwestern Aesthetic Plastic &
Reconstructive Surgery Institute Plastic & Reconstructive Surgery Crystal Lake
Northwestern - Orthopedics Orthopedics; imaging Crystal Lake
Internal medicine; pediatrics; OB;
endocrinology; psychology;
rheumatology; psychiatry; occupational
Northwestern Physician Care health Crystal Lake
Northwestern Physician Care -
Surgical Associates Surgery Crystal Lake
Northwestern Physician Care -
Gavers Cardiology; surgery Crystal Lake
Northwestern Physician Care Internal medicine; psychology Crystal Lake
Northwestern Physician Care Neurology Crystal Lake
Northwestern - Medical Office Family practice; internal medicine;
Building 1 neurology; OB; pediatrics; psychology Huntley
Northwestern - Medical Office
Building 2 Endocrinology; rheumatology Huntley
Northwestern Back and Spine Back; spine Huntley and McHenry
Northwestern Physician Care Cardiology; chiropractic; orthopedics Huntley
Northwestern Heart Failure Clinic Heart failure Huntley
Internal medicine; psychology;
Northwestern Physician Care hospitalist; pediatrics; OB; cardiology McHenry
Northwestern Health Center Medical imaging McHenry
Northwestern Rehabilitation &
Sports Medicine Clinic Rehab; sports medicine McHenry
47Urgent/Immediate Care
Mercyhealth Urgent Care Urgent Care McHenry; Woodstock
Advocate Clinic at Walgreens Immediate Care Crystal Lake
McHenry; Crystal Lake;
Northwestern Health Center Immediate Care Huntley
Mental Health/Alcohol &
Substance Abuse
Community Health Partnership Mental health counseling Harvard
Pioneer Center for Human Community based human services
Services including residential behavioral health McHenry County
Transformation Behavioral Health Counseling; therapy Woodstock
Counseling; therapy; psychological
Proactive Behavioral Services services Algonquin
Counseling; therapy; psychological
Family Alliance, Inc. services Woodstock; Huntley
Northwestern Medicine Behavioral
Health Services and Crisis Counseling; therapy; psychological Crystal Lake; Huntley;
Services services; substance abuse treatment Woodstock
Centegra Outpatient Behavioral Counseling; therapy; psychological
Health services; substance abuse treatment Woodstock
Counseling; therapy; psychological
LodeStone Center services Woodstock and McHenry
Counseling; therapy; psychological
The Mathers Clinic services; substance abuse treatment Crystal Lake; Woodstock
Counseling; therapy; psychological
Horizons Behavioral Health services Crystal Lake
Counseling; therapy; psychological
Professional Consultants, Inc. services Crystal Lake
Counseling; therapy; psychological
Caryil Counseling services Cary
NewLife Counseling Center Counseling; therapy Crystal Lake
Woodstock Community Health
Center Psychiatry Woodstock
Counseling; therapy; psychological Lake in the Hills;
Portrait Health Centers services; substance abuse treatment McHenry
The Tabor Therapy Group, Inc. Counseling; therapy McHenry
Counseling; therapy; psychological
Rosecrance services; substance abuse treatment McHenry and Crystal Lake
Innovative Psychology Counseling Counseling; therapy; psychological
Services, Inc. services McHenry
Western Lake Counseling Counseling; substance abuse treatment Fox Lake
Counseling; therapy; psychological
Cherry Hill services; substance abuse treatment McHenry
NextStep Intensive Outpatient
Program Substance abuse treatment Crystal Lake
Mental health and substance abuse
McHenry VA Outpatient Clinic treatment McHenry
48Senior Services
Long-term skilled nursing care;
Mercyhealth Harvard Care Center respite care, rehabilitation Harvard
Programs, services and social
Harvard Community Senior Center activities for seniors Harvard
Shepherd Premier Senior Living of
Harvard Retirement home Harvard
Sunset Senior Apartments Independent Senior Living Harvard
Sunrise Assisted living Crystal Lake
Long-term skilled nursing care;
Valley Hi Nursing Home respite care Woodstock
Long-term skilled nursing care;
Crossroads Care Center respite care, rehab Woodstock
Long-term skilled nursing care;
Alden Terrace respite care, rehab McHenry
Fox Point Assisted living; independent living McHenry
Long-term skilled nursing care;
Fox Point Manor respite care McHenry
Crystal Pines Rehabilitation & Long-term skilled nursing care;
Health Care Center respite care, rehab Crystal Lake
Long-term skilled nursing care;
Hearthstone Communities and respite care, rehab; assisted living;
Manor independent living Woodstock
Bickford Assisted living Crystal Lake
McHenry Villa Assisted living McHenry
Heritage Woods Assisted living McHenry
The Springs Rehabilitation Center Crystal Lake
Long-term skilled nursing care;
Florence Nursing Home respite care Marengo
Heritage Woods Assisted living Huntley
Eastgate Manor Assisted living Algonquin
Three Oaks Assisted living Cary
Programs, services and social
Senior Services Associates activities for seniors Crystal Lake; McHenry
Crystal Lake; McHenry;
Programs, services and social Huntley;
Senior Care Volunteer Network activities for seniors Marengo
49You can also read