The Impact of Changing Workforce Models on Access to Oral Health Care Services
←
→
Page content transcription
If your browser does not render page correctly, please read the page content below
The Impact of Changing
Workforce Models on Access to
Oral Health Care Services
Presented by: Margaret Langelier, MSHSA
             Oral Health Workforce Research Center
             Center for Health Workforce Studies
             School of Public Health | University at Albany, SUNY

October 23, 2018
Harvard School of Dental Medicine, Boston, MA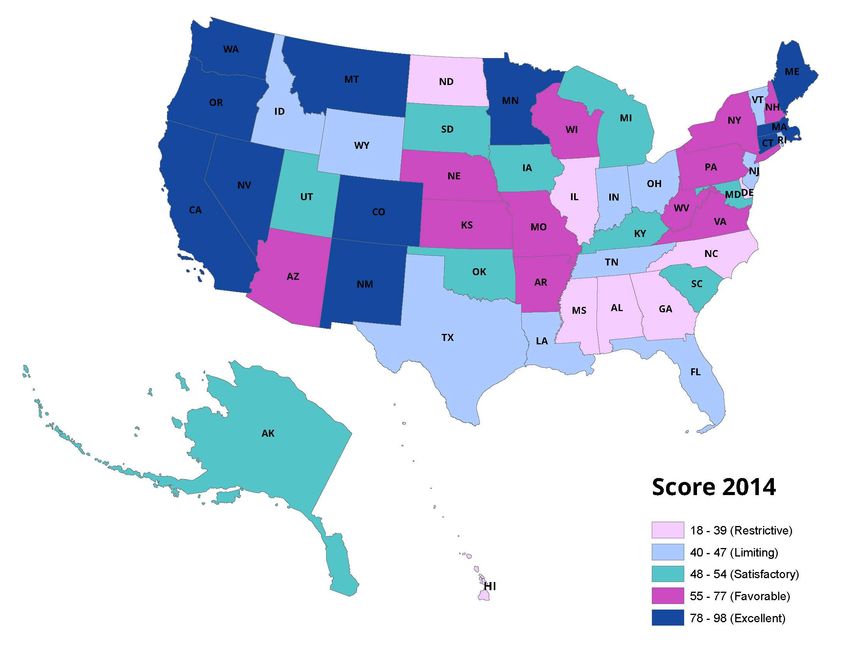
The Oral Health Workforce Research
                Center at CHWS
• The Center for Health Workforce Studies (CHWS) has more than
  20 years’ experience studying all aspects of the health workforce:
      o Established in 1996, based at the University at Albany School of
        Public Health
      o Committed to collecting and analyzing data to understand
        workforce dynamics and trends
      o Goal to inform public policies, the health and education sectors,
        and the public
      o Broad array of funders in support of health workforce research
• Oral Health Workforce Research Center (OHWRC) based at CHWS
  is funded under a cooperative agreement with the US Health
  Resources and Services Administration (HRSA)
      o Partnership with the Healthforce Center at University of
        California San Francisco
oralhealthworkforce.org              2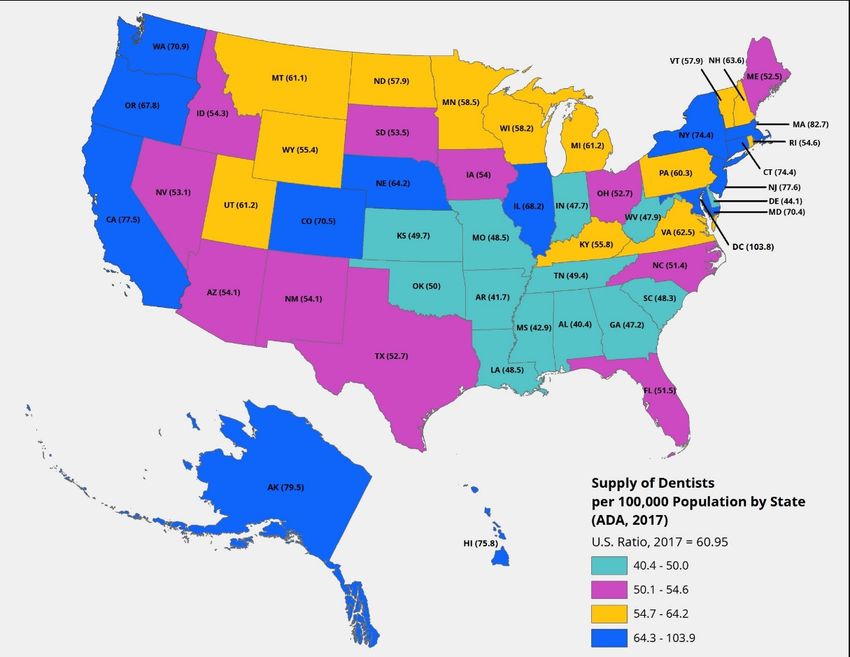
The OHWRC is Engaged with Diverse
                  Research Topics
   The Pipeline
          o Racial/ethnic diversity of the dental workforce (primary survey data/ completed)
          o Evolving pipeline of Hispanic dentists (primary survey data/completed)
          o Gender diversity of the dental workforce (secondary data/in process)
          o Dental faculty (secondary data/completed)
          o Residency programs and impacts on choice of practice setting (primary survey data/ in
            process)
          o FQHC engagement with dental student externships and dental residency programs
            (primary survey data/ completed)
          o Integration of curriculum about substance use disorders and mental/behavioral health
            in dental schools (underway)

   Workforce and System Innovation
          o The dental assisting workforce (secondary data/completed)
          o Dental hygiene scope of practice (secondary data/3 studies completed)
          o Determinants of oral health screening and assessment in PA clinical practice (primary
            survey data/completed)
          o Mobile and portable dentistry (case studies/completed)
          o Opioid prescribing by dentists in Oregon and New York (underway)
          o Teledentistry (case studies/completed)
oralhealthworkforce.org                              3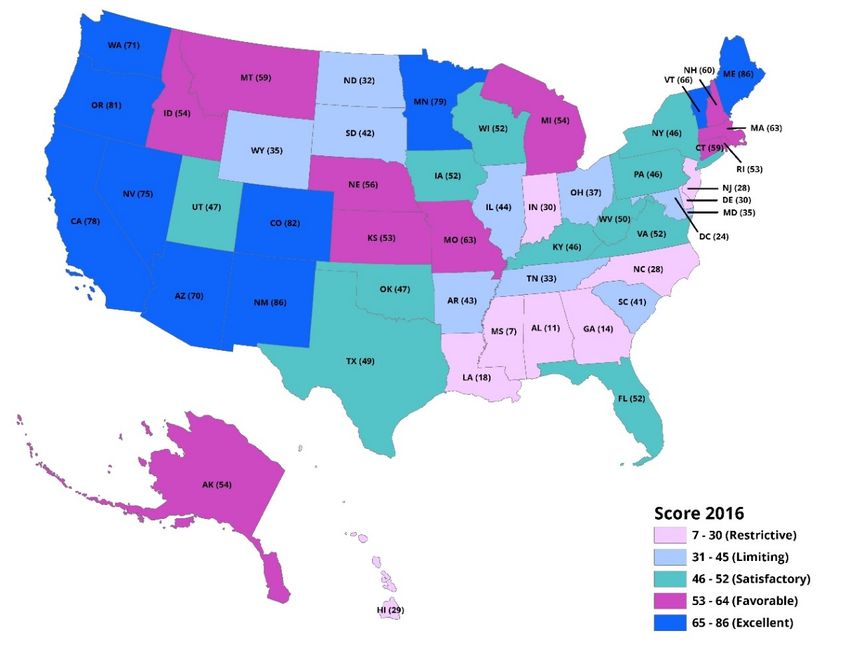
Topics (cont.)
  Workforce and System Innovation
         o Integration of primary care and oral health in FQHCS (case studies/
           completed)
         o Trends in the provision of oral health services in FQHCs (secondary survey
           data/completed)
         o Trends in the development of Dental Service Organizations (primary
           survey data and case studies/completed)
         o Integration of behavioral and oral health services in primary care clinics
           (case studies/in process)
         o Evolving models for dental services in long term care settings (case
           studies/completed)
  Patients
         o Consumer survey (primary survey data/in process)
         o Variation in utilization of oral health services by patients insured by
           Medicaid in two states (primary claims data/completed)
         o Consumer survey of parents about service access for children (underway)

oralhealthworkforce.org                       4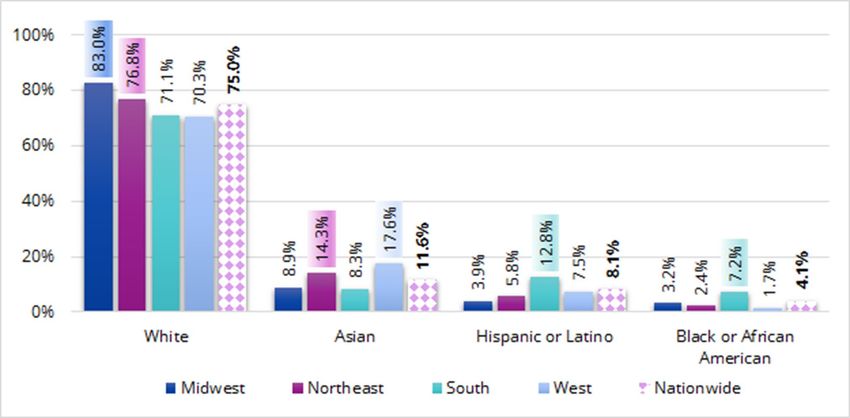
The OHWRC and CHWS Have Partnered with Numerous
   Stakeholders to Better Understand Barriers and
      Facilitators to Oral Health Service Access
  • Both prior and subsequent to the            • Under the cooperative agreement, the
    cooperative agreement with HRSA,              OHWRC has worked with still other
    CHWS has partnered with and/or been           groups to achieve project goals including
    sponsored by many organizations to              • Association of American Medical
    conduct research on various oral health           Colleges
    topics of national, state or local interest     • American Dental Association
         •   The Institute of Medicine (now National       •   American Dental Hygienists’ Association
             Academies of Sciences, Engineering,           •   Dental Assisting National Board
             Medicine)
                                                           •   American Dental Education Association
         •   The Pew Charitable Trusts
                                                           •   American Academy of Physician
         •   DentaQuest Foundation
                                                               Assistants
         •   National Commission on Certification of
                                                           •   National Interprofessional Initiative on
             Physician Assistants
                                                               Oral Health
         •   Maine Health Access Foundation
                                                           •   Several State Medicaid Programs
         •   Medical Care Development
                                                           •   Substance Abuse and Mental health
         •   American Academy of Pediatric Dentistry           Services Administration
         •   IHS Markit                                    •   Health Resources and Services
         •   Otto Bremer Foundation                            Administration
         •   Maine Oral Health Funders

oralhealthworkforce.org                                5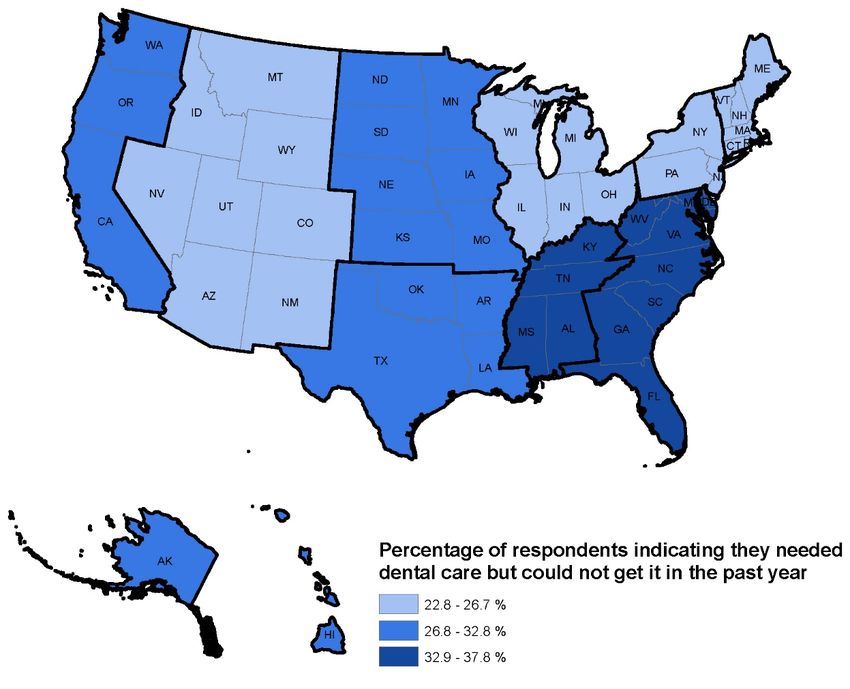
Dissemination
  • Technical reports and briefs to the funders
  • Publicly available on a dedicated website
     (www.oralhealthworkforce.org )
  • Peer reviewed journal articles
         o Health Affairs, December 2016 – chosen by editor as one of
           ten best in the year
  • Many podium, webinar, and poster presentations
         o   Academy Health Research Meeting
         o   National Oral Health Conference
         o   Oral Health 2020 Network
         o   George Washington University Webinar Series
         o   Minnesota State Oral Health Coalition
         o   Kentucky State Legislature

oralhealthworkforce.org                6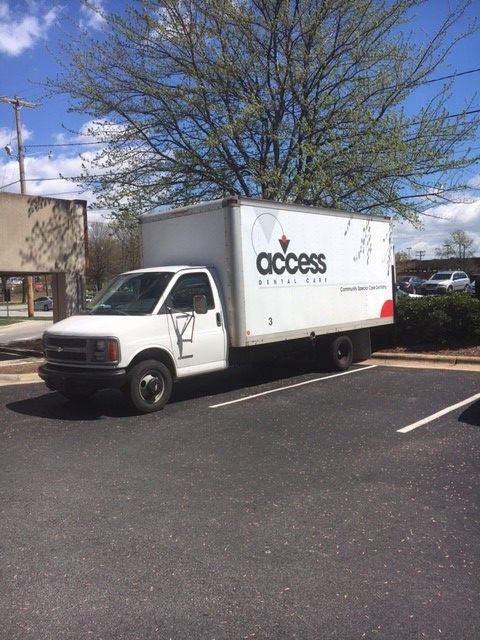
Today’s Presentation
  • Overview of our observations on the oral health service
    delivery system
         o Impacts of health system redesign on oral health service
           delivery
         o Overview of systemic changes generating new workforce
           models and team based service delivery models
         o Supply and distribution of the dental workforce
         o Impact of scope of practice regulation
         o Specific examples of organic growth and local innovation
           in programs addressing specific community needs
         o The oral health care safety net

oralhealthworkforce.org              7
Why is Change in Oral Health Service Delivery
Necessary From a Public Health Perspective
  • Significant oral health disparities
         o By race and ethnicity - 5 year survival rate from oral cancer for
           black men is 36% compared to 61% for white men (CDC, 2018)
         o By socioeconomic status - pronounced disparities in caries
           experience for low income children and adolescents (Slade et al,
           2018)
         o By educational status – 35-44 year old adults with less than a high
           school education have three times the rate of periodontal disease
           as those in same age cohort with some college education (CDC,
           2018)
         o By gender – periodontal disease is greater in men than in women
           (CDC, 2018)
         o By age – Most older Americans (>65 years) lack dental insurance
         o By geographic location – Dental HPSAs, many rural residents
           travel distances to get services

oralhealthworkforce.org                  8
Drivers of Change in Workforce Policy
        in Recent Years Are Numerous
 • Workforce shortages: Dental Health Professions Shortage Areas
   (800 in 1993; 5,866 in 2017 (10,802 practitioners) (Kaiser, 2017)
 • Uneven distribution of dentists particularly in smaller population
   areas
 • Changing public policy – ACA, Medicaid
 • Population demographics
 • Racial/ ethnic oral health disparities
 • Increasing emphasis on upstream effects of social determinants
   of health and the importance of equal access and equity
 • Limited resources to pay for care
 • Technology and Materials
 • Consumer demand for alternative providers
        •    Market forces
        •    Desire for convenient care – Dental Service/Support
             Organizations
                                         9
oralhealthworkforce.org
There is Growing Evidence of Ongoing
         Systemic Change in Oral Health
  •   Emphasis on improving oral health vs dental health
  •   Focus on prevention and early intervention
  •   Greater emphasis on risk assessment – using resources appropriately
  •   Emergence of team based models of care delivery
  • Integration of oral health services into primary care settings
  • Drive to encourage use of diagnostic codes
  • Growth in use of electronic dental records – inclusion in the EHR
  • Consolidation into large group practices – Dental Service
    Organizations (DSOs) - Heartland, 850 practices
  • Growth in the dental safety net
  • Initiatives to move oral health services to community settings
  • Use of technology to improve access

oralhealthworkforce.org               10
The Impact of Systemic Change on the Oral
Health Service Delivery System
• Oral health service delivery is no
longer exclusive to private dental
practice.
• Providers are more distributed and
diverse in location and constitution
• Care delivery is patient centered.
Efforts to bring services to the patient
rather than bringing the patient to the
provider
o Providing services in various settings is
more challenging in dentistry than
medicine because of the procedure
oriented nature of practice
• Innovation depends on an oral health
workforce working at high levels of
professional competence
11
oralhealthworkforce.orgKey Themes Emerging From Our Research: What
makes a positive impact on oral health access
and the oral health of the population?
• Integration of oral health with primary and behavioral health
service delivery
• Workforce innovations
• Expanded functions for existing workforce
• New categories of oral health workers
• Primary care workforce
• Multiple points of entry to the oral health system
• Importance of engaging private practice dentists in care for the
underserved
• Team based approaches to oral health service delivery
• Local solutions and program design to mediate specific oral health
access issues
• Improving insurance status of the population
oralhealthworkforce.org 12Workforce Research and Policy
• Historically, mainly about supply
o Concerns about having enough dentists to serve the public
• Researchers spent time enumerating and locating
• Increasing interest in demand side of equation – impact of health
literacy, insurance status, etc. on utilization
• Interest emerged in linking workforce and their interventions to
health outcomes
• Changed the trajectory of the research agenda
• Broadened the subject to include the context and the consumer
• Corollary to seeking clinical evidence of systemic linkages to oral
disease
• Remains difficult to link an outcome to a specific intervention and
a specific workforce
oralhealthworkforce.org 13Workforce is Often Ignored in Discussions About
Effecting Change Yet it is an Essential Element in
Actualizing Systemic Goals
• Healthcare workforce is the ACTIVE element in effecting change in
oral health service delivery
• Many components of effective workforce policy
o Educational pipeline – formal education and training programs, continuing
education, competency based training models (AL and AK)
o Changes in curricula to accommodate expanded competencies, new
technology, and emerging science
o Accreditation of programs (CODA)
o Certification and licensure of professionals (National and State)
o Scope of practice that assures ability to work to full level of competency
• Structural changes/ passive supports are necessary to enable
workforce activities
o Supportive regulation
o Appropriate reimbursement methodologies
o Enabling technology
o Opportunity for employment/practice in expanded settings
14
oralhealthworkforce.orgThere are Many Impacts of a Shifting Paradigm
on the Oral Health and Health Workforce
• Expansion of roles for existing workforce
o Expanded function dental assistants (EFDAs)
o Public health dental hygienists (PHDHs), Independent practice dental
hygienists (IPDHs), Collaborative practice dental hygienists
• New workforce models
o Community dental health coordinator
Stand alone credential or add on for the DH or the DA
o Dental Therapists (AK) – Dental Hygiene Therapists (MN, VT, ME, AZ)
Basic restorative services
MA, CT, KS, MD, ND, NH, OH, NM, etc. considering some form
WA and OR demonstrations in native communities
• Engagement of medical professionals
o Interprofessional education, Smiles for Life
o Training primary care clinicians to screen and refer and medical assistants
and nurses in application of fluoride, especially for children
o Movement towards integration of health services especially in safety net
settings
oralhealthworkforce.org 15Oral Health Teams Are Constituted
Differently in Different Settings
Federally Qualified Primary Care Medical
Health Centers Practice
• Dentists • Physicians – Family practice,
• Dental Students Internal Medicine, Pediatrics
• Dental Residents • Physician Assistants
• Dental Therapists/Dental • Nurse/ Nurse Practitioners
Hygiene Therapists • Medical Assistants
• Expanded Function Dental • Dental Hygienists
Assistants
• Dental Assistants
• Dental Hygienists
• Public Health Dental Hygienists
• Community Dental Health
Coordinators
• Community Health Workers
• Medical clinicians
• Social Workers Skilled Nursing
Facilities
• Medical Directors
Schools • Dentists
• School Nurses
• School Secretary • Dental Hygienists
• Dentists • Certified Nursing Assistants
• Dental Hygienists
• Dental Assistants
oralhealthworkforce.org 16Teams also Differ Depending on the
Modality for Care Delivery
• Mobile Dentistry
o Dentists
o Dental Hygienists
o Dental Assistants
o Patient Navigators
o Logistics Coordinators
o Liaisons at Host Facility
• Teledentistry
o General Dentists
o Specialty Dentists
o Dental Hygienists
o Information Technology Personnel
o Patient Navigators
oralhealthworkforce.org 17The Supply of Dentists and Their
Changing Demographics
Potential Impacts on Access
to CareResearchers Continue to Count But
Do So in the Context of Demand
Projected Dentist Supply, 2012-2025 • Supply of dentists in the US will
grow from 190,000 in 2012 to
240,000
202,600 in 2025 (Status Quo) (6%
Demand (expanded
increase)
230,000 dental coverage)
Supply (graduates • Demand for dentists in the US will
220,000
increase 10%)
grow from 197,800 in 2012 to
Supply (retire 2 yrs later)
218,200 in 2025 (Status Quo) (10%
FTE Dentists
Demand (status quo) increase)
210,000
Supply (status quo) • HRSA’s model estimates increasing
200,000 supply but worsening shortage
Supply (graduates
decrease 10%) (estimated as 7,800 FTE dentists in
Supply (retire 2 yrs 2012 increasing to 11,800 FTE
190,000 earlier)
dentists in 2025 under Status Quo
scenario)
180,000
2012 2014 2016 2018 2020 2022 2024
Year U.S. Department of Health and Human Services, Health Resources
and Services Administration, National Center for Health Workforce
Source: IHS, Inc. Analysis. National and State-Level Projections of Dentists and Dental
Hygienists in the U.S., 2012-2025. Rockville, Maryland, 2015.
oralhealthworkforce.org 19Supply Estimates Vary Depending on the
Selected Scenario
• In 2017, 198,517 practicing dentists in Summary of Workforce Projection under Nine
Scenarios for Dentists per 100,000 Population,
the US equivalent to 60.9 dentists per Adjusted for Hours Worked
100,000 population.
Assumptions
Projections
• By 2037, if historical trends persist, the Inflow rate
Outflow rate
proportion of professionally active
influenced by 2017 2022 2027 2032 2037 Description
Economic
dentists to population will rise to 63.7 downturn by end-
of-year 2022 55.4 56.5 56.9 57.9 59.5
Highest
outcome
1% annual
(approximately 234,900 dentists). growth in Average U.S.
business cycles 55.4 55.7 56.4 57.6 59.3
graduates per
year after 2022 No economic
downturn by end-
Historical and Projected Dentists per 100,000 of-year 2022 55.4 55.3 56.1 57.4 59.2
Population in the U.S., Baseline Scenario Economic
downturn by end-
of-year 2022 55.4 56.5 56.7 57 57.5
Graduates per
Average U.S. Baseline
year remain
business cycles 55.4 55.7 56.1 56.7 57.3 scenario
constant after
2022 No economic
downturn by end-
of-year 2022 55.4 55.3 55.9 56.5 57.2
Economic
downturn by end-
of-year 2022 55.4 56.5 56.4 56.1 55.6
1% annual
decline in Average U.S.
business cycles 55.4 55.7 55.9 55.7 55.4
graduates per
year after 2022 No economic
downturn by end-
of-year 2022 55.4 55.3 55.6 55.6 55.3 Lowest outcome
Sources: ADA Health Policy Institute analysis of ADA masterfile; ADA Survey of Dental Practice; ADA
Survey of Dental Education; U.S. Census Bureau, Intercensal Estimates and National Population
Sources: ADA Health Policy Institute analysis of ADA masterfile; ADA Survey of Dental Practice; ADA Projections. Notes: Data for 2017 are based on the ADA masterfile. Results after 2017 are projected
Survey of Dental Education; U.S. Census Bureau, Intercensal Estimates and National Population
Projections
oralhealthworkforce.org 20Projections Of Demand Also Vary
Elkund SA, Bailit HL. Estimating the Number of Dentists Needed in 2040. Journal of
Dental Education. August 2017 81(8)146-152.
• Currently between 42% and 67% of US population receives a dental service
each year (Manski and Brown, 2016, NCHS, 2015)
• Dentists treat on average 1,000 to 1,575 patients each year
• 40% of dentists report not being as busy as they would like
• Large group practices growing – by 2040 only 25% to 30% may be in solo
practice
• Between 65% and 80% of services are currently routine recall diagnostic and
preventive services eg over two-thirds of visits mainly require time of allied
dental personnel (Elkund)
• ADA estimates approximately 240,000 dentists in 2040. If 70% are in full time
practice the supply would be approximately 168,000.
• Demand for dentists in 2040, considering numerous factors (including
population growth) would likely range from 80,000 FTE dentists to 127,000 FTE
dentists
• Authors estimate an oversupply of 32% to 110%.
oralhealthworkforce.org 21Specialty Dentist Demand Will
Also Change Over Time
• Pediatric dentists Projected Change in Pediatric Dentist Demand,
currently provide 2016-2030
about a quarter of
all dental care for
children.
• If all children
received dental
services at the
same rate or if
pediatric dentists
increased their
share of children’s
dental services,
more pediatric
dentists will be
needed than in the Source: IHS, CHWS
status quo
scenario
oralhealthworkforce.org 22Concerns about Uneven Distribution
Persist
• Dentists are not evenly distributed with the population
• Preference for practice in metropolitan/suburban areas
oralhealthworkforce.org 23Consumers Report Needing but Being
Unable to Get Care
• Survey of a representative sample
of the US population (OHWRC,
unpublished)
• 5,184 consumers needed dental
care in past 12 months
• Approximately 29.1% of those who
needed services did not get dental
care
• Various reasons – dental insurance,
waiting times, travel times, etc.
Residence %
Census region/division of residence
Northeast
New England 24.0%
Mid-Atlantic 24.4%
Midwest
East North Central 22.8%
West North Central 27.8%
South
South Atlantic 33.0%
East South Central 37.8%
West South Central 32.7%
West
Mountain 26.7%
Pacific 32.8%
All 29.1%
oralhealthworkforce.org 24Demographic Shifts in the Workforce May Impact
Supply, Distribution or Practice Patterns
• Changes in the gender composition of the workforce
• In 2016, 192,260 dentists – 70.2% male
• 15.7% of female dentists and 8.2% of male dentists are from
underrepresented minority groups
• 23.4% of female dentists and 12.1% of male dentists are Asian
Race Ethnicity of Dentists by Gender, 2016
Female Dentists Male Dentists
Characteristics, 2016 % change % change
2010 2012 2014 2016 2010 2012 2014 2016
2010-2016 2010-2016
Race/ethnicity
White 62.3% 61.8% 61.3% 60.9% -2.2% 82.4% 81.7% 80.8% 79.8% -3.2%
Black or African American 6.7% 6.6% 6.4% 6.0% -11.0% 3.0% 3.0% 3.0% 2.9% -2.7%
Hispanic 7.9% 7.7% 7.9% 7.9% -0.3% 3.8% 3.8% 4.0% 4.2% 8.3%
Asian 22.3% 22.6% 23.0% 23.4% 5.1% 10.4% 10.8% 11.5% 12.1% 16.5%
Other1 0.8% 1.3% 1.4% 1.8% 137.3% 0.4% 0.8% 0.8% 1.1% 151.2%
Total 100.0% 100.0% 100.0% 100.0% 0.0% 100.0% 100.0% 100.0% 100.0% 0.0%
Source: ADA Masterfile, 2016. OHWRC, 2018
oralhealthworkforce.org
25Gender Differences in Practice
• Proportionately fewer female dentists practice in rural areas
• Fewer females are owner dentists - age may affect ownership status
• Mean age – females (43.9 yrs), males (52.8 yrs)
Dental Practice Ownership and Geographic Location, 2016
Source: ADA Masterfile, 2016, OHWRC, 2018
oralhealthworkforce.org 26Gender Differences in Practice
• Female dentists between 36 and 65 years of age who are
owners of dental practices are significantly more likely than
male dentist practice owners in the same age cohort to treat
patients covered by public insurance.
Adjusted Effects of Female vs. Male Dental Practice Owners on Treating
Patients With Public Insurance
Prevalence 95% Confidence Interval
Dentists P-value
Ratio
Lower Limit Upper Limit
Female vs. Male
≤35 years of age 0.84 0.70 1.02 0.0859
36-45 years of age 1.72 1.53 1.94Racial Ethnic Composition of the Workforce
is Also Important
Study of Underrepresented Minority Dentists (URM) (Mertz et al, 2016)
o To examine distribution of minority dental providers and the extent to which
minority patients depend on minority providers for dental care.
o 2012 sample survey of underrepresented minority dentists (34% response rate).
Key Findings
o Black dentists are 3% of dentist population; 19% of the US population is Black
o Hispanic/ Latino (H/L) dentists are 2.8% of dentists; 22% of the US population is
H/L
o American Indian/Alaska Native (AI/AN) dentists are 0.2% of dentists;1.4% of the
US population is AI/AN
To bring URM dentist population to parity with the US population would require:
o 19,714 Black dentists
o 31,214 Hispanic/Latino dentists, and
o 2,825 American Indian/Alaska Native Dentists (AI/AN)
To bring workforce to parity with the population:
o 53,753 total URM = 10 years of US dental graduates
oralhealthworkforce.org 28Strong patient/provider concordance
Source: Mertz et al
Note: Totals exceed 100% because race and Hispanic/Latino ethnicity are not mutually exclusive categories.
29
oralhealthworkforce.orgThe Demographics of Faculty in Dental
Schools are also Changing
• In 2014-15, the gender mix among dental faculty was similar
across regions with dental schools in the Midwest reporting
slightly more female faculty members (33.7%) than nationally
Ten Year Trend of Dental Faculty in US Dental Schools by
Gender, 2005-06 to 2014-2015
Source: American Dental Education Association, 2005-2015, OHWRC 2016
oralhealthworkforce.org 30Dental School Faculty is Slowly Diversifying
• In 2009-10, 81.3% of dental school faculty in the US was White; in 2014-15, 75.0% of
faculty was White.
• In 2014-15, dental schools in the Midwest reported proportionally more White
faculty, the Northeast more White and Asian faculty, the South more Hispanic/
Latino and Black/African American faculty, and the West more Asian faculty than
nationally
Race/Ethnicity of Faculty in US Dental Schools by Region, 2014-2015
Source: American Dental Education Association, 2014-15, OHWRC, 2016
oralhealthworkforce.org 31What are the Policy Questions that Arise
from These Data?
• Will there be too many or not enough clinicians to
address the oral health needs of the US population?
• How do we encourage diversity in the workforce?
• Will preference for urban practice further
compromise access to services in rural areas? What
programmatic interventions might mediate
distribution issues?
• What provider mix is optimal to assure high quality,
low cost, available oral health services?
• How should public resources be used to encourage
equitable access and achieve health equity?
oralhealthworkforce.org 32An Example of Our Project Work
Impacts of Regulation on Delivery
of Oral Health Services:
How does state workforce policy
impact the availability of
oral health services?
oralhealthworkforce.org 33In the U.S., States Are Primarily Responsible
for Regulating Health Professions
State Regulations
Describes Title
Definitions Regulatory Protection
Body
Professional Competency/
Qualifications
Licensure
Certification
Education and Requirements
Process
Training
SOP Including Licensure Discipline
Limitations and
Exceptions Renewal Process
Continuing Appeals
Education Process
oralhealthworkforce.org 34Scope of Practice Evolves with Changes in the
Knowledge Base, Progress in Science and Technology,
and Stakeholder Efforts to Increase Access
Federal Law
Professional
Associations
State Law
Advocacy Groups
Consumers
Health Care Industry
State Regulatory Agencies
Insurance Industry
Effect of Change on: Scope of
Public Safety Practice
Drivers of Change:
Quality of Patient Outcomes Needs of Underserved
Cost of Services Populations
Other Professions New Information or Medical
Professional Education Programs Access Technology
Patient Acceptance Improved Body of Knowledge
Structure of Health Care Delivery Expanded Education Curricula
System Cost Rising Cost of Health Care
Payment Methodologies Services
Outcomes
oralhealthworkforce.org
35Scope of Practice Variation
Impacts Outcomes
• State by state variation in approaches to expanded practice but results are
similar
• Strategies for reducing oral disease burden emphasize education, prevention,
early intervention, and risk management.
• The new approach to oral health requires engagement of an inclusive oral
health care team, especially dental hygienists.
• Dental hygienists are increasingly able to practice in public health and
community settings and to provide a broader range of services in those
settings
• Progression in scope of practice has impacted professional roles
o Can physicians supervise dental hygienists in medical settings?
• There is a changing perception of dental hygienists –no longer viewed simply
as a dental extender but now seen as a preventive oral health specialist
• Question: Does expansion of scope of practice impact oral health
outcomes in the population?
oralhealthworkforce.org 36Dental Hygienists and the 2001 and 2004
Dental Hygiene Professional Practice Index
• Scope of practice (SOP) varies considerably by state
o assorted models of public health supervision practice
• Differences in permitted tasks and required supervision by state impact service
delivery
• Important to assess the impact of variation in SOP by state on oral health
outcomes
• No numerical measure to permit comparison
• Dental Hygiene Professional Practice Index (DHPPI):
o Developed in 2001
o State scoring update in 2014
o New index with revised variables and scoring was created in 2016
• DHPPI contains numerous variables grouped into 1 of 4 categories:
o Regulation, supervision, tasks, and reimbursement
• Numerical scoring based on each state’s law and regulation
o Possible composite score from 0-100
oralhealthworkforce.org 37State DHPPI Scores in 2001 and 2014 • Descriptive analysis 2001 scores -10 in West Virginia, 97 in Colorado 2014 scores -18 in Alabama and Mississippi, 98 in Maine. Mean score on the DHPPI 43.5 (2001)↑ 57.6 (2014) • Factor Analysis In 2014, exploratory and confirmatory factor analysis confirmed that the component structures were all aspects of the overarching concept (in this case scope of practice) • Statistical analysis In 2001, SOP was positively but not significantly associated with the percent of the population in a state having their teeth cleaned by a dentist or dental hygienist in the past year. Research question in 2014: Is SOP associated with population oral health outcomes? Used multilevel logistic modeling with the DHPPI an BRFSS data controlling for state and individual level factors including community water fluoridation, demographic and socioeconomic factors. Finding: More expansive SOP for DHs in states was positively and significantly associated (p
The 2016 DHPPI
•   Finding from 2014 update – variables in 2001
    DHPPI no longer adequately represented SOP
•   Dental hygienists now seen as experts in
    prevention education and services
       o   More autonomous roles
       o   Team based care
       o   New technologies
       o   New settings for care delivery
       o   Point of entry - case finding
       o   Roles as case managers/patient navigators
•   Design process for the new DHPPI included
    focus groups with dental hygienists
       o   Some variables were retained or modified
       o   New variables were added
       o   Fewer variables overall
       o   Scoring weights were redistributed
       o   New variables e.g., dental hygiene therapy,
           use of lasers, and basic restorative tasks
•   Factor analysis again confirmed the integrity of
    the construct
•   As expected, scores were lower on the new index
       o   Range of scores was 7 in Mississippi to 86 in
           Maine
•   Currently in the process of analyzing the impact
    of SOP on outcomes using the most recent
    BRFSS

       oralhealthworkforce.org                             39
Changing Scope of Practice for Dental Hygienists
– 2001, 2014, 2016
High scoring states in 2014 were also high scoring on the new
index (e.g., ME, CO, CA, WA, NM were each classified as
excellent environments at each scoring)
Some states were innovators in expanding practice
opportunities for dental hygienists (e.g., MN with advanced
dental therapy, VT recently enabled dental therapy; the model
requires professionals to also be dental hygienists)
Other states used a slower, more incremental approach to
increasing scope of practice (e.g., IA classified as satisfactory
at each scoring)
Some low scoring states were consistently low scoring (e.g.,
GA, MS, NC classified as restrictive at each scoring)
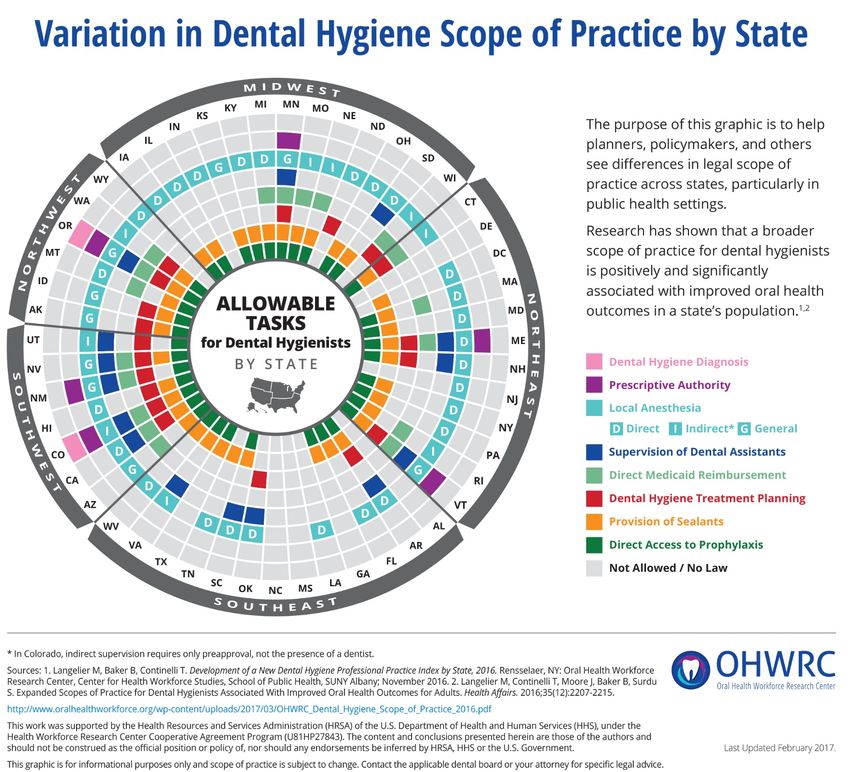
oralhealthworkforce.org 40Developing a Dental Hygiene SOP
Infographic: Why and How
• Research finds that broader SOPs for DHs are associated
with better oral health outcomes in a state
• There is substantial variation in DH SOP across states, but
no easily used tools to help policy makers understand
these differences
• How do we distill the complicated DHPPI into a useable
instrument for policymakers?
• OHWRC in collaboration with ADHA conducted a series of
focus groups of dental hygiene leaders from across the
country to identify the key DH functions and tasks to
include in an infographic
oralhealthworkforce.org 4142
Conclusions and Next Steps
  • SOP is an important consideration when designing workforce
    strategies to increase access to and utilization of preventive
    oral health services
  • Placing DHs in community settings and enabling service
    delivery with autonomy within professional competencies may
    improve outcomes
  • In the process of analyzing data to determine the impact of
    scope of practice on access to oral health services and on oral
    health outcomes for children
  • Preliminary analysis suggests an interaction effect which would
    support the importance of oral health care teams
  • There may be a tipping point at which scope of practice
    expansion makes a significant difference relative to the oral
    health of the population. This is an area for further research.

oralhealthworkforce.org               43
Some Examples Of Local
Innovation and
Delivery Programs that Improve
Access to Oral Health Services
Each of the following examples utilizes
different resources and program design
determined by available workforce,
insurance regulation, and regulatory
policies in respective state
oralhealthworkforce.org 44There is No Standard Template for
Program Design
• Service provision varies
• Program design is determined by
o Need in the population
o Evaluation of existing oral health resources and
providers in communities
o State regulation regarding requirements for dental
supervision of allied dental workforce
o Scope of practice laws related to practice of dental
hygiene and dental assisting
o Insurance regulation regarding reimbursement for
services
oralhealthworkforce.org 45State Strategies To Provide Opportunities
for Expanding Access Differ
Maine enabled several types of dental hygiene
• The dental hygiene therapist
• Expanded function dental assisting
• Dental hygienists in expanded roles can bill Medicaid directly
• Into the Mouths of Babes
Oregon uses demonstration/pilot authority to test
innovation.
• Pilot program in Teledentistry
• Northwest Portland Area Indian Health Board pilot project
oralhealthworkforce.org 46State Sponsored Initiatives in Conjunction
with Local Programs Impact Access
• Michigan has enabled a robust public health dental
hygiene program
o Approximately 200 dental hygienists work in 50 public
health programs
o has contracted with Delta Dental to manage dental
services for Medicaid eligible children in the state
through the Delta Healthy Kids dental program
• Points of Light - a Website to connect children with
dentists – links pediatricians to community dentists willing
to treat Medicaid insured children
• Calhoun County – pay it forward oral health initiative
• My Community Dental Centers– a consortium of 19
county and regional departments of health, the largest
group dental practice in the state
oralhealthworkforce.org 47Access Dental Locates in Places Accessible
to High Needs Patients
• Mobile van program with a focus on
special needs patients
• Delivers services in 86 facilities in 23
counties in North Carolina
• Patient populations with compromised
access to oral health services
• Dentists and dental hygienists provide
services in the regional center for
infectious diseases for HIV positive
patients 3 to 5 days a month where
they can interface with infectious
disease specialists as needed
• The program provides a full range of
dental services including dentures
• The founding dentist also provides
surgical services in hospitals near
patients’ homes
oralhealthworkforce.org 48Mobile Services Are Part of a Comprehensive
System of Oral Health Service Delivery
in Rochester, New York
• The SMILEmobile program at • Referrals to school based health
Eastman Institute for Oral Health centers and the Institute’s specialty
clinic are routine for children with
• 5 mobile dental units that routinely extra need
locate at neighborhood schools
attended by children from low
income families in Rochester, NY
• One unit is equipped for special
needs populations
• Serves dental needs of 2,000
children in 17 schools
• In the summer units travel to
surrounding counties to serve
adults and children in need of
services. For many students, the
mobile van is their dental home
oralhealthworkforce.org 49A System of Care in Colorado Incorporates A Fixed
Clinic, A Mobile Program, and Teledentistry
• Dental hygienist-founded • The dental hygienist provides
independent practice, Senior Mobile preventive services for the patient in
Dental the skilled nursing facility using
• Mission to provide preventive oral portable equipment
health services for elders, especially • Dentist can log into the patient record
residents of skilled nursing facilities to formulate a treatment plan
• Now a full service dental provider
operating a fixed dental clinic and a
mobile program, servicing:
o residents of a municipal housing
project
o elders in community centers,
o residents of nursing homes, and
o seniors in rural areas
• Uses store and forward Teledentistry
applications
oralhealthworkforce.org 50An FQHC In Pennsylvania Uses Dental Hygienists
with Different Credentials To Improve Access
• Wayne Memorial Community Health • Public health dental hygiene
Center, FQHC affiliated with the local practitioner employed by the FQHC is
hospital system certified as a community dental health
coordinator
• County’s only dental provider
participating in state Medicaid program • Provides outreach, case finding ,
community education, and preventive
• Uses expanded practice workforce in oral health services in primary care
fixed clinic practices, schools and Head Start
programs
• Integrates oral health into primary care
practices
• Provides mobile services
• In the dental clinic, dental hygienists
prep patients for restorative services
providing local anesthesia
• EFDAs place and carve restorations after
dentist preps the tooth
51
oralhealthworkforce.orgTeledentistry Services in Rural Western
New York Are a Gateway to a Dental Home
• Teledentistry services at Finger • 77.1% of children subsequently
Lakes Community Health Center establish a dental home at a FLCH
focus on children’s specialty dental dental clinic
services
• Children generally from low income
families in rural areas
• Synchronous specialty dental
consults in real time
• The dental specialist/pediatric
dentist is located at the Eastman
Institute for Oral Health in
Rochester.
• A FLCH dentist or dental hygienist is
with the patient at the dental clinic
during the consultation.
• 97.2% treatment completion rate (1
to 5 visits) in Rochester
oralhealthworkforce.org 52The Virtual Dental Home in Salem, Oregon
Allows Children to Remain in Their Communities
for Preventive Services
• A virtual dental home (VDH) uses • This initiative is sponsored by a
expanded practice dental dental health maintenance
hygienists (EPDH) to provide organization (DHMO) that is a
children in schools with preventive dental insurer and also part of a
oral health services. dental service organization (DSO) .
• Serves students from families with
a primary language other than
English, live in rural areas, and
work in agriculture
• EPDHs provide services in schools
during the school year and in a
pediatrician’s office during the
summer
• Oregon contracts with
coordinated care organizations
oralhealthworkforce.org 53Residents of a Skilled Nursing Facility in
NH Routinely Receive Dental Services
• Northeast Mobile Dental provides services for
nursing home residents in 3 states
• Public health dental hygienist in NH collaborates
with dentist to provide services in two skilled
nursing facilities
• The dentist and dental hygienist alternate weeks in
the facility
• The organization is capitated
for services
oralhealthworkforce.org 54Integration of Oral Health Services
with Primary Medicine
oralhealthworkforce.org 55FQHCS are Important Innovators in the
Communities They Serve
• Services are co-located • Integrated electronic health records
enable continuity of care
• Reducing structural barriers to
integration • Use innovative oral health workforce
• Warm hand-offs between clinical models and team based care
disciplines
• Provide a comprehensive health
home
• Mission driven workforce
• Workforce comprises multiple
professions to address social and
health needs
• Health care teams have flexible
boundaries
oralhealthworkforce.org 56FQHCs Provide Oral Health Services to
More than 6 Million Patients
• Increase in number of FQHCs delivering oral health services between 2011-
2014 but decrease in proportion of health centers directly providing oral health
services
• Increase in the proportion of preventive services (+ 3.3%), decrease in in
percentage of restorative services (-1.3%), oral surgery services (-7.4%) and
emergency dental services (-11.7%)
Four-Year Trend of All FQHCs and FQHCs With Dentist and/or Dental Hygienist FTEs
Providing Oral Health Services to At Least 1 Patient Nationwide, 2011-2014
oralhealthworkforce.orgStrategies Used by FQHCs to Foster
Integration Vary
• Patients receiving oral health services are required to be
primary care patients
• DHs are routinely scheduled to provide screening services
during periodic well child pediatric visits
• FQHCs engage primary care clinicians with oral health
screening and referral
• Offer oral health services in school based health centers, in
mobile and portable programs, or using teledentistry
• Embed a dental hygienist in the off-site primary care
practices.
• Use a team approach to providing services
• Recognize the importance of building connections with other
providers in their local communities
oralhealthworkforce.org 58Some Questions that Arise
• How can we engage private practice dentists to
participate at higher rates in care for the underserved?
• How can the various models for oral health service
delivery (mobile/portable, teledentistry) be integrated
into mainstream practice?
• Will there be increasing convergence between the private
(hierarchical) and public health (team based) models for
delivering oral health services in the future? Will new
workforce, expanded scopes of practice for existing
workforce or shifts to management by dental service
organizations act as catalysts for change?
• Are there ways to better integrate health service delivery
to accomplish a comprehensive health home?
oralhealthworkforce.orgReferences Centers for Disease Control. Oral Health Disparities, March 2018. https://www.cdc.gov/oralhealth/oral_health_disparities/index.htm Elkund SA, Bailit HL. Estimating the Number of Dentists Needed in 2040. Journal of Dental Education. August 2017 81(8) 146-152. Henry J Kaiser Family Foundation. Dental Care Health Professional Shortage Areas (HPSAs). https://www.kff.org/other/state-indicator/dental-care-health-professional-shortage-areas- hpsas/?currentTimeframe=0&sortModel=%7B%22colId%22:%22Location%22,%22sort%22:%22asc%22%7D Mertz EA, Wides CD, Kottek AM, Calvo JM, Gates PE. Underrepresented Minority Dentists: Quantifying Their Numbers and Characterizing The Communities They Serve. Health Affairs, 2016 (35:12) https://www.healthaffairs.org/doi/full/10.1377/hlthaff.2016.1122 Munson B, Vujicic M. Supply of Full-time Equivalent Dentists in the U.S. Expected to Increase Steadily. Health Policy Institute. American Dental Association. Research Brief. July 2018. https://www.ada.org/~/media/ADA/Science%20and%20Research/HPI/Files/HPIBrief_0718_1.pdf?xd_co_f=MjBkZmQ3OT AwOWIxZThjMjM3ZDE1MzIzOTI3OTkyNjA=&la=en Fischer DJ, O’Hayre M, Kusiak JW, Somerman MJ, Hill CV. Oral Health Disparities: A Perspective From the National Institute of Dental and Craniofacial Research. American Journal of Public Health. June 2017(Suppl1):S36-38. https://www.ncbi.nlm.nih.gov/pmc/articles/PMC5497869/ Langelier M, Continelli T, Moore J, Baker B, Surdu S. Expanded Scopes of Practice For Dental Hygienists Associated with Improved Oral Health Outcomes for Adults. Health Affairs. December 2016. 35(12) 2207-2215. https://www.healthaffairs.org/doi/pdf/10.1377/hlthaff.2016.0807 Slade GD, Sanders AE. Two decades of persisting income disparities in dental caries among US children and adolescents. American Journal of Public Health Dentistry. Summer 2018: 78(3) 187-191. U.S. Department of Health and Human Services, Health Resources and Services Administration, National Center for Health Workforce Analysis. National and State-Level Projections of Dentists and Dental Hygienists in the U.S., 2012- 2025. Rockville, Maryland, 2015. https://bhw.hrsa.gov/sites/default/files/bhw/nchwa/projections/nationalstatelevelprojectionsdentists.pdf oralhealthworkforce.org 60
Thank You
                           Questions?

                      Visit Us:
              http://www.chwsny.org/
            www.oralhealthworkforce.org

oralhealthworkforce.org        61
You can also read