CLOUD-BASED PHRASE MINING AND ANALYSIS OF USER-DEFINED PHRASE-CATEGORY ASSOCIATION IN BIOMEDICAL PUBLICATIONS - JOVE
←
→
Page content transcription
If your browser does not render page correctly, please read the page content below
Journal of Visualized Experiments                                                                                             www.jove.com

Video Article
Cloud-Based Phrase Mining and Analysis of User-Defined Phrase-Category
Association in Biomedical Publications
                     1,2                1,2                 1                    3          1,2,4        5              5                 5      1,6,7
Dibakar Sigdel* , Vincent Kyi* , Aiden Zhang* , Shaun P. Setty , David A. Liem                  , Yu Shi , Xuan Wang , Jiaming Shen , Wei Wang       ,
           5             1,2,4,6
JiaWei Han , Peipei Ping
1
    The NIH BD2K Center of Excellence in Biomedical Computing, University of California, Los Angeles
2
    Department of Physiology, University of California, Los Angeles
3
    Department of Pediatric and Adult Congenital Heart Surgery, Miller Children's and Women's Hospital and Long Beach Memorial Hospital
4
    Department of Medicine/Cardiology, University of California, Los Angeles
5
 NIH BD2K Program Centers of Excellence for Big Data Computing -- KnowEng Center, Department of Computer Science, University of Illinois at Urbana-Champaign
(UIUC)
6
    Scalable Analytics Institute (ScAi), University of California, Los Angeles
7
    Department of Computer Science, University of California, Los Angeles
*
    These authors contributed equally

Correspondence to: Peipei Ping at ppingucla@gmail.com

URL: https://www.jove.com/video/59108
DOI: doi:10.3791/59108
Keywords: Medicine, Issue 144, text mining, data science, medical informatics, phrase mining, cloud computing
Date Published: 2/23/2019
Citation: Sigdel, D., Kyi, V., Zhang, A., Setty, S.P., Liem, D.A., Shi, Y., Wang, X., Shen, J., Wang, W., Han, J., Ping, P. Cloud-Based Phrase Mining
and Analysis of User-Defined Phrase-Category Association in Biomedical Publications. J. Vis. Exp. (144), e59108, doi:10.3791/59108 (2019).

Abstract
      The rapid accumulation of biomedical textual data has far exceeded the human capacity of manual curation and analysis, necessitating novel
      text-mining tools to extract biological insights from large volumes of scientific reports. The Context-aware Semantic Online Analytical Processing
      (CaseOLAP) pipeline, developed in 2016, successfully quantifies user-defined phrase-category relationships through the analysis of textual data.
      CaseOLAP has many biomedical applications.

      We have developed a protocol for a cloud-based environment supporting the end-to-end phrase-mining and analyses platform. Our protocol
      includes data preprocessing (e.g., downloading, extraction, and parsing text documents), indexing and searching with Elasticsearch, creating a
      functional document structure called Text-Cube, and quantifying phrase-category relationships using the core CaseOLAP algorithm.

      Our data preprocessing generates key-value mappings for all documents involved. The preprocessed data is indexed to carry out a search of
      documents including entities, which further facilitates the Text-Cube creation and CaseOLAP score calculation. The obtained raw CaseOLAP
      scores are interpreted using a series of integrative analyses, including dimensionality reduction, clustering, temporal, and geographical analyses.
      Additionally, the CaseOLAP scores are used to create a graphical database, which enables semantic mapping of the documents.

      CaseOLAP defines phrase-category relationships in an accurate (identifies relationships), consistent (highly reproducible), and efficient manner
      (processes 100,000 words/sec). Following this protocol, users can access a cloud-computing environment to support their own configurations
      and applications of CaseOLAP. This platform offers enhanced accessibility and empowers the biomedical community with phrase-mining tools for
      widespread biomedical research applications.

Video Link
      The video component of this article can be found at https://www.jove.com/video/59108/

Introduction
      Manual evaluation of millions of text files for the study of phrase-category association (e.g., Age group to protein association) is incomparable
      with the efficiency provided by an automated computational method. We want to introduce the cloud-based Context-aware Semantic Online
      Analytical Processing (CaseOLAP) platform as a phrase-mining method for automated computation of phrase-category association in the
      biomedical context.
                                                                         1
      The CaseOLAP platform, which was first defined in 2016 , is very efficient compared to the traditional methods of data management and
                                                                                      2,3,4
      computation because of its functional document management called Text-Cube           , which distributes the documents while maintaining
                                                                                              5
      underlying hierarchy and neighbourhoods. It has been applied in biomedical research to study entity-category association. The CaseOLAP
      platform consists of six major steps including download and extraction of data, parsing, indexing, Text-Cube creation, entity count, and
      CaseOLAP score calculation; which is the main focus of the protocol (Figure 1, Figure 2, Table 1).

Copyright © 2019 Creative Commons Attribution-NonCommercial-NoDerivs 3.0 Unported                                  February 2019 | 144 | e59108 | Page 1 of 14
License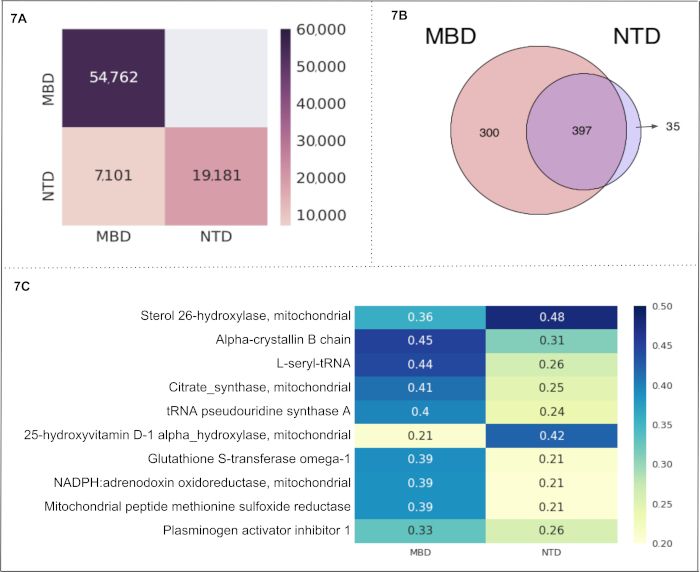
Journal of Visualized Experiments                                                                                             www.jove.com

  To implement the CaseOLAP algorithm, the user sets up categories of interest (e.g., disease, signs and symptoms, age groups, diagnosis)
  and entities of interest (e.g., proteins, drugs). One example of a category included in this article is the 'Age Groups', which has 'infant', 'child',
  'adolescent', and 'adult' subcategories as cells of the Text-Cube and protein names (synonyms) and abbreviations as entities. Medical Subject
  Headings (MeSH) are implemented to retrieve publications corresponding to the defined categories (Table 2). MeSH descriptors are organized
  in a hierarchical tree structure to permit search for publications at varying levels of specificity (a sample shown in Figure 3). The CaseOLAP
  platform utilizes the data indexing and search functionality for curation of the documents associated with an entity which further facilitate
  document to entity count mapping and CaseOLAP score calculation.
                                                                                         1,5
  The details of the CaseOLAP score calculation is available in previous publications . This score is computed using specific ranking criteria
  based on underlying Text-Cube document structure. The final score is the product of Integrity, Popularity, and Distinctiveness. Integrity describes
  whether a representative entity is an integral semantic unit that collectively refers to a meaningful concept. The integrity of the user-defined
  phrase is taken to be 1.0 because it stands as a standard phrase in the literature. Distinctiveness represents the relative relevance of a phrase
  in one subset of documents compared to the rest of the other cells. It first calculates the relevance of an entity to a specific cell by comparing
  the occurrence of the protein name in the target data set and provides a normalized Distinctiveness score. Popularity represents the fact that
  phrase with a higher popularity score appears more frequently in one subset of documents. Rare protein names in a cell are ranked low, while an
  increase in their frequency of mention has a diminishing return due to the implementation of the logarithmic function of frequency. Quantitatively
  measuring these three concepts depends on the (1) term frequency of the entity over a cell and across the cells and (2) number of documents
  having that entity (document frequency) within the cell and across the cells.

  We have studied two representative scenarios using a PubMed dataset and our algorithm. We are interested in how mitochondrial proteins are
  associated with two unique categories of MeSH descriptors; "Age Groups" and "Nutritional and Metabolic Diseases". Specifically, we retrieved
  15,728,250 publications from 20 years publications collected by PubMed (1998 to 2018), among them, 8,123,458 unique abstracts have had
  full MeSH descriptors. Accordingly, 1,842 human mitochondrial protein names (including abbreviations and synonyms), acquired from UniProt
  (uniprot.org) as well as from MitoCarta2.0 (http://mitominer.mrc-mbu.cam.ac.uk/release-4.0/begin.do>), are systematically examined. Their
  associations with these 8,899,019 publications and entities were studied using our protocol; we constructed a Text-Cube and calculated the
  respective CaseOLAP scores.

Protocol
  NOTE: We have developed this protocol based on the Python programming language. To run this program, have Anaconda Python and Git pre-
  installed on the device. The commands provided in this protocol are based on Unix environment. This protocol provides the detail of downloading
  data from PubMed (MEDLINE) database, parsing the data, and setting up a cloud computing platform for the phrase mining and quantification of
  user-defined entity-category association.

1.Getting code and python environment setup
  1. Download or clone the code repository from Github (https://github.com/CaseOLAP/caseolap) or by typing ‘git clone https://github.com/
     CaseOLAP/caseolap.git’ in the terminal window.
  2. Navigate to the ‘caseolap’ directory. This is the root directory of the project. Within this directory, the ‘data’ directory will be populated with
     multiple data sets as you progress through these steps in the protocol. The ‘input’ directory is for user-provided data. The ‘log’ directory has
     log files for troubleshooting purposes. The ‘result’ directory is where the final results will be stored.
  3. Using the terminal window, go to the directory where you cloned our GitHub repository. Create the CaseOLAP environment using the
     ‘environment.yml’ file by typing ‘conda env create -f environment.yaml’ in the terminal. Then activate the environment by typing ‘source
     activate caseolap’ in the terminal.

2. Downloading documents
  1. Make sure that the FTP address in ‘ftp_configuration.json’ in the config directory is the same as the Annual Baseline or Daily Update Files link
     address, found in the link (https://www.nlm.nih.gov/databases/download/pubmed_medline.html).
  2. To download baseline only or update files only, set ‘true’ in the ‘download_config.json’ file in the ‘config’ directory. By default, it downloads and
     extracts both baseline and update files. A sample of extracted XML data can be viewed at (https://github.com/CaseOLAP/caseolap-pipelines/
     blob/master/data/extracted-data-sample.xml)
  3. Type ‘python run_download.py’ in the terminal window to download abstracts from the Pubmed database. This will create a directory called
     ‘ftp.ncbi.nlm.nih.gov’ in the current directory. This process checks the integrity of the downloaded data and extracts it to the target directory.
  4. Go to the ‘log’ directory to read the log messages in ‘download_log.txt’ in case the download process fails. If the process is completed
     successfully, the debugging messages of the download process will be printed out in this log file.
  5. When the download is complete, navigate through ‘ftp.ncbi.nlm.nih.gov’ to make sure that there is ‘updatefiles’ or ‘basefiles’ or both
     directories based on download configuration in ‘download_config.json’. The file statistics become available at ‘filestat.txt’ in the ‘data’
     directory.

3. Parsing documents
  1. Make sure that downloaded and extracted data is available at ‘ftp.ncbi.nlm.nih.gov’ directory from step 2. This directory is the input data
     directory in this step.
  2. To modify the data-parsing schema, select parameters in ‘parsing_config.json’ file in the ‘config’ directory by setting their value to ‘true’. By
     default, it parses the PMID, authors, abstract, MeSH, location, journal, publication date.

Copyright © 2019 Creative Commons Attribution-NonCommercial-NoDerivs 3.0 Unported                         February 2019 | 144 | e59108 | Page 2 of 14
License
Journal of Visualized Experiments                                                                                             www.jove.com

  3. Type ‘python run_parsing.py’ in the terminal to parse the documents from downloaded (or extracted) files. This step parses all downloaded
     XML files and creates a python dictionary for each document with keys (e.g., PMID, authors, abstract, MeSH of the file based on parsing
     schema setup at step 3.2).
  4. Once data parsing is completed, make sure that parsed data is saved in the file called ‘pubmed.json’ in the data directory. A sample of parsed
     data is available at Figure 3.
  5. Go to the ‘log’ directory to read the log messages in ‘parsing_log.txt’ in case the parsing process fails. If the process is completed
     successfully, the debugging messages will be printed out in the log file.

4. Mesh to PMID mapping
  1. Make sure that parsed data (‘pubmed.json’) is available at the ‘data’ directory.
  2. Type ‘python run_mesh2pmid.py’ in the terminal to perform MeSH to PMID mapping. This creates a mapping table where each of the MeSH
     collects associated PMIDs. A Single PMID may fall under the multiple MeSH terms.
  3. Once the mapping is completed, make sure that there is ‘mesh2pmid.json’ in the data directory. A sample of the top 20 mapping statistics is
     available in Table-2, Figures 4 and 5.
  4. Go to the ‘log’ directory to read the log messages in ‘mesh2pmid_mapping_log.txt’ in case this process fails. If the process is completed
     successfully, the debugging messages of the mapping will be printed out in this log file.

5. Document indexing
  1. Download the Elasticsearch application from https://www.elastic.co. Currently, the download is available at (https://www.elastic.co/downloads/
      elasticsearch). To download the software in the remote cloud, type ‘wget https://artifacts.elastic.co/downloads/elasticsearch/elasticsearch-
      x.x.x.tar.gz’ in the terminal. Make sure that ‘x.x.x’ in the above command is replaced by proper version number.
  2. Make sure that downloaded ‘elasticsearch-x.x.x.tar.gz’ file appears in the root directory then extract the files by typing ‘tar xvzf elasticsearch-
      x.x.x.tar.gz’ in the terminal window.
  3. Open a new terminal and go to the ElasticSearch bin directory by typing ‘cd Elasticsearch/bin’ in the terminal from the root directory.
  4. Start the Elasticsearch server by typing ‘./Elasticsearch’ in the terminal window. Make sure that the server is started without error messages.
      In case of error on starting Elasticsearch server, follow the instructions at (https://www.elastic.co/guide/en/elasticsearch/reference/current/
      index.html).
  5. Modify the contents in the ‘index_init_config.json’ in ‘config’ directory to set index initiation. By default, it will select all items present.
  6. Type ‘python run_index_init.py’ in the terminal to initiate an index-database in the Elasticsearch server. This initializes the index with a
      set of criteria known as index information (e.g., index name, type name, number of shards, number of replicas). You will see the message
      mentioning index is successfully created.
  7. Select the items in the ‘index_populate_config.json’ in the ‘config’ directory by setting their value to ‘true’. By default, it will select all items
      present.
  8. Make sure that parsed data (‘pubmed.json’) is present in the ‘data’ directory.
  9. Type ‘python run_index_populate.py’ in the terminal to populate the index by creating bulk data with two components.A first component is
      a dictionary with metadata information on the index name, type name, and bulk id (e.g., ‘PMID’). A second component is a data dictionary
      containing all the information on the tags (e.g., ‘title’,’abstract’,’MeSH’).
  10. Go to the ‘log’ directory to read the log messages in ‘indexing_log.txt’ in case this process fails. If the process is completed successfully, the
      debugging messages of the indexing will be printed out in the log file.

6. Text-cube creation
  1. Download the latest MeSH Tree available at (https://www.nlm.nih.gov/mesh/filelist.html). The current version of the code is using MeSH Tree
     2018 as ‘meshtree2018.bin’ in the input directory.
  2. Define the categories of interest (e.g., Disease names, Age groups, Gender). A category may include one or more MeSH descriptors (https://
     meshb-prev.nlm.nih.gov/treeView). Collect MeSH IDs for a category. Save the names of the categories in the file ‘textcube_config.json’ in the
     config directory (see a sample of the category in ‘Age Group’ in the downloaded version of ‘textcube_config.json’ file).
  3. Put the collected categories of MeSH IDs in a line separated by a space. Save the category file as ‘categories.txt’ in the ‘input’ directory (see
     a sample of ‘Age Group’ MeSH IDs in the downloaded version of ‘categories.txt’ file). This algorithm automatically selects all descendent
     MeSH descriptors. An example of root nodes and descendants are presented in Figure 4.
  4. Make sure that ‘mesh2pmid.json’ is in the ‘data’ directory. If the MeSH Tree has been updated with a different name (e.g.,
     ‘meashtree2019.bin’) in ‘input’ directory, make sure that this is properly represented in the input data path in the ‘run_textube.py’ file.
  5. Type ‘python run_textcube.py’ in the terminal to create a document data structure called Text-Cube. This creates a collection of documents
     (PMIDs) for each category. A single document (PMID) may fall under multiple categories, (see Table 3A, Table 3B, Figure 6A and Figure
     7A).
  6. Once Text-Cube creation step is completed, make sure that following data files are saved in the ‘data’ directory: (1) a cell to PMID table as
     “textcube_cell2pmid.json”, (2) a PMID to cell mapping table as “textcube_pmid2cell.json”, (3) a collection of all descendant MeSH terms for a
     cell as “meshterms_per_cat.json” (4) Text-Cube data statistics as “textcube_stat.txt”.
  7. Go to the ‘log’ directory to read the log messages in ‘textcube_log.txt’ in case this process fails. If the process is completed successfully, the
     debugging messages of the Text-Cube creation will be printed out in the log file.

7. Entity count
  1. Create user-defined entities (e.g., protein names, genes, chemicals). Put one entity and its abbreviations in a single line separated by “|”.
     Save the entity file as ‘entities.txt’ in the ‘input’ directory. A sample of entities can be found in Table 4.

Copyright © 2019 Creative Commons Attribution-NonCommercial-NoDerivs 3.0 Unported                         February 2019 | 144 | e59108 | Page 3 of 14
License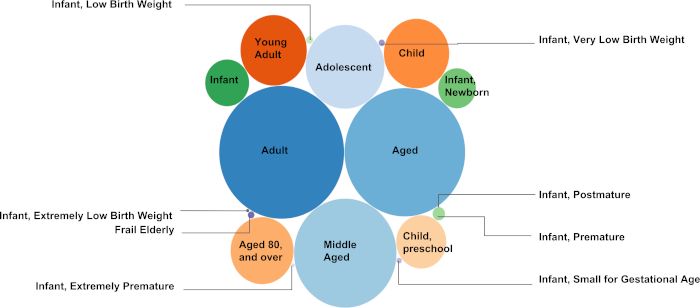
Journal of Visualized Experiments www.jove.com
2. Make sure that Elasticsearch server is running. Otherwise, go to step 5.2 and 5.3 to restart the Elasticsearch server. It is expected to have an
indexed database called ‘pubmed’ in your Elasticsearch server which was established in step 5.
3. Make sure that ‘textcube_pmid2cell.json’ is in the ‘data’ directory.
4. Type ‘python run_entitycount.py’ in the terminal to perform Entity Count operation. This searches the documents from the indexed database
and counts the entity in each document as well as collects the PMIDs in which entities were found.
5. Once the Entity Count is completed, make sure that the final results are saved as ‘entitycount.txt’ and ‘entityfound_pmid2cell.json’ in the ‘data’
directory.
6. Go to the ‘log’ directory to read the log messages in ‘entitycount_log.txt’ in case this process fails. If the process is completed successfully,
the debugging messages of the Entity Count will be printed out in the log file.
8. Metadata update
1. Make sure that all input data (‘entitycount.txt’, ‘textcube_pmid2cell.json’, ‘entityfound_pmid2cell.txt’) are in the ‘data’ directory. These are the
input data for Metadata Update.
2. Type ‘python run_metadata_update.py’ in the terminal to update the metadata. This prepares a collection of metadata (e.g., cell name,
associated MeSH, PMIDs) representing each text document in the cell. A sample of Text-Cube metadata is presented in Table 3A and Table
3B.
3. Once the Metadata Update is completed, make sure that ‘metadata_pmid2pcount.json’ and ‘metadata_cell2pmid.json’ files are saved in ‘data’
directory.
4. Go to the ‘log’ directory to read the log messages in ‘metadata_update_log.txt’ in case this process fails. If the process is completed
successfully, the debugging messages of the metadata update will be printed out in the log file.
9. CaseOLAP score calculation
1. Make sure that ‘metadata_pmid2pcount.json’ and ‘metadata_cell2pmid.json’ files are present in the ‘data’ directory. These are the input data
for score calculation.
2. Type ‘python run_caseolap_score.py’ in the terminal to perform CaseOLAP score calculation. This calculates the CaseOLAP score of the
entities based on user-defined categories. The CaseOLAP score is the product of Integrity, Popularity, and Distinctiveness.
3. Once the score computation is completed, make sure that this saves the results in multiple files (e.g., popularity as ‘pop.csv’, distinctiveness
as ‘dist.csv’, CaseOLAP score as ’caseolap.csv’), in the ‘result’ directory. The summary of the CaseOLAP score calculation is also presented
in Table 5.
4. Go to the ‘log’ directory to read the log messages in ‘caseolap_score_log.txt’ in case this process fails. If the process is completed
successfully, the debugging messages of the CaseOLAP score calculation will be printed out in the log file.
Representative Results
To produce sample results, we implemented the CaseOLAP algorithm in two subject headings/descriptors: "Age Groups" and "Nutritional and
Metabolic Diseases" as use cases.
Age Groups. We selected all 4 subcategories of "Age Groups" (infant, child, adolescent, and adult) as cells in a Text-Cube. The obtained
metadata and statistics are shown in Table 3A. The comparison of the number of documents among the Text-Cube cells is displayed
in Figure 6A. Adult contains 172,394 documents which is the highest number across all cells. The adult and adolescent subcategories
have the highest number of shared documents (26,858 documents). Notably, these documents included the entity of our interest only (i.e.,
mitochondrial proteins). The Venn diagram in Figure 6B represents the number of entities (i.e., mitochondrial proteins) found within each
cell, and within multiple overlaps among the cells. The number of proteins shared within all Age Groups subcategories is 162. The adult
subcategory depicts the highest number of unique proteins (151) followed by child (16), infant (8) and adolescent (1). We calculated the
protein-age group association as a CaseOLAP score. The top 10 proteins (based on their average CaseOLAP score) associated with infant,
child, adolescent and adult subcategories are Sterol 26-hydroxylase, Alpha-crystallin B chain, 25-hydroxyvitamin D-1 alpha-hydroxylase,
Serotransferrin, Citrate synthase, L-seryl-tRNA, Sodium/potassium-transporting ATPase subunit alpha-3, Glutathione S-transferase omega-1,
NADPH:adrenodoxin oxidoreductase, and Mitochondrial peptide methionine sulfoxide reductase (shown in Figure 6C). The adult subcategory
displays 10 heatmap cells with a higher intensity compared to the heatmap cells of the adolescent, child and infant subcategory, indicating that
the top 10 mitochondrial proteins exhibit the strongest associations to the adult subcategory. The mitochondrial protein Sterol 26-hydroxylase has
high associations in all age subcategories which is demonstrated by heatmap cells with higher intensities compared to the heatmap cells of the
other 9 mitochondrial proteins. The statistical distribution of the absolute difference in the score between two groups shows the following range
for mean difference with a 99% confidence interval: (1) the mean difference between 'ADLT' and 'INFT' lies in the range (0.029 to 0.042), (2) the
mean difference between 'ADLT' and 'CHLD' lies in the range (0.021 to 0.030), (3) the mean difference between 'ADLT' and 'ADOL' lies in the
range (0.020 to 0.029), (4) the mean difference between 'ADOL' and 'INFT' lies in the range (0.015 to 0.022), (5) the mean difference between
'ADOL' and 'CHLD' lies in the range (0.007 to 0.010), (6) the mean difference between 'CHLD' and 'INFT' lies in the range (0.011 to 0.016).
Copyright © 2019 Creative Commons Attribution-NonCommercial-NoDerivs 3.0 Unported February 2019 | 144 | e59108 | Page 4 of 14
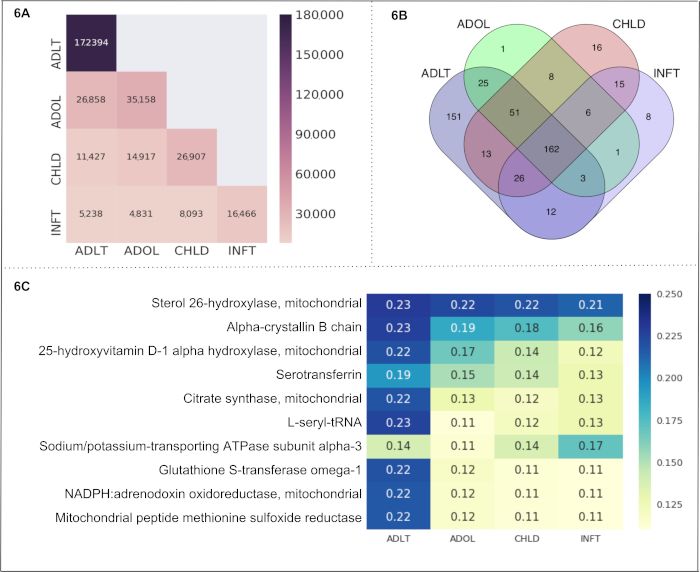
LicenseJournal of Visualized Experiments www.jove.com Nutritional and Metabolic Diseases. We selected 2 subcategories of "Nutritional and Metabolic Diseases" (i.e., metabolic disease and nutritional disorders) to create 2 cells in a Text-Cube. The obtained metadata and statistics are shown in Table 3B. The comparison of the number of documents among the Text-Cube cells is displayed in Figure 7A. The subcategory metabolic disease contains 54,762 documents followed by 19,181 documents in nutritional disorders. The subcategories metabolic disease and nutritional disorders have 7,101 shared documents. Notably, these documents included the entity of our interest only (i.e., mitochondrial proteins). The Venn diagram in Figure 7B represents the number of entities found within each cell, and within multiple overlaps between the cells. We calculated the protein-"Nutritional and Metabolic Diseases" association as a CaseOLAP score. The top 10 proteins (based on their average CaseOLAP score) associated with this use case are Sterol 26-hydroxylase, Alpha-crystallin B chain, L-seryl-tRNA, Citrate synthase, tRNA pseudouridine synthase A, 25-hydroxyvitamin D-1 alpha-hydroxylase, Glutathione S-transferase omega-1, NADPH: adrenodoxin oxidoreductase, Mitochondrial peptide methionine sulfoxide reductase, Plasminogen activator inhibitor 1 (shown in Figure 7C). More than half (54%) of all proteins are shared between the subcategories metabolic diseases and nutritional disorders (397 proteins). Interestingly, almost half (43%) of all associated proteins in the metabolic disease subcategory are unique (300 proteins), whereas nutritional disorders exhibit only a few unique proteins (35). Alpha-crystallin B chain displays the strongest association to the subcategory metabolic diseases. Sterol 26-hydroxylase, mitochondrial displays the strongest association in the nutritional disorders subcategory, indicating that this mitochondrial protein is highly relevant in studies describing nutritional disorders. The statistical distribution of the absolute difference in the score between two groups 'MBD' and 'NTD' shows the range (0.046 to 0.061) for the mean difference as a 99% confidence interval. Figure 1. Dynamic view of the CaseOLAP Workflow. This figure represents the 5 major steps in the CaseOLAP workflow. In step 1, the workflow begins by downloading and extracting textual documents (e.g., from PubMed). In step 2, extracted data are parsed to create a data dictionary for each document as well as a MeSH to PMID mapping. In step 3, data indexing is conducted to facilitate fast and efficient entity search. In step 4, implementation of user-provided category information (e.g., root MeSH for each cell) is carried out to construct a Text-Cube. In step 5, the entity count operation is implemented over index data to calculate the CaseOLAP scores. These steps are repeated in an iterative manner to update the system with the latest information available in a public database (e.g., PubMed). Please click here to view a larger version of this figure. Copyright © 2019 Creative Commons Attribution-NonCommercial-NoDerivs 3.0 Unported February 2019 | 144 | e59108 | Page 5 of 14 License
Journal of Visualized Experiments                                                                                       www.jove.com

  Figure 2. Technical Architecture of the CaseOLAP Workflow. This figure represents the technical details of the CaseOLAP workflow. Data
  from the PubMed repository are obtained from the PubMed FTP server. The user connects to the cloud server (e.g., AWS connectivity) via their
  device and creates a Download Pipeline which downloads and extracts the data to a local repository in the cloud. Extracted data are structured,
  verified, and brought to a proper format with a Data Parsing Pipeline. Simultaneously, a MeSH to PMID mapping table is created during the
  parsing step, which is used for Text-Cube construction. Parsed data are stored as a JSON like key-value dictionary format with document
  metadata (e.g., PMID, MeSH, publishing year). The Indexing step further improves the data by implementing Elasticsearch to handle bulk
  data. Next, the Text-Cube is created with user-defined categories by implementing MeSH to PMID mapping. When the Text-Cube formation
  and Indexing steps are completed, an entity count is conducted. Entity count data are implemented to the Text-Cube metadata. Finally, the
  CaseOLAP score is calculated based on the underlying Text-Cube structure. Please click here to view a larger version of this figure.

  Figure 3. A sample of a parsed document. A sample of parsed data is presented in this figure. The parsed data are arranged as a key-
  value pair which is compatible with indexing and document metadata creation. In this figure, a PMID (e.g., "25896987") is serving as a key
  and collection of associated information (e.g., Title, Journal, Publishing date, Abstract, MeSH, Substances, Department and Location) are as
  value. The very first application of such document metadata is the construction of MeSH to PMID mapping (Figure 5 and Table 2), which is later
  implemented to create the Text-Cube and to calculate the CaseOLAP score with user-provided entities and categories. Please click here to view
  a larger version of this figure.

Copyright © 2019 Creative Commons Attribution-NonCommercial-NoDerivs 3.0 Unported                    February 2019 | 144 | e59108 | Page 6 of 14
License
Journal of Visualized Experiments                                                                                    www.jove.com

  Figure 4. A sample of a MeSH tree. The 'Age Groups' MeSH tree is adapted from the tree data structure available in the NIH database (MeSH
  Tree 2018, ). MeSH descriptors are implemented with their node IDs (e.g., Persons [M01], Age Groups
  [M01.060], Adolescent [M01.060.057], Adult [M01.060.116], Child [M01.060.406], Infant [M01.060.703]) to collect the documents relevant to a
  specific MeSH descriptor (Table 3A). Please click here to view a larger version of this figure.

  Figure 5. MeSH to PMID mapping in Age Groups. This figure presents the number of text documents (each linked with a PMID) collected
  under the MeSH descriptors in "Age Groups" as a bubble plot. The MeSH to PMID mapping is generated to provide the exact number of
  documents collected under the MeSH descriptors. A total number of 3,062,143 unique documents were collected under the 18 descendent
  MeSH descriptors (see Table 2). The higher the number of PMIDs selected under a specific MeSH descriptor, the larger the radius of the bubble
  representing the MeSH descriptor. For instance, the highest number of documents were collected under the MeSH descriptor "Adult" (1,786,371
  documents), whereas the fewest number of text documents were collected under the MeSH descriptor "Infant, Postmature" (62 documents).
  An additional example of MeSH to PMID mapping is given for "Nutritional and Metabolic Diseases" (https://caseolap.github.io/mesh2pmid-
  mapping/bubble/meta.html). A total number of 422,039 unique documents were collected under the 361 descendent MeSH descriptors
  in "Nutritional and Metabolic Diseases". The highest number of documents were collected under the MeSH descriptor "Obesity" (77,881
  documents) followed by "Diabetes Mellitus, Type 2" (61,901 documents), whereas "Glycogen Storage Disease, Type VIII" exhibited the fewest
  number of documents (1 document). A related table is also available online at (https://github.com/CaseOLAP/mesh2pmid-mapping/blob/master/
  data/diseaseall.csv). Please click here to view a larger version of this figure.

Copyright © 2019 Creative Commons Attribution-NonCommercial-NoDerivs 3.0 Unported                  February 2019 | 144 | e59108 | Page 7 of 14
License
Journal of Visualized Experiments                                                                                       www.jove.com

  Figure 6. "Age Groups" as a use case. This figure presents the results from a use case of the CaseOLAP platform. In this instance, protein
  names and their abbreviations (see sample in Table 4) are implemented as entities and "Age Groups" including the cells: infant (INFT), child
  (CHLD), adolescent (ADOL), and adult (ADLT), are implemented as subcategories (see Table 3A). (A) Number of documents in "Age
  Groups": This heat map shows the number of documents distributed across the cells of "Aged Groups" (for details on the Text-Cube creation
  see Protocol 4 and Table 3A). A higher number of documents is presented with a darker intensity of the heatmap cell (see the scale). A single
  document may be included in more than one cell. The heatmap presents the number of documents within a cell along the diagonal position
  (e.g., ADLT contains 172,394 documents which is the highest number across all cells). The nondiagonal position represents the number of
  documents falling under two cells (e.g., ADLT and ADOL have 26,858 shared documents). (B). Entity count in "Age Groups": The Venn
  diagram represents the number of proteins found in the four cells representing "Age Groups" (INFT, CHLD, ADOL, and ADLT). The number of
  proteins shared within all cells is 162. The age group ADLT depicts the highest number of unique proteins (151) followed by CHLD (16), INFT
  (8) and ADOL (1). (C) CaseOLAP score presentation in "Age Groups": The top 10 proteins with the highest average CaseOLAP scores in
  each group are presented in a heat map. A higher CaseOLAP score is presented with a darker intensity of the heatmap cell (see the scale). The
  protein names are displayed on the left column and the cells (INFT, CHLD, ADOL, ADLT) are displayed along the x-axis. Some proteins show a
  strong association to a specific age group (e.g., Sterol 26-hydroxylase, alpha-crystallin B chain and L-seryl-tRNA have strong associations with
  ADLT, whereas Sodium/potassium-transporting ATPase subunit alpha-3 has a strong association with INFT). Please click here to view a larger
  version of this figure.

Copyright © 2019 Creative Commons Attribution-NonCommercial-NoDerivs 3.0 Unported                    February 2019 | 144 | e59108 | Page 8 of 14
License
Journal of Visualized Experiments                                                                                      www.jove.com

  Figure 7. "Nutritional and Metabolic Diseases" as a use case: This figure presents the results from another use case of the CaseOLAP
  platform. In this instance, protein names and their abbreviations (see sample at Table 4) are implemented as entities and "Nutritional and
  Metabolic Disease" including the two cells: metabolic disease (MBD) and nutritional disorders (NTD) are implemented as subcategories (see
  Table 3B). (A). Number of documents in "Nutritional and Metabolic Diseases": This heatmap depicts the number of text documents in the
  cells of "Nutritional and Metabolic Diseases" (for details on the Text-Cube creation see Protocol 4 and Table 3B). A higher number of documents
  is presented with a darker intensity of the heatmap cell (see scale). A single document may be included in more than one cell. The heatmap
  presents the total number of documents within a cell along the diagonal position (e.g., MBD contains 54,762 documents which is the highest
  number across the two cells). The nondiagonal position represents the number of documents shared by the two cells (e.g., MBD and NTD
  have 7,101 shared documents). (B). Entity Count in "Nutritional and Metabolic Diseases": The Venn diagram represents the number of
  proteins found in the two cells representing "Nutritional and Metabolic Diseases" (MBD and NTD). The number of proteins shared within the two
  cells is 397. The MBD cell depicts 300 unique proteins, and the NTD cell depicts 35 unique proteins. (C). CaseOLAP score presentation in
  "Nutritional and Metabolic Diseases": The top 10 proteins with the highest average CaseOLAP scores in "Nutritional and Metabolic Diseases"
  are presented in a heat map. A higher CaseOLAP score is presented with a darker intensity of the heatmap cell (see scale). The protein names
  are displayed on the left column and cells (MBD and NTD) are displayed along the x-axis. Some proteins show a strong association to a specific
  disease category (e.g., alpha-crystallin B chain has a high association with metabolic disease and sterol 26-hydroxylase has a high association
  with nutritional disorders). Please click here to view a larger version of this figure.

Copyright © 2019 Creative Commons Attribution-NonCommercial-NoDerivs 3.0 Unported                   February 2019 | 144 | e59108 | Page 9 of 14
License
Journal of Visualized Experiments                                                                                     www.jove.com

Time spent (percentage of Steps in the CaseOLAP           Algorithm and Data            Complexity of Algorithm        Details of the Steps
total time)               platform                        Structure of the              and Data Structure
                                                          CaseOLAP platform
40%                             Downloading and           Iteration and tree parsing    Iteration with nested loop     The Downloading pipeline
                                Parsing                   algorithms                    and constant multiplication:   iterates each procedure
                                                                                        O(n^2), O(log n). Where ‘n’    over multiple files. Parsing
                                                                                        is no of iterations.           of a single document runs
                                                                                                                       each procedure over the
                                                                                                                       tree structure of raw XML
                                                                                                                       data.
30%                             Indexing, Searching and   Iteration, Search algorithms Complexity related to           Documents are indexed
                                Text Cube Creation        by Elasticsearch (sorting,   Elasticsearch (https://         by implementing the
                                                          Lucene index, priority       www.elastic.co/)                iteration process over the
                                                          queues, finite state                                         data dictionary. The Text-
                                                          machines, bit twiddling                                      Cube creation implements
                                                          hacks, regex queries)                                        document meta-data and
                                                                                                                       user-provided category
                                                                                                                       information.
30%                             Entity Counting and       Iteration in Integrity,       O(1), O(n^2), multiple         Entity count operation lists
                                CaseOLAP Calculation      Popularity, Distinctiveness   complexities related           the documents and make
                                                          calculation                   to caseOLAP Score              an count operation over
                                                                                        calculation based on           the list. The entity count
                                                                                        iteration types.               data is used to calculate
                                                                                                                       CaseOLAP score.

  Table 1. Algorithms and Complexities. This table presents information on the time spent (percentage of total time spent) on the procedures
  (e.g., downloading, parsing), data structure and details about the implemented algorithms in the CaseOLAP platform. CaseOLAP implements the
  professional indexing and search application called Elasticsearch. Additional information on complexities related to Elasticsearch and internal
  algorithms can be found at (https://www.elastic.co).

MeSH descriptors                                                         Number of of PMIDs collected
Adult                                                                    1,786,371
Middle Aged                                                              1,661,882
Aged                                                                     1,198,778
Adolescent                                                               706,429
Young Adult                                                              486,259
Child                                                                    480,218
Aged, 80 and over                                                        453,348
Child, Preschool                                                         285,183
Infant                                                                   218,242
Infant, Newborn                                                          160,702
Infant, Premature                                                        17,701
Infant, Low Birth Weight                                                 5,707
Frail Elderly                                                            4,811
Infant, Very Low Birth Weight                                            4,458
Infant, Small for Gestational Age                                        3,168
Infant, Extremely Premature                                              1,171
Infant, Extremely Low Birth Weight                                       1,003
Infant, Postmature                                                       62

  Table 2. MeSH to PMID mapping statistics. This table presents all descendant MeSH descriptors from “Age Groups” and their number of
  collected PMIDs (text documents). The visualization of these statistics is presented in Figure 5.

Copyright © 2019 Creative Commons Attribution-NonCommercial-NoDerivs 3.0 Unported                  February 2019 | 144 | e59108 | Page 10 of 14
License
Journal of Visualized Experiments www.jove.com
A Infant (INFT) Child (CHLD) Adolescent (ADOL) Adult (ADLT)
MeSH root ID M01.060.703 M01.060.406 M01.060.057 M01.060.116
Number of descendant 9 2 1 6
MeSH descriptors
Number of PMIDs 16,466 26,907 35,158 172,394
selected
Number of entities found 233 297 257 443
B Metabolic Diseases (MBD) Nutritional Disorders
(NTD)
MeSH root ID C18.452 C18.654
Number of descendant 308 53
MeSH
descriptors
Number of PMIDs 54,762 19,181
collected
Number of entities found 697 432
Table 3. Text-Cube Metadata. A tabular view of Text-Cube metadata is presented. The tables provide information about the categories and
MeSH descriptor roots and descendants, which are implemented to collect the documents in each cell. The table also provides the statistics
of the collected documents and entities. (A) “Age Groups”: This is a tabular display of “Age Groups” including infant (INFT), child (CHLD),
adolescent (ADOL), and adult (ADLT) and their MeSH root IDs, number of descendant MeSH descriptors, number of selected PMIDs and
number of found entities. (B) “Nutritional and Metabolic Diseases”: This is a tabular display of “Nutritional and Metabolic Diseases” including
metabolic disease (MBD) and nutritional disorders (NTD) with their MeSH root IDs, number of descendant MeSH descriptors, number of selected
PMIDs and the number of found entities.
Protein names and Synonyms Abbreviations
N-acetylglutamate synthase, mitochondrial, Amino-acid (EC 2.3.1.1)
acetyltransferase, N-acetylglutamate synthase long form; N-
acetylglutamate synthase short form; N-acetylglutamate synthase
conserved domain form]
Protein/nucleic acid deglycase DJ-1 (Maillard deglycase) (Oncogene (EC 3.1.2.-) (EC 3.5.1.-) (EC 3.5.1.124)(DJ-1)
DJ1) (Parkinson disease protein 7) (Parkinsonism-associated
deglycase) (Protein DJ-1)
Pyruvate carboxylase, mitochondrial (Pyruvic carboxylase) (EC 6.4.1.1)(PCB)
Bcl-2-binding component 3 (p53 up-regulated modulator of apoptosis) (JFY-1)
BH3-interacting domain death agonist [BH3-interacting domain death (p22 BID) (BID) (p13 BID)(p11 BID)
agonist p15 (p15 BID); BH3-interacting domain death agonist p13 ;
BH3-interacting domain death agonist p11 ]
ATP synthase subunit alpha, mitochondrial (ATP synthase F1 subunit
alpha)
Cytochrome P450 11B2, mitochondrial (Aldosterone synthase) (ALDOS) (EC 1.14.15.4) (EC 1.14.15.5)
(Aldosterone-synthesizing enzyme) (CYPXIB2) (Cytochrome
P-450Aldo) (Cytochrome P-450C18) (Steroid 18-hydroxylase)
60 kDa heat shock protein, mitochondrial (60 kDa chaperonin) (HSP-60) (Hsp60) (HuCHA60)(EC 3.6.4.9)
(Chaperonin 60) (CPN60) (Heat shock protein 60) (Mitochondrial matrix
protein P1) (P60 lymphocyte protein)
Caspase-4 (ICE and Ced-3 homolog 2) (Protease TX) [Cleaved into: (CASP-4) (EC 3.4.22.57)(ICH-2) (ICE(rel)-II) (Mih1)
Caspase-4 subunit 1; Caspase-4 subunit 2]
Table 4. Sample Entity Table. This table presents the sample of entities implemented in our two use cases: “Age Groups” and “Nutritional and
Metabolic Diseases” (Figure 6 and Figure 7, Table 3A,B). The entities include protein names, synonyms, and abbreviations. Each entity (with its
synonyms and abbreviations) is selected one by one and is passed through the entity search operation over indexed data (see protocol 3 and 5).
The search produces a list of documents which further facilitate the entity count operation.
Copyright © 2019 Creative Commons Attribution-NonCommercial-NoDerivs 3.0 Unported February 2019 | 144 | e59108 | Page 11 of 14
LicenseJournal of Visualized Experiments www.jove.com
Quantities User Defined Calculated Equation of the quantity Meaning of the quantity
Integrity Yes No Integrity of user defined Represents a meaningful
entities considered to be phrase. Numerical value
1.0. is 1.0 when it is already an
established phrase.
Popularity No Yes Popularity equation in Based on term frequency
Figure 1 (Workflow and of the phrase within a
Algorithm) from reference cell. Normalized by total
5, 'Materials and Methods' term frequency of the cell.
section. Increase in term frequency
has diminishing result.
Distinctiveness No Yes Distinctiveness equation Based on term frequency
in Figure 1 (Workflow and and document frequency
Algorithm) from reference within a cell and across
5, 'Materials and Methods' the neighbouring cells.
section. Normalized by total term
frequency and document
frequency. Quantitatively,
it is the probability that
a phrase is unique in a
specific cell.
CaseOLAP score No Yes CaseOLAP score equation Based on Integrity,
in Figure 1 (Workflow and Popularity, and
Algorithm) from reference Distinctiveness. Numerical
5, 'Materials and Methods' value always falls within
section. 0 to 1. Quantitatively
the CaseOLAP score
represents the phrase-
category association
1
Table 5. CaseOLAP equations: The CaseOLAP algorithm was developed by Fangbo Tao and Jiawei Han et al. in 2016 . Briefly, this table
presents the CaseOLAP score calculation consisting of three components: integrity, popularity, and distinctiveness, and their associated
mathematical meaning. In our use cases, the integrity score for proteins is 1.0 (the maximum score) because they stand as established entity
names. The CaseOLAP scores in our use cases can be seen in Figure 6C and Figure 7C.
Discussion
We have demonstrated that the CaseOLAP algorithm can create a phrase based quantitative association to a knowledge-based category over
large volumes of textual data for extraction of meaningful insights. Following our protocol, one can build the CaseOLAP framework to create a
desired Text-Cube and quantify entity-category associations through CaseOLAP score calculation. The obtained raw CaseOLAP scores can
be taken to integrative analyses including dimensionality reduction, clustering, temporal and geographical analysis, as well as the creation of a
graphical database which enables semantic mapping of the documents.
Applicability of the algorithm. Examples of user-defined entities, other than proteins, could be a list of gene names, drugs, specific signs
and symptoms including their abbreviations and synonyms. Furthermore, there are many choices for category selection to facilitate specific
user-defined biomedical analyses (e.g., Anatomy [A], Discipline and Occupation [H], Phenomena and Processes [G]). In our two use cases,
all scientific publications and their textual data are retrieved from the MEDLINE database using PubMed as the search engine, both managed
by the National Library of Medicine. However, the CaseOLAP platform may be applied to other databases of interest containing biomedical
documents with textual data such as the FDA Adverse Event Reporting System (FAERS). This is an open database containing information on
medical adverse events and medication error reports submitted to FDA. In contrast to MEDLINE and FAERS, databases in hospitals containing
electronic health records from patients are not open to the public and are restricted by the Health Insurance Portability and Accountability Act
known as HIPAA.
1
CaseOLAP algorithm has been successfully applied to the different types of data (e.g., news articles) . The implementation of this algorithm
5
in biomedical documents has been made in 2018 . The requirements for applicability of CaseOLAP algorithm is that each of the documents
should be assigned with keywords associated with the concepts (e.g., MeSH descriptors in biomedical publications, keywords in news articles).
6,7
If keywords are not found, one can apply Autophrase to collect top representative phrases and build the entity list before implementing our
protocol. Our protocol does not provide the step to perform Autophrase.
8,9,10 2,3,4
Comparison with other algorithms. The concept of using a Data-Cube and a Text-Cube has been evolving since 2005 with new
11,12,13,14,15
advancements to make data mining more applicable. The concept of Online Analytical Processing (OLAP) in data mining and
business intelligence goes back to 1993. OLAP, in general, aggregates the information from multiple systems, and stores it in a multi-dimensional
format. There are different types of OLAP systems implemented in data mining. For example (1) Hybrid Transaction/Analytical Processing
16,17 18,19 20
(HTAP) , (2) Multidimensional OLAP (MOLAP) -Cube based, and (3) Relational OLAP (ROLAP) .
Specifically, the CaseOLAP algorithm has been compared with numerous existing algorithms, specifically, with their phrase segmentation
enhancements, including TF-IDF+Seg, MCX+Seg, MCX, and SegPhrase. Moreover, RepPhrase (RP, also known as SegPhrase+) has been
Copyright © 2019 Creative Commons Attribution-NonCommercial-NoDerivs 3.0 Unported February 2019 | 144 | e59108 | Page 12 of 14
LicenseJournal of Visualized Experiments www.jove.com
compared with its own ablation variations, including (1) RP without the Integrity measure incorporated (RP No INT), (2) RP without the Popularity
measure incorporated (RP No POP), and (3) RP without the Distinctiveness measure incorporated (RP No DIS). The benchmark results are
1
shown in the study by Fangbo Tao et al. .
There are still challenges on data mining which can add additional functionality over saving and retrieving the data from the database. Context-
aware semantic Analytical Processing (CaseOLAP) systematically implements the Elasticsearch to build an indexing database of millions of
documents (Protocol 5). The Text-Cube is a document structure built over the indexed data with user-provided categories (Protocol 6). This
enhances the functionality to the documents within and across the cell of the Text-Cube and allow us to calculate term frequency of the entities
over a document and document frequency over a specific cell (Protocol 8). The final CaseOLAP score utilizes these frequency calculations
to output a final score (Protocol 9). In 2018, we implemented this algorithm to study ECM proteins and six heart diseases to analyze protein-
5
disease associations. The details of this study can be found in the study by Liem, D.A. et al. . indicating that CaseOLAP could be widely used in
the biomedical community exploring a variety of diseases and mechanisms.
Limitations of the algorithm. Phrase mining itself is a technique to manage and retrieve important concepts from textual data. While
discovering entity-category association as a mathematical quantity (vector), this technique is unable to figure out the polarity (e.g., positive or
negative inclination) of the association. One can build the quantitative summarization of the data utilizing the Text-Cude document structure with
assigned entities and categories, but a qualitative concept with microscopic granularities cannot be reached. Some concepts are continuously
evolving from past till now. The summarization presented for a specific entity-category association includes all incidences throughout the
literature. This may lack the temporal propagation of the innovation. In the future, we plan to address these limitations.
Future Applications. About 90% of the accumulated data in the world is in the unstructured text data. Finding a representative phrase and
relation to the entities embedded in the text is a very important task for the implementation of new technologies (e.g., Machine Learning,
Information Extraction, Artificial Intelligence). To make the text-data machine readable, data need to be organized in the database over which the
next layer of tools could be implemented. In the future, this algorithm can be a crucial step in making data mining more functional for the retrieval
of information and the quantification of the entity-category associations.
Disclosures
The authors have nothing to disclose.
Acknowledgments
This work was supported in part by National Heart, Lung, and Blood Institute: R35 HL135772 (to P. Ping); National Institute of General Medical
Sciences: U54 GM114833 (to P. Ping, K. Watson, and W. Wang); U54 GM114838 (to J. Han); a gift from the Hellen & Larry Hoag Foundation and
Dr. S. Setty; and the T.C. Laubisch endowment at UCLA (to P. Ping).
References
1. Tao, F., Zhuang, H. et al. Multidimensional, Phrase-Based Summarization in Text Cubes. IEEE Data Engineering Bulletin. 39, 74-84 (2016).
2. Ding, B., Zhao, B., Lin, C.X., Han, J., Zhai, C. TopCells: Keyword-based search of top-k aggregated documents in text cube. IEEE 26th
International Conference on Data Engineering (ICDE). 381-384 (2010).
3. Ding, B., et al. Efficient Keyword-Based Search for Top-K Cells in Text Cube. IEEE Transactions on Knowledge and Data Engineering. 23
(12), 1795-1810 (2011).
4. Liu, X. et al. A Text Cube Approach to Human, Social and Cultural Behavior in the Twitter Stream.Social Computing, Behavioral-Cultural
Modeling and Prediction. Lecture Notes in Computer Science. 7812 (2013).
5. Liem, D.A. et al. Phrase Mining of Textual Data to analyze extracellular matrix protein patterns across cardiovascular disease. American
Journal of Physiology-Heart and Circulatory Physiology. (2018).
6. Shang, J. et al. Automated Phrase Mining from Massive Text Corpora. IEEE Transactions on Knowledge and Data Engineering. 30 (10),
1825-1837 (2018).
7. Liu, J., Shang, J., Wang, C., Ren, X., Han, J. Mining Quality Phrases from Massive Text Corpora. Proceedings ACM-Sigmod International
Conference on Management of Data. 1729-1744 (2015).
8. Lee, S., Kim, N., Kim, J. A Multi-dimensional Analysis and Data Cube for Unstructured Text and Social Media. IEEE Fourth International
Conference on Big Data and Cloud Computing. 761-764 (2014).
9. Lin, C.X., Ding, B., Han, J., Zhu, F., Zhao, B. Text Cube: Computing IR Measures for Multidimensional Text Database Analysis. IEEE Data
Mining. 905-910 (2008).
10. Hsu, W.J., Lu, Y., Lee, Z. Q. Accelerating Topic Exploration of Multi-Dimensional Documents. Parallel and Distributed Processing Symposium
Workshops (IPDPSW). IEEE International, 1520-1527 (2017).
11. Chaudhuri, S., Dayal,U. An overview of data warehousing and OLAP technology. SIGMOD Record. 26 (1), 65-74 (1997).
12. Ravat, F., Teste, O., Tournier, R. Olap aggregation function for textual data warehouse. ICEIS - 9th International Conference on Enterprise
Information Systems, Proceedings. 151-156, (2007).
13. Ho, C.T., Agrawal, R., Megiddo, N., & Srikant, R. Range Queries in OLAP Data Cubes. SIGMOD Conference. (1997).
14. Saxena, V., Pratap, A. Olap Cube Representation for Object- Oriented Database International Journal of Software Engineering &
Applications. 3 (2) (2012).
15. Maniatis, A.S., Vassiliadis, P., Skiadopoulos, S., Vassiliou, Y. Advanced visualization for OLAP. DOLAP. (2003).
16. Bog, A., Benchmarking Transaction and Analytical Processing Systems: The Creation of a Mixed Workload Benchmark and its Application.
Springer Science & Business Media. 7-13 (2013).
Copyright © 2019 Creative Commons Attribution-NonCommercial-NoDerivs 3.0 Unported February 2019 | 144 | e59108 | Page 13 of 14
LicenseJournal of Visualized Experiments www.jove.com
17. Özcan, F., Tian, Y., Tözün, P. Hybrid Transactional/Analytical Processing: A Survey. In Proceedings of the ACM International Conference on
Management of Data (SIGMOD '17). 1771-1775 (2017).
18. Hasan, K.M.A., Tsuji, T., Higuchi, K. An Efficient Implementation for MOLAP Basic Data Structure and Its Evaluation. International Conference
on Database Systems for Advanced Applications. 288-299 (2007).
19. Nantajeewarawat, E. (eds) Advances in Databases: Concepts, Systems and Applications. DASFAA 2007. Lecture Notes in Computer
Science. 4443 (2007).
20. Shimada, T., Tsuji, T., Higuchi, K., A storage scheme for multidimensional data alleviating dimension dependency. Third International
Conference on Digital Information Management. 662-668 (2007).
Copyright © 2019 Creative Commons Attribution-NonCommercial-NoDerivs 3.0 Unported February 2019 | 144 | e59108 | Page 14 of 14
LicenseYou can also read