Explore the benefits of survey participation - 2019 Compensation Surveys - U.S - Towers Watson
←
→
Page content transcription
If your browser does not render page correctly, please read the page content below

Explore the benefits of survey participation
2019 Compensation Surveys - U.S.

                                   Participate before it’s too late!
                                   Visit us at wtwdataservices.com
Maximize your investment in survey data
Follow these guidelines throughout the job-matching and data submission process to effectively
prepare your data for a successful survey submission.
Review all definitions, descriptions and Do report:
1 changes before matching your jobs.
Individual lines of data
All possible jobs
Internal job grades and titles
Submit data for all incumbents who can be
2 matched to the survey.
All required fields/elements
Do NOT report:
Review survey methodology to ensure a
Personal data, personal ID numbers,
3 consistent alignment of jobs. employee names or initials
Average data
Contract and temporary staff not paid on
Complete ALL required fields. The more the same terms as permanent, full-time staff
4 data we receive, the more robust the results.
Apply the 80% rule:
Review your data before submitting to If you determine that 80% or more of the
5 ensure overall compliance with general job content is similar, the match may be
submission guidelines. considered a quality match.
2019 survey name Survey opens Due date* Results available
General industry executive Mid-January Late April Early August
General industry middle management, professional and support Late January Late April Late August
Energy services executive Late January Early May Late August
Energy services middle management, professional and support Early February Early May Mid-September
Energy marketing and trading Mid-February Mid-May Early October
Financial services executive Late January Mid-May Late August
Financial services middle management, professional and support Early February Mid-May Mid-September
Fintech Mid-March Late May Late October
High tech executive Late January Early May Late August
High tech middle management, professional and support Early February Early May Early September
Media executive Late February Mid-May Mid-September
Media middle management, professional and support Early March Mid-May Late September
Oil and gas Late April Mid-June Late September
Pharmaceutical and health sciences executive Mid-February Mid-May Late September
Pharmaceutical and health sciences middle management, professional
Late February Mid-May Early October
and support
Retail exective Mid-February Mid-May Mid-September
Retail middle management, professional and support Late February Mid-May Late September
Long-term incentives, policies and practices Early October
Annual incentive plan design Mid-January Early March Early July
Artificial intelligence and digital talent Early April Mid-June Late October
Sales compensation and design Mid-March Late May Late September
General industry salary budget Late April Early June Mid-September
General industry compensation policies and practices Late April Early June Early October
Global general industry long-term incentives Early March Mid-June Late October
Global pharmaceutical and health sciences long-term incentives Early March Mid-June Early November
*Data are accepted throughout the year (excluding general industry salary budget and general industry compensation policies and practices). In order for us to
provide timely results, the above due dates are strongly encouraged.
Table of contents
                                   Introduction
Join our survey participation      Why participate in our compensation surveys? .........................................................................................2

and job-matching webinars
                                   2019 surveys
for information about key
                                   General Industry Executive Compensation Survey - U.S. ...................................................................4
survey details to help you
                                   General Industry Middle Management, Professional and Support
get started.                       Compensation Survey - U.S. ..............................................................................................................................5

                                   Industry-specific compensation surveys
For more information, visit
                                       Energy Services Compensation Surveys - U.S. ..................................................................................6
wtwdataservices.com.
                                       Energy Marketing and Trading Compensation Survey - U.S. .......................................................6

                                       Financial Services Compensation Surveys - U.S. ..............................................................................6

                                       Fintech Compensation Survey - U.S. .......................................................................................................6

                                       High Tech Compensation Surveys - U.S. ...............................................................................................6

                                       Media Compensation Surveys - U.S. ........................................................................................................ 7

If you have questions, we              New for 2019! Oil and Gas Compensation Survey - U.S. .............................................................. 7
have answers.                          Pharmaceutical and Health Sciences Compensation Surveys - U.S. ...................................... 7
Our Client Care team can help          Retail Compensation Surveys - U.S. ......................................................................................................... 7
provide further information.
                                   Long-Term Incentives, Policies and Practices Report - U.S. ..............................................................8
Reach out to us at
                                   New for 2019! Annual Incentive Plan Design Survey - U.S. ...............................................................8
wtwusdata@willistowerswatson.com
or +1 800 645 5771.                Artificial Intelligence and Digital Talent Compensation Survey - U.S. ...........................................9

                                   New for 2019! Sales Compensation and Design Survey - U.S. .......................................................9

                                   General Industry Salary Budget Survey - U.S. ........................................................................................10

                                   General Industry Compensation Policies and Practices Survey - U.S. .......................................10

                                   Global General Industry Long-Term Incentives Survey .......................................................................11

                                   Global Pharmaceutical and Health Sciences Long-Term Incentives Survey ...........................11

                                   Additional support
                                   Our methodology ..................................................................................................................................................12

                                   Flexible reporting options .................................................................................................................................14

                                   Willis Towers Watson Compensation Software .....................................................................................15

                                   2019 survey report pricing ...............................................................................................................................16

                                                                                                                                                  2019 Compensation Surveys - U.S.                   1
Why participate in our
compensation surveys?
Simply put: to stay ahead of the game. By participating in our compensation surveys and purchasing
the results, you’ll gain access to the decision-quality data you need for designing a viable — and
competitive — compensation program.
Fair, competitive pay influences whether employees Our compensation surveys offer:
join or leave an organization. Ensure your organization’s
Proven methodology
compensation plans appeal to high-value talent to drive
Straightforward leveling methodology for matching
business results.
incumbents
Our diverse portfolio of compensation planning offerings is
Easy-to-understand definitions
designed to fit varying budgets and needs, providing both
Universal job coding across Willis Towers Watson surveys
participants and nonparticipants with a range of options for globally
accessing survey data and reports.
Intuitive web technology
Access to our data will help you: Fast and easy access to the data
Capabilities to export data to Excel
Design competitive compensation programs to attract,
retain, motivate and engage your workforce.
Easy-to-understand data representations
Develop and administer pay structures that align with your
Customized reports specific to your business needs
organization’s goals.
Rigorous quality
Determine the value of critical-skill and unique jobs to boost
Individualized sessions with each participant to review data,
your organization’s competitive advantage.
including position matches for your company
Reward employees effectively to improve performance and
Experienced data consultants
productivity.
The most advanced error-checking technology available
Long-term incentive (LTI) expertise
Participation is easy Detailed total direct compensation data for each position
Multiple valuation methodologies to choose from
1. Access the Participation Center tab at
wtwdataservices.com to download survey
Market data accessible by position or salary range
submission material.
Trends in plan design and administration practices
2. Complete the data submission workbook.
3. Submit your data and order the report.
2 wtwdataservices.com +1 800 645 5771
Legend of terms:
Feature
Participants Participants range from small to large companies; our surveys are designed to meet your needs no matter
what your size.
Industries Surveys are industry-specific as well as general industry. Industry-specific surveys cover the following industries:
energy services, energy marketing and trading, financial services, fintech, high tech, media, oil and gas,
pharmaceutical and health sciences, and retail.
Executive jobs General industry and industry-specific surveys use a benchmark methodology and include more than 170
cross-industry benchmark jobs and up to 250 industry-specific benchmark jobs.
Nonexecutive jobs Middle management, professional and support levels and disciplines bundled by industry include as many as
100 functions and more than 1,000 disciplines.
Long-term incentive (LTI) values Survey reports present LTI eligibility and values by job and pay level, and offer multiple LTI valuation methodologies.
Accessibility Survey reports are available to participants and nonparticipants.
Output options Custom (unlimited peer groups including publicly disclosed data) and Standard reports are available. Custom
reports are presented with all Standard report features and additional customization capabilities.
Covering all employee levels and industry-specific roles, our survey data are segmented by these elements:
General Energy Energy Financial Fintech High Media Oil Pharmaceutical Retail Artificial Sales
Industry Services Marketing Services Tech and and Health Intelligence Compensation
and Gas Sciences and Digital and Design
Trading Talent
Geographic area
• • • • • • • • • • •
Industry
• • • •
Organization
unit (corporate/
• • • • • • • • • • • •
noncorporate)
Organization
unit and revenue
• • • • • • • • • • •
Revenue
• • • • • • • • • • •
Highest paid
• • • • • •
Additional
industry-specific
• • • • • •
segmentation*
*See individual product page for industry-specific segmentation
Compensation elements are reported on:
Base salary
Actual and target bonus
Long-term incentive expected values
Midpoints
Total annual compensation
Total direct compensation
2019 Compensation Surveys - U.S. 3
General Industry Executive Compensation Survey - U.S.
How will the survey results help you?
See page 3 for data elements and segmentation
Effective leaders are key to your organization’s future success reported.
and growth. To attract and keep the best, use the results from
Visit wtwdataservices.com for a complete list
this report to ensure that their pay is on point.
of functions and executive benchmarks surveyed,
and a list of our 2018 survey participants.
2018 survey results snapshot
Participation is easy. Simply follow the steps
1,500+ participating organizations on page 2 to submit your data.
60,000+ incumbents reported Save the date! Don’t miss important survey
170+ executive benchmark positions submission deadline dates listed on inside cover.
40+ functions
Reporting options
Survey results are available in two reporting options: Did you know?
Total Direct Compensation A significantly higher portion
Results are available only to participants. of a CEO’s total direct
Gain all the benefits from the total direct compensation compensation package at
option, which includes LTI values by job and salary range a for-profit organization
for all your executives. is derived from long-term
incentives compared with
Total Annual Compensation
Results are available to both participants and
that of other executives.
nonparticipants.
According to the 2018 General Industry
Acquire robust pay data minus the long-term incentive Executive Compensation Survey Report - U.S.
values.
For a more detailed explanation of the flexible reporting
options offered, visit page 14.
Also consider:
Willis Towers Watson offers an exclusive Global Executive compensation consultant — to help you submit data and
Data Member program. Submit data for all of your interpret survey results.
executive jobs in a single global data submission workbook.
Contact our Client Care team at +1 800 645 5771 or
Benefit from exclusive global purchasing options, a wtwusdata@willistowerswatson.com for more details
25% discount on select reports and a dedicated survey on our global executive survey offerings and global
team — comprised of a data specialist and an executive executive data membership program and discounts.
4 wtwdataservices.com +1 800 645 5771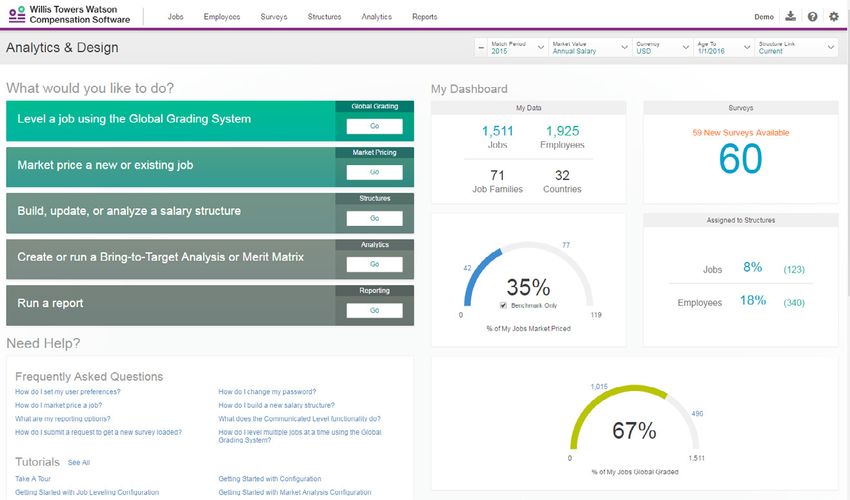
General Industry Middle Management, Professional and Support
Compensation Survey - U.S.
How will the survey results help you? See page 3 for data elements and segmentation
Tap into data that cover nearly all positions in your reported.
organization, and draw and retain the talent you need to Visit wtwdataservices.com for a complete list
meet business demands. of functions and disciplines surveyed, and a list of
our 2018 survey participants.
2018 survey results snapshot Participation is easy. Simply follow the steps
1,600+ participating organizations on page 2 to submit your data.
More than 3.7 million incumbents reported Save the date! Don’t miss important survey
submission deadline dates listed on inside cover.
420 disciplines
45 functions
Reporting options
Results are available in both Total Direct Compensation
Consider this:
and Total Annual Compensation.
The West Coast region
We offer the flexibility of purchasing the complete results
continues to have the
or individual reports by job level and job function.
highest geographical
Job-level reports differential for both base
Office and business support salary (104.8%) and
Professional (administrative and sales) total annual compensation (103.3%) when
Professional (technical and operations)
compared with the national average.
Supervisory and middle management According to the 2018 General Industry Middle Management,
Professional and Support Compensation Survey Report - U.S.
Technical support and production
Job-function reports
Accounting and finance
Engineering, design and technical specialty
Human resources
Information technology
Sales, marketing and communications
2019 Compensation Surveys - U.S. 5
Industry-specific compensation surveys
At a glance
Need industry-specific data? Participate in our industry-specific surveys and benefit from a deeper dive
into jobs and functions tailored to your industry requirements.
Contact us at wtwusdata@willistowerswatson.com for more information.
2018 survey results snapshot
Energy Services Executive Energy Services Middle Management,
Professional and Support
120+ participating organizations
4,100+ incumbents reported
140+ participating organizations
185+ executive benchmark positions in 53 functions,
233,000+ incumbents reported
including functions unique to the energy services
59 functions and 550+ disciplines, including those
industry as well as those common to all industries unique to the energy services industry as well as
those common to all industries
Energy Marketing and Trading
Data segmented by nuclear/nonnuclear, in addition to
the data segments presented on page 3
47 participating organizations
Close to 5,000 incumbents reported
20 executive benchmark positions and 54 middle management and professional
disciplines unique to energy marketing and trading in 11 functions
Data segmented by type of commodity, and gross trading and marketing
revenues, in addition to the data segments presented on page 3
Financial Services Executive Financial Services Middle Management,
Professional and Support
230+ participating organizations
8,500+ incumbents reported
270+ participating organizations
180+ executive benchmark positions in 29 functions, 560,000+ incumbents reported
including functions unique to the financial services
99 functions and up to 700 disciplines, including
industry as well as those common to all industries those unique to the financial services industry as well
Data segmented by assets, in addition to the data as those common to all industries
segments presented on page 3
Data segmented by assets, in addition to the data
segments presented on page 3
Sub-industries: asset-based finance, asset management, corporate banking, insurance, private banking/
wealth management retail banking, securities operations, transaction services
Fintech
60 participating organizations
120+ executive benchmark positions in 34 functions
14,000+ incumbents reported
360+ middle management and professional disciplines in 61
functions
High Tech Executive High Tech Middle Management, Professional
and Support
130+ participating organizations
13,500+ incumbents reported
170+ participating organizations
190+ executive benchmark positions in 42
More than 1 million incumbents reported
functions, including functions unique to the high-
49 functions and 570+ disciplines, including those
tech industry as well as those common to all unique to the high-tech industry as well as those
industries common to all industries
6 wtwdataservices.com +1 800 645 5771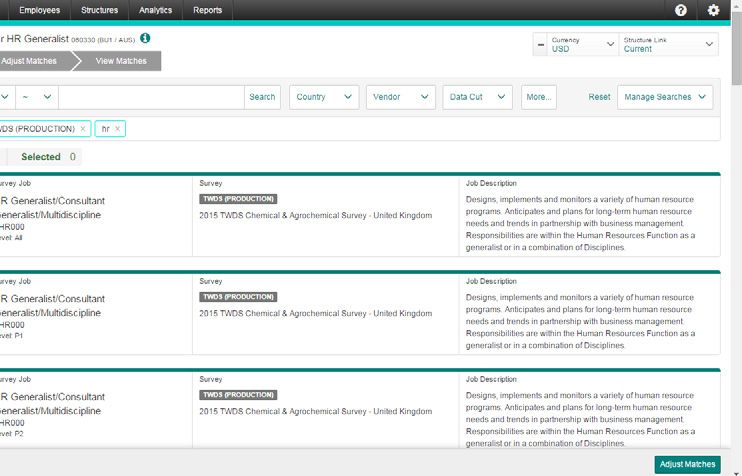
Participation is easy. Simply follow the steps
on page 2 to submit your data.
Media Executive Media Middle Management, Professional and
Support
75+ participating organizations
3,100+ incumbents reported
70+ participating organizations
145+ executive benchmark positions in 43
448,000+ incumbents reported
functions, including functions unique to the media
50 functions and 450+ disciplines, including those
industry as well as those common to all industries unique to the media industry as well as those common
to all industries
Data segmented by primary medium, in addition to the data segments presented on page 3
Oil and Gas
NEW
for
26 executive benchmark positions in 17 functions,
300 middle management, professional and 2019
including functions unique to the oil and gas support disciplines in 43 functions, including
industry as well as those common to all industries functions unique to the oil and gas industry as
well as those common to all industries
Pharmaceutical and Health Sciences Executive Pharmaceutical and Health Sciences Middle
Management, Professional and Support
100+ participating organizations
4,900+ incumbents reported
100+ participating organizations
185+ executive benchmark positions in 38 functions,
306,000+ incumbents reported
including functions unique to the pharmaceutical and
46 functions and 450+ disciplines, including those
health sciences industries as well as those common unique to the pharmaceutical and health sciences
to all industries industries as well as those common to all industries
Data segmented by scope of responsibility, in addition
Data segmented by scope measures, in addition to
to the data segments presented on page 3 the data segments presented on page 3
Retail Executive Retail Middle Management, Professional and
Support
110+ participating organizations
4,600+ incumbents reported
100+ participating organizations
170+ executive benchmark positions in 49
969,000+ incumbents reported
functions, including functions unique to the retail
51 functions and 490+ disciplines, including those
industry as well as those common to all industries unique to the retail industry as well as those common
to all industries
Data segmented by retail segment, in addition to the
data segments presented on page 3
See page 3 for data Visit wtwdataservices.com for a Save the date! Don’t miss
elements and segmentation complete list of functions, executive important survey submission deadline
reported. benchmarks and disciplines surveyed dates listed on inside cover.
and a list of our 2018 survey participants.
2019 Compensation Surveys - U.S. 7
Long-Term Incentives, Policies and Practices Report - U.S.
Long-term incentive plans and awards are an integral component
of your organization’s executive compensation packages. 2018 survey results snapshot
995 participating organizations
How will the survey results help you?
Data are reported by:
The Long-Term Incentives, Policies and Practices Report - U.S.
is jointly developed by the compensation consultants at Willis
Salary band
Towers Watson and the compensation survey experts at Willis
Industry
Towers Watson Data Services. With detailed insights into
Organization size measured by revenue
the latest LTI practices and trends, you can design or update
plans for employees that incent desired behaviors and drive Incentive elements reported on:
company performance.
LTI award values by salary band, industry classification and
As a participant in any of our general industry and industry- organization size measured by revenue
specific compensation surveys that collect long-term
LTI plan prevalence
incentive data, you are also eligible to purchase the Long-Term
LTI plan design by award type: stock options, restricted
Incentives, Policies and Practices Report - U.S. The report is
stock/stock units, performance plan awards and stock
available only to participants.
appreciation rights
Long-Term Incentives, Policies
and Practices Report - U.S.
Changes in most recent grants and future directions
LTI Plan Design
Restricted Stock/Stock
Stock ownership
Units (conti nued)
NUMBER OF EMPLOYEES
Total Sample
ELIGIBLE FOR GRANTS
25th
The grant process: determination of LTI grant values, award
Median
timing and individual participation/awards
75th
INDUSTRY SECTOR 150 385
Average # of Responses
1,600 - U.S. 3,357
Long-Term Incentives, Policies and Practices Report 533
Energy Services
Financial Services 90 278 836 624
158 62
LTI Grants
High Tech 400 2,350
422 1,949 90
Manufacturing 1,053 5,632 14,129
Custom long-term incentive analysis
167 62
Media/Entertainment 368
grant values 2,137
represent the LTI
3,270 dollar value award opportunity. Specifically, the values
The following LTI
200 226
Pharmaceutical/Biotechnology 400 1,555
annualized present value of LTI2,580 award guidelines (the typical annual award for an employee at
Long-Term Incentives, Policies
Retail/Wholesal represent the 3,400
and Practices Report824 19 ASC 718
e Trade - U.S.
this salary level)
118 at grant date. 14,845
In the case of8,304 equity awards, the values reflect each organization's
Participants can purchase a custom analysis and review of their
Services 260 29 restricted stock/stock units, performance
734
values. Equity awards 1,137 include stock options,
(formerly FAS123[R])
150 42
Health
Grant Care Process shares and stock
193
500
appreciation 1,650
rights (SARs).7,443 Long-term cash performance plans are valued at target.
REVENUE SIZE 400 103
4,536 2,189
company’s long-term incentive practices. This review will cover
10dispersion of all compensation elements. The
Award Timing and Valu
Under $500 Million
Values for long-term incentive data typically have the
greatest
es
$500 Million - $1 Billion 33
(continued)
following
200
summary displays a 592 broad range of 481 summary statistics, including 10th and 90th percentiles
and
$1 Billion - $3 Billion 26 101 374 of analyzing206
14
the value of long-term incentives it is recommended that the
FREQUENCY OF COMP averages. However, for purposes
award levels, plan design, performance metrics and market trends.
values in
$3 Billion - $6 Billion ETITIVE MARKET DATA98
median (50thREVIE
176
percentile) represents
388 the optimal "market rate." The average reflects valid but extreme
30
194 W 561 on whether every value in the
$6 Billion - $10 Billion 330
data that are widely % of dispersed. The 10th and 90th percentiles provide a check
122
292 Responses 910 1,141 116
$10 Billion - $20 Billion falls 680 a reasonable
within 2,029 range.
sample
Annually
212 2,362
$20Total Sample
Billion or More
Biennially
633 Periodica
2,356 lly
Do Not Review 69
INDUSTRY SECTOR 69.9%
475 4.4%
External
2,459 Market Data # of
1,911 22.5%AWARDS12,308 84Responses
DOLLAR VALUE OF 20168,048 LTI 3.2% 856 by Salary Level # of
Energy
NUMB ERService s 98 Awards
Actual
OF EMPLO
Financial Services YEES RECEIVING 79.1% 75th 90th Average Responses
GRAN TS ($000)
Salary Ranges
3.3% 17.6% 10th 25th Median
69.9% 0.0% 91
High
Total Tech
Sample 25th
TOTAL SAMPLE 3.1%
Median 22.7%
70.6%
139 75th 4.3%
Average $4,249.8
163 $7,000.0 $10,088.2 $5,200.4 491
Manufa
INDUST RYcturing
SECTOR 4.7%
300 20.0% $1,275.1 $2,364.0 # of Respons es
CEO 966 1,5664.7% 483
Media/E
Energy ntertain
69.5% 5.4% $335.0 $629.7 533 85
$1,096.7 $1,797.5 $3,000.7 $1,464.0
Service s ment CFO 22.9% 2.3% 40
74.2%74 354 $4,563.9 $5,620.5 $3,550.3
Pharma
Financi ceuticasl/Biotechnology
al Service 0.0%
- $1,000204 19.4%
500 $916.4 $1,615.9 $3,010.0
HighRetail/W
Tech holesale Trade 120 $901
73.3% 4.4%
338
3776.5%
$1,509.1 62 31
$2,373.2 $3,483.6 $4,920.6 $2,741.3 46
$801 - $900 22.2%
1,505 $824.60.0%
62.0%
317 2.8% 1,086 90 45 $3,642.1 $2,086.9 103
Service
Manufa s
cturing 730 29.6%
1,750 $697.7 $1,094.0 $1,865.8 $2,759.6
67.7%
150 $701 - $800 5,6535.6% 71 203
Health
Media/E Care ment
ntertain 5.5%
310 22.0% $1,394.9 $1,919.4 $2,568.4 $1,590.4
62
84.6%
134 $601 - $7000.0% 1,321 $605.1
1,9984.9% $944.9 226164 320
REVEN
Pharma UE SIZE
ceutica 300 $1,281.6 $1,740.8 $1,063.6
l/Biotechnology
682 $501 - $600
15.4%
1,250 $450.0
6230.0% $645.3 19 $947.9 13 455
Underholesal
Retail/W $500 Million
e Trade 3,152 8,325 $400.1 $540.0 $738.4 $1,090.1 $640.9
63.3%94 $401 - $5003.3% $263.5
5,467
$500sMillion - $1 Billion
Service 213 20.0% 29 $452.4 $635.2 $394.1 496
72.0% 734 13.3% $254.7 42 $350.0
$172.9
942
$1 Billion
Health 140 $351 - $400 10.0%
357 30 528
Care - $3 Billion 16.0%
972 $231.7 $301.7 $416.3 $265.1
68.1%
124 $301 - $3505.9% 2,040
$118.5 2.0% $165.0 103 50
$3 Billion
REVEN UE SIZE - $6 Billion 330 21.3%
2,616 $200.8 $272.2 $176.4 547
63.8% $251 - $300 1,249
$72.04.8% $107.8 10188 $149.0
$6 Billion
Under $500 Million
- $10 Billion 5.6% 27.7% $100.6 535
$125.0 $175.4
$10Million
$500 Billion- -$1
74.7%33 $201 - $250 0.0%
146 $45.62.8% $60.7 177$84.9
$20 Billion
Billion 24.2%
288 1.0%
341 $75.0 $106.8 $60.3 477
$1 $20 70.7%26 - $2005.3%
74 $25.0 $37.5 14 99$51.7
Billion
Billion
- $3 or More
Billion $176 21.1%
140 $41.0 421
74.9%
80 3.0%
118
$16.9 $25.4 30 133 $35.8 $50.0 $70.3
$3 Billion - $6 Billion $151 - $175 2.2%
150
Annual Incentive Plan Design Survey - U.S.
21.2%
277 1.7%
267 $52.5 $29.0 331
$6 Billion - $10 Billion 175 287 $12.3 $16.4122179$24.3 $35.4
$126 - $150 599 544 $20.7 244
229 $7.6 $11.1116 $17.3 $25.0 $39.0
$10 Billion - $20 Billion $101 - $125450 1,497
159 1,029 $17.4 $25.0 $14.0 159
$8.5 69 $11.2
$20 Billion or More $80 - $100491 1,288 $4.7
1,257
445 1,645 84on next page.
4,541 5,656 Table continues
98
As part of your organization’s broad compensation and benefit
Willis Towers Watson Data
Services
strategy planning, it is essential to consider the breadth How will the survey results help you?
of your annual incentive offering as a means to increase
Align pay strategies with company objectives and priorities.
performance within your workforce.
Willis Towers Watson Data Services
Understand historic and current payout levels at all levels of
participating organizations.
Willis Towers Watson Data
Services Participation is easy. Simply download survey
Compare your organization’s design practices with those of
submission materials by accessing the Participation your peers, including:
Center tab at wtwdataservices.com and submit – Eligibility of various organizational levels
your data online using the link. – Plan funding
Save the date! Don’t miss important survey – Performance metric prevalence and weighting at
submission deadline dates listed on inside cover. corporate, segment, division and individual levels
– Plan features (circuit breaker, multiplier, discretion,
overrides, impact of individual performance)
8 wtwdataservices.com +1 800 645 5771Artificial Intelligence and Digital Talent Compensation Survey - U.S.
It’s time to embrace digitalization
How will the survey results help you?
As artificial intelligence (AI), blockchain and automation
continue to evolve, today’s realities are blurring lines between
Adapt your HR strategy to attract, retain and engage talent
the physical, digital and biological worlds. Companies are that is in high demand.
“going digital” — deconstructing and dispersing work across
Capitalize on the emergence of AI and the rise of
a global virtual workplace. This is creating an immense contingent work.
competition among companies as they seek to acquire the
Understand the digital skills you need for your business and
needed skills and recruit the best digital talent to actualize
how employees with those skills should be compensated.
their business objectives.
The Artificial Intelligence and Digital Talent Compensation 2018 survey results snapshot
Survey - U.S. takes a novel, holistic approach to
980+ participating organizations
understanding the unique challenges posed by the digital
workforce, from sourcing and compensating skills to updating
227,000+ incumbents reported
talent management strategies.
10 executive benchmark positions
45 disciplines
See page 3 for data elements and segmentation
10 functions
reported.
Visit wtwdataservices.com for a complete list
of functions, executive benchmarks and disciplines
surveyed, and a list of our 2018 survey participants.
Participation is easy. Simply follow the steps
on page 2 to submit your data.
Save the date! Don’t miss important survey
submission deadline dates listed on inside cover.
NEW
for
Sales Compensation and Design Survey - U.S. 2019
Our Sales Compensation and Design Survey - U.S. focuses
exclusively on jobs that are directly involved in the sales How will the survey results help you?
function. This survey is ideal for organizations searching
Survey results offer:
for data on the “hunter,” the “farmer” and hybrid roles —
Robust data on pay levels, including commissions and target-
roles tasked with pursuing business opportunities, closing
based quota bonuses for key benchmark sales positions
sales and technical sales support as well as those positions
responsible for maintaining client relationships.
Insightful information on sales incentive design practices
and trends, including performance measures and payout
mechanisms
Interested in learning more?
Simplified job structure and incentive data reporting
requirements
Please contact our Client Care team
at +1 800 645 5771 or
Enhanced reporting that further supports the specific
wtwusdata@willistowerswatson.com requirements of sales compensation managers
for participation and survey results details.
2019 Compensation Surveys - U.S. 9General Industry Salary Budget Survey - U.S.
Statistics reported on:
How will the survey results help you?
Merit and total increases reported as a percentage of total base
This report provides aggregated data on increase salaries granted, budgeted and projected
percentages for actual salary budgets for the past and
Salary range midpoint increases granted, budgeted and projected
current year, along with projected increases for next
The percentage of incumbents who receive variable pay elements
year — figures most sought after by HR and compensation (short-term incentives/bonuses and low-cost recognition/spot
professionals for effective compensation planning. awards programs) in each applicable employee group
The percentage of total base salaries budgeted for short-term
incentives/bonuses
2018 survey results snapshot
Targeted Total Rewards mix, including the target percentage of
The 2018 survey collected data from 817 organizations. each element
Salary increases expressed both as a percentage of incumbents
Data are segmented by: receiving and the average salary increase, at each of the four
Geographic area
Industry classification performance ratings
Organization size
Profit status
Starting salaries for recent graduates
Employee groups covered: Results are FREE to participants (a $600 savings off the nonparticipant
price). Plus as a bonus, participants will receive complimentary
Executive
Nonexempt salaried
preliminary results in early August.
Management
Nonexempt hourly
(excluding executives)
Exempt, nonmanagement Visit wtwdataservices.com for a list of 2018
survey participants.
Did you know? Participation is easy. Simply download survey
According to the 2018 General Industry submission materials by accessing the Participation
Salary Budget Survey Report - U.S. Center tab at wtwdataservices.com and submit your
data online using the link.
An increase in discretionary
bonus awards is expected in 2019 Save the date! Don’t miss important survey
across most employee groups. submission deadline dates listed on inside cover.
General Industry Compensation Policies and Practices Survey - U.S.
How will the survey results help you? 2018 survey results snapshot
Do your policies stack up to those of your peers? Key The 2018 survey collected data from 488 companies.
findings will help ensure your organization’s pay policies
and practices are competitive. Policies and practices reported on:
Labor market definition by
Staffing
employee group
Tuition assistance
Did you know?
According to the 2018 General Industry Compensation
Short-term incentive pay programs
Recruitment and retention
Policies and Practices Survey Report - U.S.
Sales incentives and policies
Work/life policies
affecting sales personnel
Top three recruitment/retention practices
Deferred compensation
Shift and holiday pay differentials plans for executives
Severance pay policies
Company car benefits
Exempt overtime policies
Regional differentials
1 2 3
Data are broken down by:
Tuition Short-term Wellness
Geographic area
Profit status
reimbursement incentives programs
Organization size Industry
10 wtwdataservices.com +1 800 645 5771Global General Industry Long-Term Incentives Survey
Custom Long-Term Incentive Analysis
How will the survey results help you?
Participants can also purchase a custom analysis, which will
Multinational organizations face a growing challenge in include results based on their peer organizations.
managing and deploying top talent worldwide. Having the
right incentives to drive performance is a key part of the
equation. Compare your organization’s LTI investment with Also available
the latest information and insights.
Global Pharmaceutical and Health Sciences
Long-Term Incentives Survey Report
2018 survey results snapshot
A subset of the Global General Industry Long-Term
The Global General Industry Long-Term Incentives Survey Incentives Survey database, the report provides
Report is a premier source for information on global long- detailed information about international LTI policies and
term incentives. The survey report covers international LTI practices and global grant values of major multinational
policies, practices and fair values* of major multinational pharmaceutical and health sciences companies.
companies, including:
Home country incumbents to enhance grant value tables by
including all incumbents receiving LTI
Visit wtwdataservices.com for a list of our
Hard-to-find expected LTI grant date fair values in 2018 survey participants.
approximately 60 countries based on accounting value
Participation is easy. Simply follow the steps
methodology, including breaks by U.S.- and EMEA-only
on page 2 to submit your data.
companies as well as a revenue break by U.S. companies
Market trends, including key issues identified by participants Save the date! Don’t miss important survey
submission deadline dates listed on inside cover.
Prevalence of different types of LTI plans
Eligibility and participation policies, plus participation
statistics by lowest salary for those receiving grants
*Fair value is the per share value of the award at grant as calculated under
International Financial Reporting Standards (IFRS 2), or the equivalent standard
under local country Generally Accepted Accounting Principles.
Global General Industry Long-Term Incentives
Survey Report
ntives
stry Long-Term Ince
Global General Indu
Survey Report
International Modifications
Country
Grant Values by
Modifications - Last 12-18 Months
ntinued)
Thirty-three percent of the organizations have made plan design modificationsAs
within
Pacific Region (co
ia the last 12-18 months to
reflect tax and legal issues outside the home country. Of those making modifications, 28% have modified the
form of award agreement. STRALIAAU AUD) # of
A - 1.00 USD = 1.28 - % of Base Salary
PLE (AUSTRALI LTI Award Value Responses
are:BAL TOTAL SAM
The most common modifications that have been made in the last 12-18 monthsGLO LTI Award Value
- USD (000) 25th Median
75th
2
)- 75th --- ---
Salary Ranges (000 25th Median --- 8
(AUD) --- --- 67
MODIFICATION --- 15 38
ater Than 640 304 75 37
% Gre
of # of 68 158
30 39
242 44
512 - 640
Organizations Organizations 128 24 49
103 18 69
Modified form of award agreement 28%
384 - 512 13 67 135 35
47 17 25
81 56
Changed how awards are settled 320 - 384
26% 12 55 19 29
36 14 64
Changed to units rather than shares 256 - 320
15% 7 35 55 28
27 12 18
45 64
Changed vesting 224 - 256
13% 6 30 14 24
20 9 53
Changed termination provisions 11%192 - 224 5 18 33 19
12 8 15
22 35
Added provisions which require forced sale of shares upon certain events 6%160 - 192 3 17 14 18
10 8 23
128 - 160 12 17 13
Introduced a qualified plan 2% 1 7 5 9
10 12
102 - 128 3 7 10 20
10 5 0
Challenging Issues and Expected Changes - Next 12 Months 77 - 102
3 5
--- --- --- ---
51 - 77 ---
---
Lessone
Most organizations (71%) have challenges with global LTI plans. By far, the number n 51
Thachallenge in the next
D)
12 months is determining the appropriate LTI award size outside the home country. 0 USD = 1.28 AU # of
(AUSTRALIA - 1.0 - % of Base Salary
TOTAL SAMPLE LTI Award Value Responses
UNITED STATES
75th
- USD (000) Median 1
LTI Award Value 25th ---
CHALLENGING ISSUES AND EXPECTED CHANGES Salary Ranges (000
)- Median
75th
--- ---
25th --- 7
Challenging Issues (AUD )
Expected Changes --- 36 68
--- 11 31
which are Most Concerning Than 640 LTI Plans
to International
Greater 156 312 80
% of # of % of # of 50 31 44
- 640 260 48 36
Organizations Organizations 512
Organizations Organizations 150 23
110 17 57
Plan Design 384 - 512 64 131 34
Introduce Stock Options/SARs 5% 5 320 - 384
--- ---
45
37 55 77
56
17
14
25
20 2019 Compensation
30 49
Surveys - U.S.
57
11
Introduce Restricted Stock/RSUs 7% 7 320
256 -6% 5 38 19 29
26 12 55
Introduce Performance Shares or Cash 4% 4 224 -7%256 6 31 45 23
20 9 13
32 45
Eligibility and/or Receivership 192 - 224 18 15 20
12 8 29
160 - 192 23 18Our methodology
Our survey methodology builds on our collective experience in Middle management, professional and support
serving clients for more than 70 years. Our approach provides jobs: a two-step leveling approach
a consistent process for mapping jobs to external market data
and integrates executive benchmarks, functions/disciplines Our methodology for nonexecutive jobs uses functions (job
and career levels. families) and disciplines (areas of specialization) combined
with career levels to replace traditional survey benchmark
Our consistent survey methodology reflects our extensive jobs. You match your jobs to the functions and disciplines,
knowledge and experience in job leveling and job architecture, and then assign the career bands/levels that represent the
as well as our understanding of how cross-industry and type and level of competency within the function/discipline.
industry-specific jobs are structured and evolve as industries
change. This ensures accurate and meaningful comparisons of
Your job match
data across all countries and regions of the globe.
Step 1: Function/Discipline Step 2: Career bands/levels
Executive jobs: a benchmark approach The combinations of disciplines and career bands/levels are
easily identified in the labor market and enhance your ability to:
Our approach to executive jobs integrates executive
benchmark descriptions with critical measures, such as
Create linkages among the market, how people are paid
revenue, full-time equivalent (FTE) employees and geographic
and how their careers advance in an organization.
scope. Benchmark job matching at the executive and senior
management levels allows you to differentiate between
Improve the matching process for diverse and unique jobs.
corporate and business unit responsibilities.
Capture more data per discipline and career level.
Consistently view market data across functions, geographic
Sample executive benchmark: top areas and lines of business.
compensation and benefits executive
Example
This position has primary responsibility for designing,
developing and implementing the organization’s Step 1: Match your organization’s jobs to functions
benefit and compensation programs (e.g., executive and disciplines
compensation, salary, hourly, sales incentives). Functions Accounting Human IT development
At the corporate level, this position emphasizes resources
design/development; at the noncorporate level, the Disciplines
Accounts
Benefits
Application
emphasis is on administration unless the organization payable
Compensation development
is highly decentralized.
General
Recruitment
Business
accounting systems
Payroll analysis
IT architecture
(systems
design)
12 wtwdataservices.com +1 800 645 5771In North America, nonexecutive job hierarchies or internal The following General Alignment Map provides an
structures are aligned with survey career levels and matched to overview of how career bands, career levels and global
functions and disciplines. Within the nonexecutive career bands, grades are aligned.
there are four to six career levels that span six to 10 global grades.*
Step 2: Assign career bands/levels
General alignment of global grades to career levels
Revenue (USD) 75m 150m 500m 1b 2b 5b 10b 50b 100b
1 2 3 4 5 6 7 8 9 10 11 12 13 14 15 16 17
17 18
18 19
19 20
20 21
21 22
22 23
23 24
24 25
FTE employees 90 240 620 1.6K 4.1K 10.6K 27.5K 75K 200K
Executive/Senior management (EX)
15 16 17 18 19 20 21 22 23 24 25
Supervisory/Management (M)
M1 M2 M3 M4 M5
Supervisor Manager Senior Group Senior
Manager Mgr. Group
Mgr.
Revenue (R) (Financial Services only)
R1 R2 R3 R4 R5 R6
Analyst Asso- Senior Vice Director Senior Managing
ciate Associate President Vice President Director
Professional (P)
P1 P2 P3 P4 P5 P6
Entry Interm. Career Specialist Master Renowned
Expert
Customer/Client Management and Sales (S)
S1 S2 S3 S4 S5 S6
Entry Interm. Career Expert Sr. Elite
Expert Expert
Medical representation (V) (Pharmaceutical and Health Sciences only)
V1 V2 V3 V4
Entry Career Spe- Expert
cialist
Technical support (T)
T1 T2 T3 T4
Entry Interm. Senior Lead/Advanced
Business support (U)
U1 U2 U3 U4
Entry Interm. Senior Lead/Advanced
Production/Manual labor (W) (Not in Financial Services)
W1 W2 W3 W4
Entry Intermediate Senior Lead/
Advanced
Sample job match: your benefits professional
Survey job code: AHR060-P3
Step 1: Match to a function and a discipline Step 2: Assign a career band and a career level
Function: AHR Human Resources, Discipline: AHR060 Benefits Career Band: Professional, Career Level: P3 Career
Develops, implements and administers cost-effective benefit
Has in-depth knowledge in own discipline and basic knowledge of
programs, such as pension plans and life, health and disability related disciplines
insurance
Solves complex problems; takes a new perspective on existing
solutions
Works independently; receives minimal guidance
Acts as a resource for colleagues with less experience
May represent the level at which career may stabilize for many
years or even until retirement
*In regions outside North America, global grades are used to measure the relative internal values of all jobs in an organization and align them to quantifiable
differences in market pay. Global grades are not collected in North America. References to global grades in survey materials are presented for the benefit of
global participants and Global Grading System clients.
2019 Compensation Surveys - U.S. 13Flexible reporting options
Compensation data delivered online
Visit wtwdataservices.com for
Our compensation data are available in two reporting options. Both offer online
reporting options available for the
access to the type of data that fits your organization’s unique needs and budget.
survey report of interest.
Reporting option 1: Total Direct Compensation For further information, contact our
Client Care team at +1 800 645 5771 or
This option is available only to participants.
wtwusdata@willistowerswatson.com.
Gain all the benefits from the total direct compensation option, which
includes LTI values by job and salary range for all your executives.
Data submissions to this survey are accepted throughout the year.
Reporting option 2: Total Annual Compensation
This option is available to both participants and nonparticipants.
Acquire robust pay data minus the long-term incentive values.
These options can be purchased in either a Custom or a Standard output format:
Output features Custom Standard
View, download and print reports • •
Age data • •
Export data in a variety of formats • •
Create peer groups by company name or characteristic (e.g., industry, size or performance measure) •
Customize report formats and content (e.g., select preferred percentiles and currencies, and tailor •
report content, titles and labels)
Combine career levels and disciplines •
View and compare your data with the market •
Access new data as they are submitted to the database throughout the year (for select surveys) •
Sort by additional criteria such as number of full-time equivalent employees, revenue size and other •
industry-specific breakouts
Add percentiles of your choice •
Combine publicly disclosed data and survey submitted data in customized peer groups (available for the •
General Industry Executive Compensation Survey Report - U.S.)
14 wtwdataservices.com +1 800 645 5771For further exploration
Willis Towers Watson Compensation Software
Compensation management is about striking the right Key features
balance. Willis Towers Watson Compensation Software helps
companies design, build and manage an effective compensation
Compensation data: Gain perspective on compensation
strategies and decisions with interactive access to
structure that places total compensation within the context of
comprehensive data from Willis Towers Watson.
performance, market benchmarks and systemwide equity.
Compensation management: Create a pay-for-
Imagine empowering managers to respond nimbly to the performance culture that rewards the best employees and
productivity and aspirations of employees while effortlessly improves their engagement and retention.
complying with the philosophy, guidelines and budget of your
Job leveling: Determine the value of jobs across your
compensation system. organization to achieve a balanced compensation structure
and establish a foundation for effective talent management.
That’s the Willis Towers Watson difference.
Compensation reporting and analytics: Visualize
compensation data from multiple dimensions to identify
opportunities in the organization and in the labor market.
To learn more, visit us at
willistowerswatson.com/compensationsoftware.
Total Rewards statements: Demonstrate to candidates
and employees the true market value of compensation
packages in an intuitive digital statement.
New pricing is now available!
For details on discounts available for
integrating software and data, contact our
Client Care team at +1 800 645 5771 or
wtwusdata@willistowerswatson.com.
2019 Compensation Surveys - U.S. 152019 survey report pricing
Total Direct Compensation (TDC) Total Annual Compensation (TAC)
Participant only Participant Nonparticipant Participant Nonparticipant
General industry survey reports Custom Standard Standard Standard job level/job function
General Industry Reports Package - U.S.+ $11,300 $8,300 $5,500 $11,500
General Industry Executive Compensation Survey
$8,500 $5,100 $2,500 $4,800
Report - U.S.
General Industry Middle Management, Professional
$6,500 $4,900 $4,500 $9,500
and Support Compensation Survey Report - U.S.
General Industry Supervisory and Middle
$1,200 $2,400
Management Compensation Survey Report - U.S.
General Industry Professional (Administrative and
$1,200 $2,400
Sales) Compensation Survey Report - U.S.
General Industry Professional (Technical and
$1,200 $2,400
Operations) Compensation Survey Report - U.S.
General Industry Office and Business Support
$1,200 $2,400
Compensation Survey Report - U.S.
General Industry Technical Support and Production
$1,200 $2,400
Compensation Survey Report - U.S.
General Industry Accounting and Finance
$1,200 $2,400
Compensation Survey Report - U.S.
General Industry Engineering, Design and Technical
$1,200 $2,400
Specialty Compensation Survey Report - U.S.
General Industry Human Resources Compensation
$1,200 $2,400
Survey Report - U.S.
General Industry Information Technology
$1,200 $2,400
Compensation Survey Report - U.S.
General Industry Sales, Marketing and
Communications Compensation Survey $1,200 $2,400
Report - U.S.
Artificial Intelligence and Digital Talent Survey
$4,200 $3,100
Report - U.S.
Total Direct Compensation (TDC)
Participant only
Industry-specific survey reports Custom Standard
Energy Services Reports Package - U.S.+ $11,300* $8,300
Energy Services Executive Compensation Survey Report - U.S. $8,500* $5,600
Energy Services Middle Management, Professional and Support Compensation Survey Report - U.S. $6,500* $4,900
Energy Marketing and Trading Compensation Survey Report - U.S. $3,700
Financial Services Reports Package - U.S.+ $11,300*
Parent company with less than $2 billion in assets $4,800
Parent company with more than $2 billion in assets $5,800
Financial Services Executive Compensation Survey Report - U.S. $8,500*
Parent company with less than $2 billion in assets $4,100
Parent company with more than $2 billion in assets $5,100
Total Direct Compensation (TDC) – Available only to participants and includes long-term incentive (LTI) values by job and salary range.
Total Annual Compensation (TAC) – Available to participants and nonparticipants and does not include LTI values.
16 wtwdataservices.com +1 800 645 5771Total Direct Compensation (TDC)
Participant only
Industry-specific survey reports continued Custom Standard
Financial Services Middle Management, Professional and Support Compensation Survey Report - U.S. $6,500*
Parent company with less than $2 billion in assets $2,800
Parent company with more than $2 billion in assets $3,800
Fintech Compensation Survey Report - U.S. $5,000 $4,000
High Tech Reports Package - U.S.+ $11,300* $8,300*
High Tech Reports Package - U.S.+ (not including the general industry survey results) $6,500 $5,000
High Tech Executive Compensation Survey Report - U.S. $5,200 $3,900
High Tech Middle Management, Professional and Support Compensation Survey Report - U.S. $4,300 $3,100
Media Reports Package - U.S.+ $11,300* $8,300
Media Executive Compensation Survey Report - U.S. $8,200*
Parent company with annual revenues less than $500 million $2,600
Parent company with annual revenues of $500 million to $1 billion $4,500
Parent company with annual revenues greater than $1 billion $6,400
Media Middle Management, Professional and Support Compensation Survey Report - U.S. $6,000* $3,700
Oil and Gas Compensation Survey Report - U.S. $5,200
Parent company with less than $1 billion in revenues $2,800
Parent company with more than $1 billion in revenues $3,800
Pharmaceutical and Health Sciences Reports Package - U.S.+ $11,300* $8,300
Pharmaceutical and Health Sciences Executive Compensation Survey Report - U.S. $8,500* $5,800
Pharmaceutical and Health Sciences Middle Management, Professional and Support Compensation Survey
$6,500* $3,700
Report - U.S.
Retail Reports Package - U.S.+ $11,300* $7,300
Retail Executive Compensation Survey Report - U.S. $8,500* $5,000
Retail Middle Management, Professional and Support Compensation Survey Report - U.S. $6,500* $4,000
+Includes both the executive compensation and the middle management, professional and support compensation survey reports for that industry
*Includes general industry survey results
Participant only Nonparticipant
Survey reports Custom Standard Standard
Long-Term Incentives, Policies and Practices Report - U.S. $3,300
Annual Incentive Plan Design Survey Report - U.S. $1,800 $3,500
Long-Term Incentives, Policies and Practices Report - U.S. and Annual Incentive Plan
$4,000
Design Survey Report - U.S.
Sales Compensation and Design Survey Report - U.S. (TAC) $4,000 $3,000
General Industry Salary Budget Survey Report - U.S. FREE $600
General Industry Compensation Policies and Practices Survey Report - U.S. $600 $1,200
Global General Industry Long-Term Incentives Survey Report $7,500
Global Pharmaceutical and Health Sciences Long-Term Incentives Survey Report $7,500
Global General Industry Long-Term Incentives Survey Report and Global Pharmaceutical
$11,000
and Health Sciences Long-Term Incentives Survey Report
2019 Compensation Surveys - U.S. 17Willis Towers Watson Data Services
Willis Towers Watson Data Services is a leading provider of compensation, benefit and
employment practice information to the global employer community. Our databases are
recognized worldwide as a premier source of current data for compensation planning.
Willis Towers Watson Data Services
44 South Broadway, 13th Floor
White Plains, NY 10601-4411
T +1 800 645 5771 F +1 914 289 3201
wtwusdata@willistowerswatson.com
wtwdataservices.com
About Willis Towers Watson
Willis Towers Watson (NASDAQ: WLTW) is a leading global advisory, broking and
solutions company that helps clients around the world turn risk into a path for growth.
With roots dating to 1828, Willis Towers Watson has over 40,000 employees serving more
than 140 countries. We design and deliver solutions that manage risk, optimize benefits,
cultivate talent, and expand the power of capital to protect and strengthen institutions
and individuals. Our unique perspective allows us to see the critical intersections
between talent, assets and ideas — the dynamic formula that drives business
performance. Together, we unlock potential. Learn more at willistowerswatson.com.
willistowerswatson.com/social-media
Copyright © 2019 Willis Towers Watson. All rights reserved.
WTWDS-GDS-18-RES-2326b (70N)
wtwdataservices.comYou can also read