Summary of Oceanographic and Water-Quality Measurements Offshore of Matanzas Inlet, Florida, 2018 - Open-File Report 2021-1014
←
→
Page content transcription
If your browser does not render page correctly, please read the page content below
Summary of Oceanographic and Water-Quality
Measurements Offshore of Matanzas Inlet,
Florida, 2018

Open-File Report 2021–1014

U.S. Department of the Interior
U.S. Geological Survey
Cover. Instrumented sea-floor platform ready for deployment. Photograph by Ellyn Montgomery,
U.S. Geological Survey.
Summary of Oceanographic and
Water-Quality Measurements Offshore of
Matanzas Inlet, Florida, 2018

By Marinna A. Martini, Ellyn T. Montgomery, Steven E. Suttles, and
John C. Warner

Open-File Report 2021–1014

U.S. Department of the Interior
U.S. Geological Survey
U.S. Geological Survey, Reston, Virginia: 2021 For more information on the USGS—the Federal source for science about the Earth, its natural and living resources, natural hazards, and the environment—visit https://www.usgs.gov or call 1–888–ASK–USGS. For an overview of USGS information products, including maps, imagery, and publications, visit https://store.usgs.gov/. Any use of trade, firm, or product names is for descriptive purposes only and does not imply endorsement by the U.S. Government. Although this information product, for the most part, is in the public domain, it also may contain copyrighted materials as noted in the text. Permission to reproduce copyrighted items must be secured from the copyright owner. Suggested citation: Martini, M.A., Montgomery, E.T., Suttles, S.E., and Warner, J.C., 2021, Summary of oceanographic and water-quality measurements offshore of Matanzas Inlet, Florida, 2018: U.S. Geological Survey Open-File Report 2021–1014, 21 p., https://doi.org/10.3133/ofr20211014. Associated data for this publication: Suttles, S.E., Warner, J.C., Montgomery, E.T., and Martini, M.A., 2019, Oceanographic and water quality measurements in the nearshore zone at Matanzas Inlet, Florida, January–April, 2018: U.S. Geological Survey data release, https://doi.org/10.5066/P9GKB537. Suttles, S.E., De Meo, O.A., Martini, M.A, and Warner, J.C., 2021, Grain-size analysis data from sediment samples in support of oceanographic and water-quality measurements in the nearshore zone of Matanzas Inlet, Florida, 2018— U.S. Geological Survey Field Activity: U.S. Geological Survey data release, https://doi.org/10.5066/P9FKARIZ. ISSN 2331-1258 (online)
iii

Acknowledgments
This research was conducted as part of the U.S. Geological Survey Cross-Shore and Inlets
Processes study of the processes controlling coastal sediment transport. The Skidaway Institute
of Oceanography, University of Georgia, provided vessel and field support that were an essential
part of this work. The officers and crew of the research vessel Savannah ably supported the
scientific mission with expert ship-handling in challenging conditions. Marine Superintendent
John Bichy provided expert assistance with logistics and shipping. The authors would also
like to acknowledge the field, logistical, and analytic support provided by Jonathan Borden,
Eric Marsjanik, and Brian Buczkowski of the U.S. Geological Survey.
v
Contents
Acknowledgments����������������������������������������������������������������������������������������������������������������������������������������iii
Abstract�����������������������������������������������������������������������������������������������������������������������������������������������������������1
Introduction����������������������������������������������������������������������������������������������������������������������������������������������������1
Site Description����������������������������������������������������������������������������������������������������������������������������������������������2
Instruments�����������������������������������������������������������������������������������������������������������������������������������������������������4
Currents and Waves�����������������������������������������������������������������������������������������������������������������������������5
Backscatter (Turbidity)�������������������������������������������������������������������������������������������������������������������������8
Sonar Bedform Imaging�����������������������������������������������������������������������������������������������������������������������8
Temperature, Conductivity������������������������������������������������������������������������������������������������������������������8
Meteorological Observations�������������������������������������������������������������������������������������������������������������8
Antifouling����������������������������������������������������������������������������������������������������������������������������������������������8
Data Processing���������������������������������������������������������������������������������������������������������������������������������������������9
Results�������������������������������������������������������������������������������������������������������������������������������������������������������������9
Currents��������������������������������������������������������������������������������������������������������������������������������������������������9
Waves���������������������������������������������������������������������������������������������������������������������������������������������������10
Backscatter (Turbidity)�����������������������������������������������������������������������������������������������������������������������10
Sonar Bedform Imaging���������������������������������������������������������������������������������������������������������������������10
Temperature and Conductivity����������������������������������������������������������������������������������������������������������15
Meteorological������������������������������������������������������������������������������������������������������������������������������������16
References Cited�����������������������������������������������������������������������������������������������������������������������������������������20
Appendix 1. Burst Data, Matanzas Inlet, Florida, January–April 2018��������������������������������������������21
Figures
1. Regional map of study area near Matanzas Inlet, Florida�����������������������������������������������������2
2. Photograph showing the instrumented sea-floor platform prior to deployment
at the Matanzas Inlet, Florida, shallow site������������������������������������������������������������������������������3
3. Photograph showing instrumented sea-floor platform being moved on deck
prior to deployment at the Matanzas Inlet, Florida, deep site�����������������������������������������������4
4. Photograph showing surface buoy with meteorological sensors deployed at
the deep site off Matanzas Inlet, Florida����������������������������������������������������������������������������������5
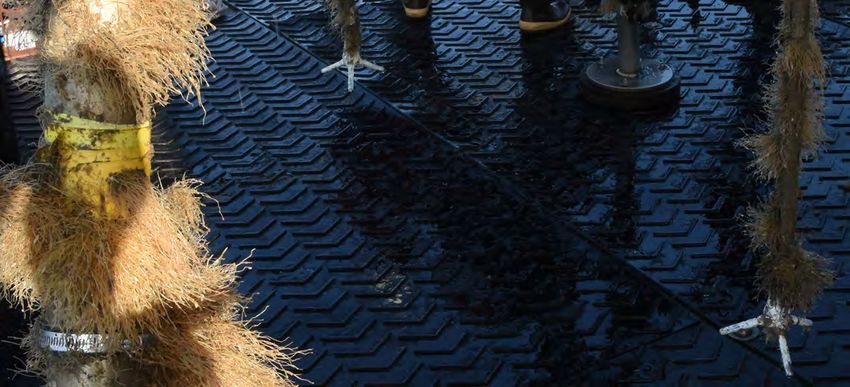
5. Photograph showing biofouling on the quadpod compared to minimal fouling
on sensors coated with zinc oxide paste (white)������������������������������������������������������������������10
6. Graphs showing current data from the acoustic Doppler current profilers from
both platforms, showing near-surface and near-sea-floor observations, along
with significant wave height in the top frame, Matanzas Inlet, Florida�����������������������������11
7. Profiles of east and north components of velocity from the downward-looking
acoustic Doppler current profilers above the sea floor, Matanzas Inlet, Florida������������12
8. Graphs showing wave statistics from upward-looking acoustic Doppler current
profilers (directional) and Sea-Bird Seagauge (nondirectional) pressure
loggers at both sites, Matanzas Inlet, Florida������������������������������������������������������������������������13
9. Profiles of acoustic backscatter at 2.5 megahertz for both sites, Matanzas
Inlet, Florida are compared with significant wave height from upward-looking
acoustic Doppler current profilers (directional) and Sea-Bird Seagauge
(nondirectional) pressure loggers at both sites, Matanzas Inlet, Florida�������������������������14vi
10. Graphs showing near-sea-floor turbidity observations collected at both sites,
Matanzas Inlet, Florida��������������������������������������������������������������������������������������������������������������15
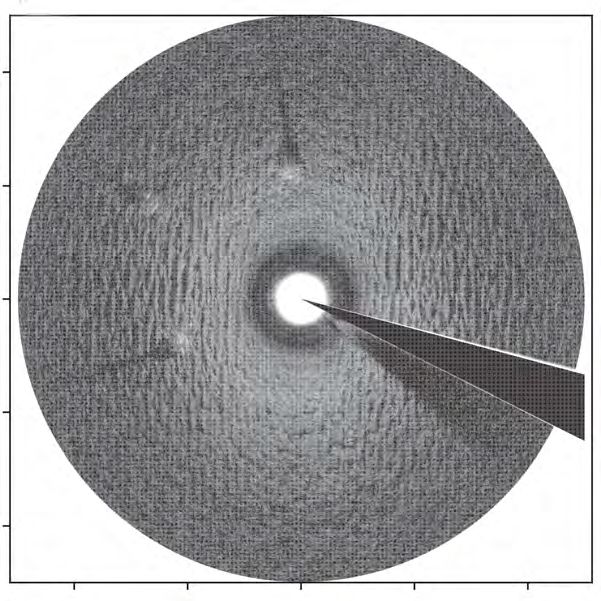
11. Example bottom image from the high-frequency sonar data showing distinct
ripples on the seabed, Matanzas Inlet, Florida����������������������������������������������������������������������16
12. Graphs showing temperature and conductivity measured by the MicroCATs
near the surface and near the sea floor at shallow and deep sites, Matanzas
Inlet, Florida���������������������������������������������������������������������������������������������������������������������������������17
13. Graphs showing air temperature, relative humidity, and shortwave radiation
from the deep site, Matanzas Inlet, Florida����������������������������������������������������������������������������18
14. Graphs showing barometric pressure, wind speed, wind gust, and wind
direction from the deep site, Matanzas Inlet, Florida�����������������������������������������������������������19
Tables
1. Deployment and location information for platforms deployed offshore of
Matanzas Inlet, Florida from January 24 to April 13, 2018�����������������������������������������������������1
2. Links to processed water flow (current velocity) data, by site and instrument,
for platforms deployed offshore of Matanzas Inlet, Florida, from January 24 to
April 13, 2018����������������������������������������������������������������������������������������������������������������������������������6
3. Links to processed wave (directional and nondirectional) data, by site and
instrument, for platforms deployed offshore of Matanzas Inlet, Florida, from
January 24 to April 13, 2018���������������������������������������������������������������������������������������������������������6
4. Links to processed acoustic and optical backscatter, by site and instrument,
for platforms deployed offshore of Matanzas Inlet, Florida, from January 24 to
April 13, 2018����������������������������������������������������������������������������������������������������������������������������������7
5. Links to sonar data collected at the shallow site offshore of Matanzas Inlet,
Florida, from January 24 to April 13, 2018���������������������������������������������������������������������������������7
6. Links to processed seawater temperature and conductivity data, by site and
instrument, for platforms deployed offshore of Matanzas Inlet, Florida, from
January 24 to April 13, 2018���������������������������������������������������������������������������������������������������������7
7. Link to meteorological data collected at the deep site offshore of Matanzas
Inlet, Florida, from January 24 to April 13, 2018�����������������������������������������������������������������������8vii
Conversion Factors
International System of Units to U.S. Customary Units
Multiply By To obtain
Length
centimeter (cm) 0.39370 inch (in)
millimeter (mm) 0.03937 inch (in)
meter (m) 3.28100 foot (ft)
kilometer (km) 0.62140 mile, U.S. statute (mi)
kilometer (km) 0.54000 mile, nautical (nmi)
Pressure
decibar (dbar) 1.45000 pound per square inch (lb/in2)
millibar (mbar) 0.02953 inch of mercury at 32°F (inHg)
hectopascal (hPa) 0.0145 pound per square inch (lb/in2)
Temperature in degrees Celsius (°C) may be converted to degrees Fahrenheit (°F) as
°F = (1.8 × °C) + 32.
Datum
Horizontal coordinate information is referenced to the World Geodetic System of 1984 (WGS 84).
Supplemental Information
Pressure measured underwater is given in decibars (dbar).
Current speed is given in centimeters per second (cm/s).
Current direction is given in degrees, as direction to which the water is flowing, measured
clockwise from North (degrees).
Wind speed is given in meters per second (m/s).
Wave direction is given in degrees, as coming from which waves are propagating, measured
clockwise from North (degrees).
Turbidity is given in nephelometric turbidity units (NTU).
Salinity is given as practical salinity units (PSU).
Irradiance is given in watts per square meter (W/m2).
Conductivity is given in siemens per meter (S/m).
Sound is given in decibels (dB).viii
Abbreviations
ABSS acoustic backscatter sensor
ADCP acoustic Doppler current profiler
ADV acoustic Doppler velocimeter
HR high resolution
Hz hertz
MHz megahertz
mab meters above bottom
netCDF Network Common Data FormSummary of Oceanographic and Water-Quality
Measurements Offshore of Matanzas Inlet, Florida, 2018
By Marinna A. Martini, Ellyn T. Montgomery, Steven E. Suttles, and John C. Warner
currents), subsurface water pressure, turbidity, hydrographic
Abstract parameters, and movement of sediment at the sea floor. Wave
spectra and statistics were calculated from water velocity and
U.S. Geological Survey (USGS) scientists and techni- subsurface pressure measurements. Buoy-mounted meteo-
cal staff deployed instrumented underwater platforms and rological sensors also collected data as part of this study;
buoys to collect oceanographic and atmospheric data at two parameters measured include wind speed, gust, and direction;
sites near Matanzas Inlet, Florida, on January 24, 2018, and air temperature; barometric pressure; relative humidity; and
recovered them on April 13, 2018. Matanzas Inlet is a natural, shortwave solar radiation.
unmaintained inlet on the Florida Atlantic coast that is well Two sites are identified by mooring identification
suited to study inlet and cross-shore processes. The two study numbers and site identification names (table 1). The sites are
sites were located offshore of the surf zone, in 9 and 15 meters oriented along a line perpendicular to the coast, offshore of the
of water depth, in a line perpendicular to the coast. A sea-floor surf zone in approximately 9 and 15 meters (m) (labeled “shal-
platform was deployed at each site to measure ocean currents, low” and “deep”) of water depth (fig. 1). Each site included
wave motions, acoustic and optical backscatter, tempera- a heavily instrumented, quadrupedal platform (“quadpod”)
ture, salinity, and pressure. The objective was to quantify the and guard buoy. The platforms were approximately 2.5 m
hydrodynamic forcing for sediment transport and the response high and 2.5 m wide (figs. 2 and 3) and were designed by Jay
to such forcing near the seabed in the vicinity of an unmain- Sisson of the Woods Hole Oceanographic Institution. Most of
tained inlet. the pressure cases for batteries and data loggers were secured
approximately 1.5 m above the seabed on horizontal chan-
nels within each platform. This design prevents the equipment
Introduction from interfering with the hydrodynamics in the region of inter-
est: the sediment resuspension layer directly above the seabed.
Coastal inlets are unique features that affect the nearshore Instruments to measure turbidity, temperature, and salinity and
current and waves, resulting in changes to the along- and to image the seabed were attached to the platform legs, with
across-shelf movement of material. To better understand careful attention to minimizing the creation of wakes in the
these systems and how they respond to storm events, the flow field. Both buoys served to mark the underwater locations
U.S. Geological Survey made time-series measurements of of the platforms and support measurements near (temperature
oceanographic, water-quality, sea-floor bedform movement, and salinity) or above (meteorological measurements) the
and meteorological parameters from fixed stations offshore of surface. The buoy at the deep site (Mooring Systems model
Matanzas Inlet, Florida, in winter 2018. The parameters mea-
sured include single-point and profiled water velocity (ocean
Table 1. Deployment and location information for platforms deployed offshore of Matanzas Inlet,
Florida from January 24 to April 13, 2018.
[ID, identification number; N, north; W, west; m, meter]
Mooring ID Site ID Platform type Latitude (N) Longitude (W) Depth (m)
1109 Shallow Top-hat buoy 29.7114 81.2184 8.1
1110 Shallow Large quadpod 29.7114 81.2186 8.6
1111 Deep 2-m foam buoy 29.7136 81.2138 15.3
1112 Deep Large quadpod 29.7133 81.2146 14.92 Summary of Oceanographic and Water-Quality Measurements Offshore of Matanzas Inlet, Florida, 2018
29.75
20
Florida
29.74 18
16
29.73
14
Latitude (°N)
Depth (m)
29.72 12
1111
1109 10
1112
29.71 1110
8
29.7 6
Legend
4
1109.. Small can buoy, shallow site
1110 .. Bottom frame, shallow site 29.69
Scale = 1 km
1111 .. Large foam buoy, deep site 2
1112 .. Bottom frame, deep site
29.68 0
-81.24 -81.23 -81.22 -81.21 -81.2
Longitude (°E)
Figure 1. Study area near Matanzas Inlet, Florida. The State outline is shown at the left with the inset at right, displaying the local
bathymetry and site locations “shallow” (mooring numbers 1109 and 1110) and “deep” (mooring numbers 1111 and 1112). km, kilometer;
m, meter.
G2000) was 1.5 m diameter foam with a 2.1 m high tower and river mouth. Being unmaintained was an important factor in
0.8 m high base (fig. 4). A smaller surface top-hat buoy, simi- choosing this inlet for study. Inlets maintained for commercial
lar to a small navigation buoy was used at the shallow site. and recreational boating are altered by anthropogenic forces,
To supplement the data summarized in this report, sedi- and the bathymetry of these systems may not be representative
ment samples were collected at both sites using a Shipek grab of the natural hydrodynamic processes that were measured,
sampler and processed for grain-size information using a likely causing errors in the estimates of sediment transport.
Horiba LA–960A laser-diffraction particle-size analyzer with Sediment fluxes may be driven by a variety of factors, such as
a slurry sampler. Results of the laboratory analysis of the grab along-shore flow, tidal flow, and wave-induced bottom stress.
samples are available in Suttles and others (2021). The flux, as the cause of sediment accretion or erosion, influ-
ences inlet stability and migration.
The two deployment sites were slightly north of the inlet
mouth (fig. 1), on a line perpendicular to both the shoreline
Site Description and bathymetric contours. The “shallow” site was 840 meters
from shore between the 8- and 9-meter depth contours. The
This study sought to explore inlet dynamics and expand
“deep” site was 1,300 meters from shore at the 15-meter
our knowledge of how storms may affect sediment stability depth contour. The sea floor at the shallow site was primarily
near an inlet. Matanzas Inlet is a natural, unmaintained inlet composed of medium-fine sand, and at the deep site it was
on the Florida Atlantic coast, south of St. Augustine. Much of composed of a finer grained silty sand (Suttles and others,
the east coast of the United States is developed, so this experi- 2021). This sediment is subject to resuspension in storms or
ment at Matanzas Inlet was a unique opportunity to study inlet times of increased currents or waves. The bathymetry in the
dynamics at a natural setting. The dynamics of interest are the area showed a consistent 1:100 gradient deepening offshore.
interaction of outflowing fresh water from the Matanzas River Additional sediment deposits with complicated structure were
with the tides, currents, and waves encountered beyond the observed at the mouth of the inlet.Site Description 3
ADCP
Acoustic release
with float
Pinger
ABSS
Sonar
ADV ADV
Sonar
Seagauge
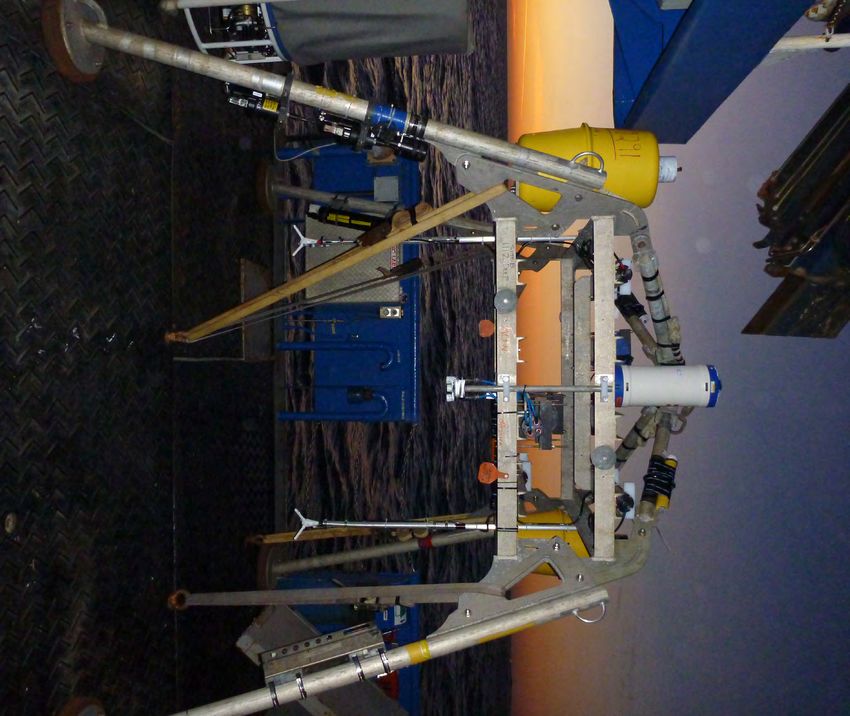
Figure 2. The instrumented sea-floor platform prior to deployment at the Matanzas Inlet, Florida, shallow site. The two Imagenex
sonars, Nortek acoustic Doppler velocimeters (ADVs), Aquatec Aquascat acoustic backscatter sensor (ABSS), upward-looking acoustic
Doppler current profilers (ADCPs), acoustic pingers, Sea-Bird Seagauge, and acoustic release recovery system are shown in this view.
Photograph by Ellyn Montgomery, U.S. Geological Survey.4 Summary of Oceanographic and Water-Quality Measurements Offshore of Matanzas Inlet, Florida, 2018
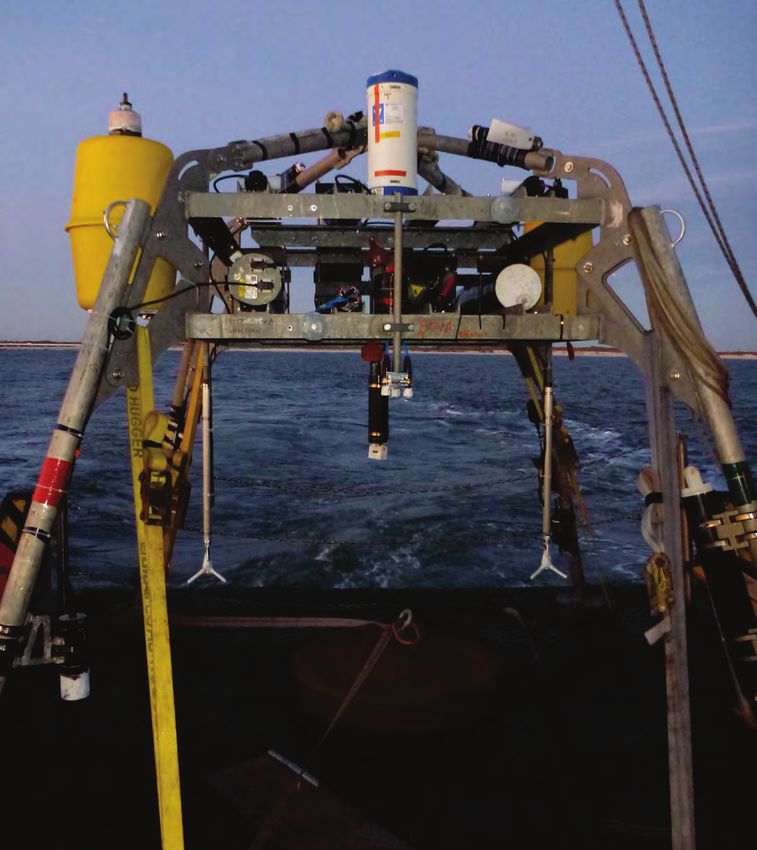
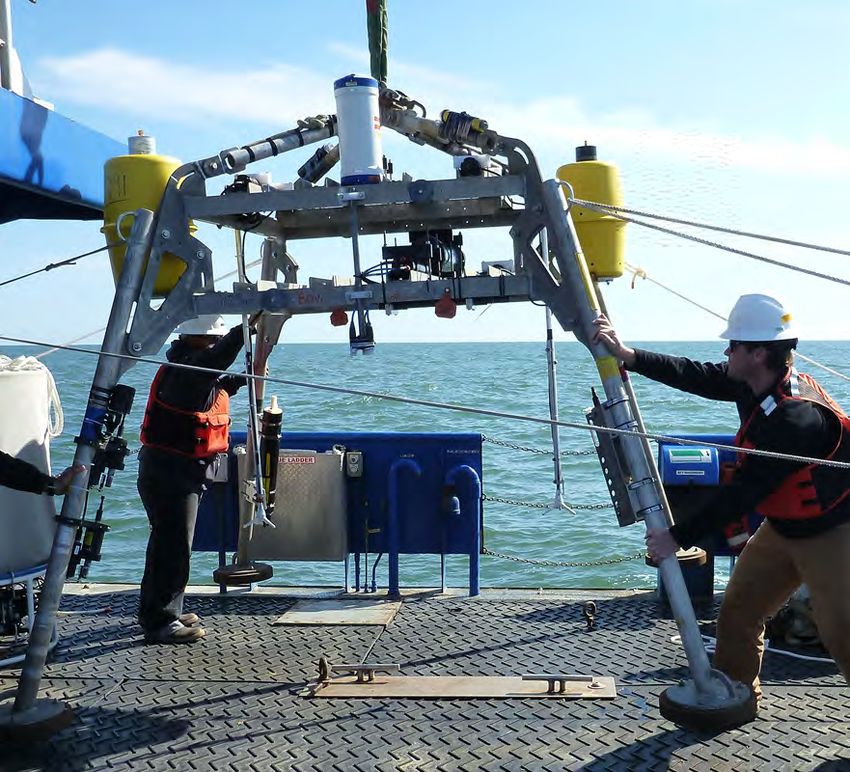
Figure 3. Instrumented sea-floor platform being moved on deck prior to deployment at the Matanzas Inlet, Florida, deep site.
Photograph by Ellyn Montgomery, U.S. Geological Survey.
Instruments (profiles and, in the case of the acoustic Doppler velocimeter
[ADV], single-point water velocities), (2) wave statistics,
Autonomous instruments, with internal power and (3) backscatter, (4) imaging sonar, (5) seawater temperature
memory, were deployed at the two sites from January 24 and salinity, and (6) meteorological observations.
to April 13, 2018, to measure the current velocity structure The following instruments, with measured parameters,
outside the surf zone near the Matanzas Inlet and the effects on were used to collect time-series data in this study:
sediment transport in response to periodic storm events. The • Nortek Aquadopp high-resolution (HR) acoustic
instruments on the bottom platforms (figs. 2 and 3) measured Doppler current profiler (ADCP): current profiles
ocean currents, wave motion, acoustic and optical backscatter,
temperature, salinity, and pressure to quantify the forcing for • Nortek Signature acoustic Doppler current profiler
sediment transport and response near the seabed. Two sonars (ADCP): current profiles
operating at different frequencies were mounted on the plat- • Nortek Vector acoustic Doppler velocimeter: single-
form at the shallow site to record how the sea-floor bedforms point current measurements
responded to ambient conditions.
The larger buoy at the deeper site supported meteorologi- • TRDI–V acoustic Doppler current profiler (ADCP):
cal measurement of local atmospheric conditions during the current profiles, waves (directional)
study (fig. 4), and both buoys measured near-surface water
temperature and salinity. The processed time-series data that • Sea-Bird model SBE 26 Seagauge: waves (nondi-
are reported here are presented in six categories: (1) currents rectional)Instruments 5
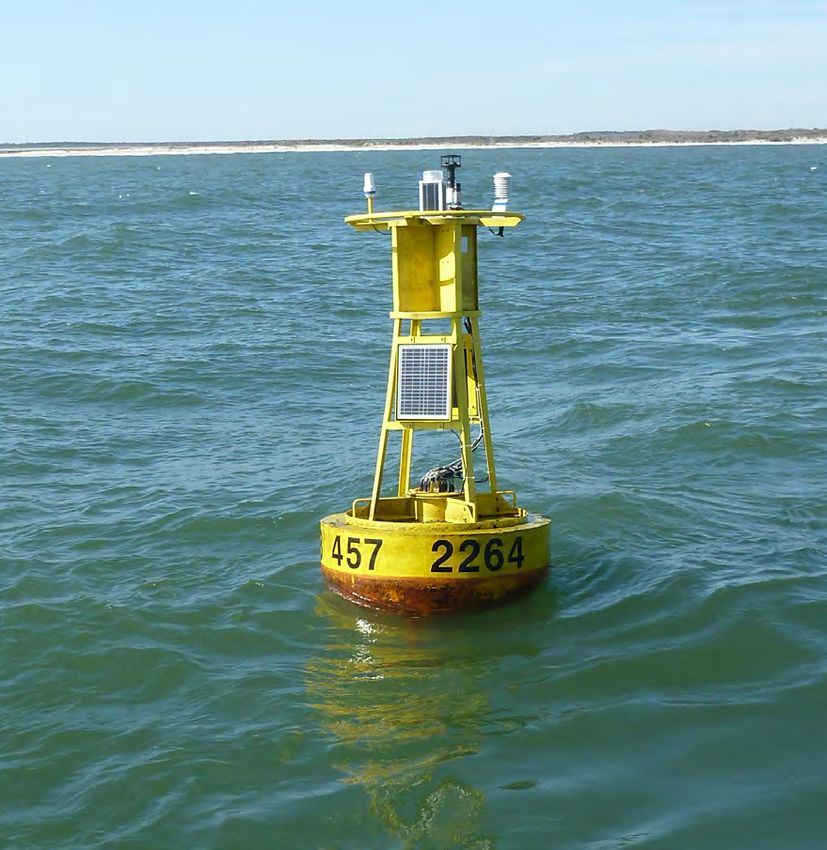
Figure 4. Surface buoy with meteorological sensors deployed at the deep site off Matanzas Inlet, Florida. Photograph by Ellyn
Montgomery, U.S. Geological Survey.
• Sea-Bird model SBE 37–SM MicroCAT: temperature • Down East weather station: meteorology (winds, baro-
and conductivity metric pressure, air temperature, relative humidity, and
shortwave solar radiation)
• Aquatec model Aquascat acoustic backscatter sensor:
acoustic backscatter profiles • Benthos pinger, to help locate the bottom platforms.
• Aquatec model Aqualogger 200TY with Seapoint opti- Tables 2–7 provide information on instruments used at
cal backscatter sensor: turbidity each site, elevation above the seabed, and available processed
results.
• Imagenex model 881B tilt-adjusting imaging sonar:
bedform evolution
Currents and Waves
• Imagenex model 881A high-frequency imaging sonar:
bedform evolution Both sea-floor platforms supported several instruments
that measured ocean properties at different depths as well as
concurrent depths, and the sea-floor platforms were spatially
separated for gradient computations. An upward-looking6 Summary of Oceanographic and Water-Quality Measurements Offshore of Matanzas Inlet, Florida, 2018
Table 2. Links to processed water flow (current velocity) data, by site and instrument, for platforms
deployed offshore of Matanzas Inlet, Florida, from January 24 to April 13, 2018.
[Data files are in Suttles and others (2019). ID, identification number; no., number; mab, meters above bottom;
ADCP, acoustic Doppler current profiler; HR, high resolution]
Sensor elevation
Mooring ID Instrument Serial no. Data file
(mab)
Shallow
1110 TRDI–V ADCP 23881 2.4 11101wh-a.nc
1110 Nortek Signature 100593 1.5 11102sig15m_iburstHR-cal.nc
1110 Nortek Signature 100593 1.5 11102sig15m_burst-cal.nc
1110 Nortek Vector 12249/5086 0.6 11109vecs-a.nc
Deep
1112 TRDI–V ADCP 23857 2.4 11121wh-a.nc
1112 Nortek Aquadopp HR 5374 1.5 11122HRaqd15m-a.nc
1112 Nortek Vector 11716/5096 0.6 11127vecs-a.nc
1112 Nortek Vector 12944/5243 0.6 11128vecs-a.nc
Table 3. Links to processed wave (directional and nondirectional) data, by site and instrument, for
platforms deployed offshore of Matanzas Inlet, Florida, from January 24 to April 13, 2018.
[Data files are in Suttles and others (2019). ID, identification number; no., number; mab, meters above bottom; Y, yes;
N, no]
Mooring Sensor elevation
Instrument Serial no. Data file Direction
ID (mab)
Shallow
1110 TRDI–V ADCP 23881 2.4 11101whVp-cal.nc Y
1110 Sea-Bird SBE 26 Seagauge 1378 0.4 111010sgw-cal.nc N
Deep
1112 TRDI–V ADCP 23857 2.4 11121whVp-cal.nc Y
1112 Sea-Bird SBE 26 Seagauge 1099 0.4 11129sgw-cal.nc N
TRDI–V current velocity profiler was mounted on each plat- top, quarter and bottom of each hour. On the shallow platform,
form at 2.4 meters above bottom (mab) (transducer height) to a Nortek Signature current velocity profiler sampled in 2 cen-
record the current profiles and wave statistics (height, period, timeter (cm) vertical beam bins and 20 cm slant beam bins,
and direction). The TRDI–V current velocity profilers were with hourly bursts of 8,192 points sampled hourly at 4 Hz; on
configured to measure the current profiles at 15-minute inter- the deep platform, a Nortek Aquadopp high-resolution current
vals and collect bursts of velocity and pressure data at hourly velocity profiler sampled in 5-cm vertical bins with hourly
intervals for directional wave analysis. The burst data are pro- bursts of 4,096 points sampled at 2 Hz.
vided in Suttles and others (2019) and included in appendix 1 Each platform also had a Sea-Bird SBE 26 Seagauge
for reader convenience. Wave statistics for both sites were Wave and Tide Recorder mounted at 0.4 mab to measure
calculated from the TRDI–V current velocity profiler’s beam pressure with Paroscientific Digiquartz sensors, which have
velocity profiles and pressure, sampled at 2 hertz (Hz) for an accuracy of 0.01 percent of the full measurement range of
4,096 samples (34.13 minutes) every hour. Each platform also the sensor. The Sea-Bird SBE 26 Seagauge at the shallow site
had a down-looking current velocity profiler to measure cur- had a 30-m full scale, and the one at the deep site had a 130-m
rent profiles within 1 meter of the sea floor; both downward- full scale. They sampled in hourly bursts of 4,096 points at
looking current velocity profilers recorded burst data that were 2 Hz. Nondirectional wave statistics and tidal elevations were
averaged after recovery from 120-second subsamples from the computed from the pressure burst data.Instruments 7
Table 4. Links to processed acoustic and optical backscatter, by site and instrument, for platforms
deployed offshore of Matanzas Inlet, Florida, from January 24 to April 13, 2018.
[Data files are in Suttles and others (2019). ID, identification number; no., number; mab, meters above bottom,
ABSS, acoustic backscatter sensor]
Sensor
Mooring
Instrument Serial no. elevation Data file
ID
(mab)
Shallow
1110 Aquatec Aquascat ABSS 910-131 1.3 11103abss15m-a.nc
1110 Nortek Signature 100593 1.5 11102sig15m_echo1-cal.nc
1110 Aqualogger 200TY 371-002/1875 0.74 11106slb-a.nc
1110 Aquatec Aqualogger 200TY 371-025/635 0.4 111011slb-a.nc
Deep
1112 Aquatec Aquascat ABSS 910-130 1.3 11123abss15m-a.nc
1112 Aquatec Aqualogger 200TY 371-004/144 0.9 11124slb-a.nc
1112 Aquatec Aqualogger 200TY 371-027/240 0.6 11126slb-a.nc
Table 5. Links to sonar data collected at the shallow site offshore of Matanzas Inlet, Florida, from
January 24 to April 13, 2018.
[Data files are in Suttles and others (2019). ID, identification number; no., number; mab, meters above bottom.]
Serial Sensor elevation
Mooring ID Instrument Data file
no. (mab)
Shallow
1110 Imagenex 881B imaging sonar 1751 1.0 11104fan_raw.cdf
1110 Imagenex 881A high-frequency 5908 0.45
11107hffan_raw.cdf
imaging sonar
Table 6. Links to processed seawater temperature and conductivity data, by site and instrument, for
platforms deployed offshore of Matanzas Inlet, Florida, from January 24 to April 13, 2018.
[Data files are in Suttles and others (2019). ID, identification number; no., number; mab, meters above bottom]
Sensor elevation
Mooring ID Instrument Serial no. Data file
(mab)
Shallow
1109 Sea-Bird SBE 37 MicroCAT 706 7.5 11091mc-a.nc
1110 Sea-Bird SBE 37 MicroCAT 3575 0.75 11105mc-a.nc
Deep
1111 Sea-Bird SBE 37 MicroCAT 465 14.2 11112mc-a.nc
1112 Sea-Bird SBE 37 MicroCAT 681 0.75 11125mc-a.nc8 Summary of Oceanographic and Water-Quality Measurements Offshore of Matanzas Inlet, Florida, 2018
Table 7. Link to meteorological data collected at the deep site offshore of Matanzas Inlet, Florida,
from January 24 to April 13, 2018.
[Data files are in Suttles and others (2019). ID, identification number; no., number; m, meter (above sea surface)]
Mooring ID Instrument Serial no. Sensor elevation (m) Data file
Deep
1111 Down East weather station USGS-2 -2.5 11111met-a-fix.nc
Finally, both platforms had two additional Nortek Vector Sonar Bedform Imaging
velocimeters mounted 0.5 mab and separated by 2 m horizon-
tal distance. The shallow bottom frame was deployed such that The sea floor at the shallow platform was expected to be
the velocimeter probes were aligned parallel to the shoreline. more dynamic, so both Imagenex sonars were mounted there.
Each velocimeter collected hourly bursts of 32,768 points It had two imaging sonars with different frequencies to enable
sampled at 16 Hz. robust data collection over the widest range of conditions. The
The Nortek Aquadopp, Nortek Signature, Nortek high-frequency sonar, operated at 2.25 MHz, was mounted on
Vectors, and Sea-Bird Seagauge instruments all operated for a leg at 0.45 mab and imaged the seabed every 30 minutes.
the complete duration of the deployment (about 2.5 months). The low-frequency sonar, operated at 1.33 MHz, was mounted
Unfortunately, the TRDI–V at the shallow site failed to get between two adjacent legs at 0.96 mab and imaged the seabed
power from its external battery, so its record ends early on every hour. Both sonars operated for the full duration of the
February 23 (about 1 month). The TRDI–V at the deep site deployment. The regions imaged by the sonars overlapped so
functioned throughout the deployment; however, it experi- that stereoscopic techniques could be employed to analyze
enced intermittent power failures throughout due to a poor ripple size, shape, and orientation.
power connection with the external battery. This created 1- to
2-minute gaps in some of the burst data. Wave statistics were
calculated from bursts that were complete. The entire raw Temperature, Conductivity
burst datasets are released for completeness.
Sea-Bird MicroCATs were attached to the underwater
structure of the buoys at both sites to measure near-surface
Backscatter (Turbidity) water temperature and conductivity every 5 minutes. A Micro-
CAT was also mounted on each quadpod at 0.75 mab to record
Both sea-floor platforms supported sensors to evaluate data near the other near-sea-floor observations. All four Micro-
turbidity using acoustic and optical methods. To record acous- CATs recorded data throughout the deployment. The conduc-
tic backscatter profiles, downward-looking Aquatec Aquascat tivity cell on the shallow platform clogged during a storm on
acoustic backscatter sensors with three transducers (0.5, 2.5, February 11, after which no salinity data are available.
and 4.0 megahertz [MHz]) were mounted on each quadpod
at 1.3 mab. Each acoustic backscatter sensor recorded hourly
bursts of 2,048 samples at 2 Hz in 1-cm depth bins. Like the Meteorological Observations
velocity data, these data were also averaged after recovery
At the deep site a buoy-mounted weather station made by
from 120-second subsamples, but only at the top and quarter
Down East provided local meteorological conditions during
hour since these bursts were only 1,024 seconds long.
the study period. The sensors were mounted 2.5 meters above
On each bottom platform, optical backscatter was
the sea surface, and they measured air temperature, baromet-
measured by two Aquatec Aqualoggers with Seapoint optical
ric pressure, wind speed and direction, relative humidity, and
backscatter sensors mounted on one leg. These were placed
shortwave radiation throughout the deployment.
at 0.74 and 0.4 mab at the shallow site and 0.9 and 0.6 mab
at the deep site. Only the upper sensor on the shallow plat-
form logged data for the entire deployment, but three others Antifouling
recorded data that passed quality assurance and control for
almost the whole duration. Data from the lower sensor on the The optical and acoustic sensor transducers and the sonar
shallow platform end on April 5, when the head was sheared heads were covered with zinc oxide paste just prior to deploy-
off. On the deep platform, both optical sensors became fouled ment to discourage the settling and growth of organisms.
during the deployment; data that passed quality assurance and
control recording from the upper sensor end on April 2, and
from the lower sensor they end on March 9.Results 9
Data Processing Results
All the deployed instruments were autonomous, with Time-series data quantifying currents, waves, acoustic
internal data storage. After recovery, data were offloaded and optical backscatter, sonar images, and meteorological
from the instruments. Manufacturers’ software was used to conditions were collected to estimate how sediment dynam-
apply calibration coefficients and convert the data to scien- ics near a natural inlet respond to periodic storms. The overall
tific units. These output files were then converted by custom, data return for the experiment exceeded 80 percent. The most
instrument-specific MATLAB programs to Equatorial Pacific common cause of data loss was instrument or sensor failures,
Information Collection (EPIC) convention-compliant Network most notably the TRDI–V at the shallow site. The other sig-
Common Data Form (netCDF) files for release and distribu- nificant cause of data loss was fouling of the conductivity and
tion on the U.S. Geological Survey Oceanographic Time- temperature sensors on the MicroCATs and backscatter sen-
Series Data Collection website. Files listed in this report are sors. There was heavy barnacle and encrusting biofouling on
available in Suttles and others (2019); links provided in the the aluminum quadpods and the instrument housings, but the
tables are for reader convenience. Additional information on zinc oxide paste effectively prevented the encrusting organ-
data processing, quality assurance and control protocols, file isms from attaching to the transducers (fig. 5).
formats, nomenclature, and access methods used is provided Note that the platform at the shallow site rotated from
in Montgomery and others (2008). its original deployment position several times during storms.
All subsurface pressure data (data from the TRDI–V The heading, pitch, and roll data from the sensors indicate the
ADCPs, Nortek Signature, Nortek Vector, Nortek Aquadopp, platform rotated on February 1, 3, and 13, about 5 degrees
and Sea-Bird Seagauge instruments) were corrected for west each time, and on March 5, the platform rotated 20
changes in atmospheric pressure by using local barometric degrees west (west rotation is negative or counterclockwise).
pressure data from the meteorological station at the deep site This movement is accounted for in the treatment of cur-
(mooring number 1111). This was done to give a more accu- rents and waves data and is not accounted for in the sonar
rate representation of pressure caused by the overlying water. image data, since the sonar data are distributed without any
Corrected pressure records were saved in the netCDF files transformations.
with the variable name “P_1ac.” The landing page for these data (Suttles and others,
The TRDI–V current velocity profiler wave data were 2019) contains details of all field activities associated with this
processed with the manufacturer’s software to output spec- project, Google Earth visualizations of deployment locations,
tra (pressure, surface, velocity) and these statistics (variable and sampling interval information. The edited, final data can
names are in parentheses): be downloaded from the catalog of data web page or accessed
• significant wave height (wh_4061) directly at the “Data access via THREDDS” (thematic real-
time distributed data services) links on the landing page. File
• mean wave height (mwh_4064) naming conventions for time-series observations are described
in appendix 1 of Montgomery and others (2008). Results from
• peak period (wp_peak) each data category are reviewed in the following subsections.
• mean period (wp_4060)
• direction of the peak wave period (wvdir) Currents
Quality control and quality assurance checks were per- The TRDI–V current velocity profiler on the shallow
formed on all the data collected. Measurements that did not platform only collected a month of data, but the other TRDI–V
pass the quality control and quality assurance process were at the deep site worked for the full 2.5 months, providing one
replaced with fill values in the netCDF output file. Fill values full record of upward-looking current profiles (fig. 6). The
indicate nonvalid data points and are assigned a value of 1e35 data from both sites show peaks in near-sea-floor currents to
for floating point variables and −32,768 for integer variables. the south, with speeds >50 cm/s. The surface currents fol-
Obvious spikes in individual parameter time series were lowed the same pattern but had more northerly excursions.
removed by using either a recursive filter or median filter tech- The single-point current sensors (velocimeters) also provided
nique, in which values that changed from one time point to the nearly complete records for the deployment. Each site also
next by more than a set threshold were flagged and assigned a had downward-looking current profilers within a meter of the
fill value. Velocity data from the current velocity profilers and sea floor. The combination of upward-looking and downward-
velocimeters were checked for low correlation values, which looking profiles (fig. 7) allows us to gain insights about how
were replaced by fill values. For upward-looking current the water is moving in the entire water column. Table 2 lists
velocity profiles, velocity bins that were too close to or above all current velocity results with links to the locations of the
the water surface were likewise assigned fill values. processed netCDF output files.10 Summary of Oceanographic and Water-Quality Measurements Offshore of Matanzas Inlet, Florida, 2018
Figure 5. Biofouling on the quadpod shown compared to minimal fouling on sensors coated with zinc oxide paste (white). Photograph
by Dann Blackwood, U.S. Geological Survey.
Waves sizes, and the frequencies are used in tandem to understand the
drivers of sediment resuspension. The data from the 2.5-MHz
Spectra and statistics for directional waves from the transducer (fig. 9) indicate several sediment resuspension
TRDI–V and nondirectional waves from Seagauge pressure events (indicated by bands of lighter color) during the deploy-
loggers were calculated (fig. 8). When wave energy was low ment. The changing sea-floor elevation is shown by the bright
and significant wave heights were small (Results 11
Water Flow Observations
4
Shallow Site ADCP
Significant Wave
Shallow Site Seagauge
3
Height (m)
Deep Site ADCP
Deep Site Seagauge
2
1
0
2018-02-01 2018-03-01 2018-04-01
Near-Surface Velocity Bin
100
Eastward Velocity,
Shallow Site ADCP
Surface (cm/s)
50 Deep Site ADCP
0
-50
-100
2018-02-01 2018-03-01 2018-04-01
100
Northward Velocity,
Shallow Site ADCP
Surface (cm/s)
50 Deep Site ADCP
0
-50
-100
2018-02-01 2018-03-01 2018-04-01
Near-Sea-Floor Velocity Bin
100
Eastward Velocity,
Shallow Site ADCP
Bottom (cm/s)
50 Deep Site ADCP
0
-50
-100
2018-02-01 2018-03-01 2018-04-01
100
Northward Velocity,
Shallow Site ADCP
Bottom (cm/s)
50 Deep Site ADCP
0
-50
-100
2018-02-01 2018-03-01 2018-04-01
Figure 6. Current data from the acoustic Doppler current profilers (ADCPs) from both platforms, showing near-surface and
near-sea-floor observations, along with significant wave height in the top frame, Matanzas Inlet, Florida (Suttles and others, 2019). cm/s,
centimeter per second; m, meter.12 Summary of Oceanographic and Water-Quality Measurements Offshore of Matanzas Inlet, Florida, 2018
Shallow Site East Velocity
30
−7.4
20
Centimeters per Second
−7.6
10
−7.8
Depth (m)
0
−8.0
−10
−8.2
−20
−8.4
−30
2018-02-01 2018-02-15 2018-03-01 2018-03-15 2018-04-01
Shallow Site North Velocity
30
−7.4
20
Centimeters per Second
−7.6
10
−7.8
Depth (m)
0
−8.0
−10
−8.2
−20
−8.4
−30
2018-02-01 2018-02-15 2018-03-01 2018-03-15 2018-04-01
Deep Site East Velocity
−13.8 30
20
Centimeters per Second
−14.0
10
−14.2
Depth (m)
0
−14.4
−10
−14.6
−20
−14.8
−30
2018-02-01 2018-02-15 2018-03-01 2018-03-15 2018-04-01
Deep Site North Velocity
−13.8 30
20
Centimeters per Second
−14.0
10
−14.2
Depth (m)
0
−14.4
−10
−14.6
−20
−14.8
−30
2018-02-01 2018-02-15 2018-03-01 2018-03-15 2018-04-01
Figure 7. Profiles of east and north components of velocity from the downward-looking acoustic Doppler current profilers above the
sea floor, Matanzas Inlet, Florida (Suttles and others, 2019). m, meter.Results 13
3
Shallow Site ADCP
Significant Wave
Shallow Site Seagauge
2
Height (m)
Deep Site ADCP
Deep Site Seagauge
1
0
2018-02-01 2018-03-01 2018-04-01
12
Shallow Site ADCP
10 Shallow Site Seagauge
Mean Wave
Deep Site ADCP
Period (s)
8 Deep Site Seagauge
6
4
2
2018-02-01 2018-03-01 2018-04-01
25
Shallow Site ADCP
20 Shallow Site Seagauge
Peak Wave
Deep Site ADCP
Period (s)
15 Deep Site Seagauge
10
5
0
2018-02-01 2018-03-01 2018-04-01
Direction (Degrees North)
Shallow Site ADCP
300
Deep Site ADCP
Peak Wave
200
100
0
2018-02-01 2018-03-01 2018-04-01
Figure 8. Wave statistics from upward-looking acoustic Doppler current profilers (ADCPs, directional) and Sea-Bird Seagauge
(nondirectional) pressure loggers at both sites, Matanzas Inlet, Florida (Suttles and others, 2019). m, meter; s, second.14 Summary of Oceanographic and Water-Quality Measurements Offshore of Matanzas Inlet, Florida, 2018
Shallow Site ADCP
2.5 Shallow Site Seagauge
Deep Site ADCP
Deep Site Seagauge
Significant Wave Height (m)
2.0
1.5
1.0
0.5
2018-02-01 2018-02-15 2018-03-01 2018-03-15 2018-04-01
Shallow Site Acoustic Backscatter At 2.5 MHz
−20
7.4
−40
7.6
−60
7.8
−80
Decibels (dB)
Depth (m)
8.0
−100
8.2
−120
8.4 −140
8.6 −160
8.8 −180
2018-02-01 2018-02-15 2018-03-01 2018-03-15 2018-04-01
Deep Site Acoustic Backscatter At 2.5 MHz
−20
13.8 −40
14.0 −60
14.2 −80
Decibels (dB)
Depth (m)
−100
14.4
−120
14.6
−140
14.8
−160
15.0
−180
2018-02-01 2018-02-15 2018-03-01 2018-03-15 2018-04-01
Figure 9. Profiles of acoustic backscatter at 2.5 megahertz (MHz) for both sites, Matanzas Inlet, Florida are compared with significant
wave height from upward-looking acoustic Doppler current profilers (ADCPs, directional) and Sea-Bird Seagauge (nondirectional)
pressure loggers at both sites, Matanzas Inlet, Florida (Suttles and others, 2019). m, meter.Results 15
Shallow Site
700
0.7 mab (11106slb-a.nc)
600 0.4 mab (111011slb-a.nc)
500
Turbidity (NTU)
400
300
200
100
0
2018-02-01 2018-03-01 2018-04-01
Deep Site
250
0.7 mab (11106slb-a.nc)
0.4 mab (111011slb-a.nc)
200
Turbidity (NTU)
150
100
50
0
2018-02-01 2018-03-01 2018-04-01
Figure 10. Near-sea-floor turbidity observations collected at both sites, Matanzas Inlet, Florida. The files from which the data were
plotted are in parentheses (Suttles and others, 2019). mab, meter above bottom; NTU, nephelometric turbidity unit.
programmed to leave a thin slice of the circle empty for Temperature and Conductivity
additional quality assurance and control. The positions of the
empty zones relative to each other and the known orientations Sea-Bird SBE 37–SM MicroCAT instruments, measuring
of the sonars are additional confirmation that the images are conductivity and temperature, were deployed at both sites to
correctly rotated so that north is up (fig. 11). The image from record surface and near-sea-floor conditions. All four collected
each timestep may be assembled to make a movie, which data successfully throughout the deployment (fig. 12). Near
displays migration of ripples and the occurrence of sedi- the sea floor, the conductivity cell at the shallow site became
ment resuspension events due to storms (when the suspended clogged on February 11, after which the sensor (11105mc) no
sediment is too dense for imaging). Note that the sonar data longer recorded valid salinity data (and values were replaced
as released in Suttles and others (2019) are in raw form, as with the fill value). The near-surface water temperatures
downloaded from the instrument. Platform movement due to showed marked daily variations, whereas the near-sea-floor
storms must be accounted for when rotating the images into a sensors show less variation.
Cartesian framework.16 Summary of Oceanographic and Water-Quality Measurements Offshore of Matanzas Inlet, Florida, 2018
Imagenex 881A HF Sonar Image, 2018-01-25
4
2
Meters
0
−2
−4
−4 −2 0 2 4
Meters
Figure 11. Example bottom image from the high-frequency (HF) sonar data showing distinct ripples
on the seabed, Matanzas Inlet, Florida (Suttles and others, 2019).
Meteorological identified by wind speeds greater than 10 m/s and falling baro-
metric pressure data. Of note are events on or near January 31,
Local meteorological conditions were recorded to provide February 3, February 14, and March 4, which moved the
accurate corrections to the underwater pressure measurements bottom frame at the shallow site, indicated by shifts in the
(figs. 13 and 14). The sensors indicate large daily variations in heading of the ADCPs.
all measurements, overlaid by passing storms, which can beResults 17
Shallow Site
25
Temperature (°C)
20
15 7.5 mab (11091mc-a.nc)
0.8 mab (11105mc-a.nc)
2018-02-01 2018-03-01 2018-04-01
5
Conductivity (S/m)
4.5
4
7.5 mab (11091mc-a.nc)
0.8 mab (11105mc-a.nc)
3.5
2018-02-01 2018-03-01 2018-04-01
Deep Site
25
Temperature (°C)
20
15 14.2 mab (11112mc-a.nc)
0.8 mab (11125mc-a.nc)
2018-02-01 2018-03-01 2018-04-01
5
Conductivity (S/m)
4.5
4
14.2 mab (11112mc-a.nc)
0.8 mab (11125mc-a.nc)
3.5
2018-02-01 2018-03-01 2018-04-01
Figure 12. Temperature and conductivity measured by the MicroCATs near the surface and near the sea floor at shallow and deep
sites, Matanzas Inlet, Florida (Suttles and others, 2019). The files from which the data were plotted are in parentheses. °C, degree
Celsius; S/m, siemens per meter.18 Summary of Oceanographic and Water-Quality Measurements Offshore of Matanzas Inlet, Florida, 2018
30
25
Air Temperature
20
(°C)
15
10
5
2018-02-01 2018-03-01 2018-04-01
100
80
Relative Humidity
(%)
60
40
20
2018-02-01 2018-03-01 2018-04-01
15
Shortwave Radiation
10
2
(W/m )
5
0
2018-02-01 2018-03-01 2018-04-01
Figure 13. Air temperature, relative humidity, and shortwave radiation from the deep site, Matanzas Inlet, Florida (Suttles and others,
2019). °C, degree Celsius; %, percent; W/m2, watt per square meter.Results 19
1040
Barometric Pressure
1030
(hPa)
1020
1010
1000
2018-02-01 2018-03-01 2018-04-01
15
Wind Speed
10
(m/s)
5
0
2018-02-01 2018-03-01 2018-04-01
20
15
Wind Gust
(m/s)
10
5
0
2018-02-01 2018-03-01 2018-04-01
400
300
Wind Direction
(Degrees)
200
100
0
2018-02-01 2018-03-01 2018-04-01
Figure 14. Barometric pressure, wind speed, wind gust, and wind direction from the deep site, Matanzas Inlet, Florida (Suttles and
others, 2019). hPa, hectopascal; m/s, meter per second.20 Summary of Oceanographic and Water-Quality Measurements Offshore of Matanzas Inlet, Florida, 2018 References Cited Montgomery, E.T., Martini, M.A., Lightsom, F.L., and Butman, B., 2008, Documentation of the U.S. Geological Survey oceanographic time-series measurement database (ver. 3.0, April 2021): U.S. Geological Survey Open- File Report 2007–1194, accessed April 20, 2021, at https://doi.org/10.3133/ofr20071194. Suttles, S.E., Warner, J.C., Montgomery, E.T. and Martini, M.A., 2019, Oceanographic and water quality measure- ments in the nearshore zone at Matanzas Inlet, Florida, January–April, 2018: U.S. Geological Survey data release, https://doi.org/10.5066/P9GKB537. Suttles, S.E., De Meo, O.A., Martini, M.A, and Warner, J.C., 2021, Grain-size analysis data from sediment samples in support of oceanographic and water-quality measurements in the nearshore zone of Matanzas Inlet, Florida, 2018— U.S. Geological Survey Field Activity: U.S. Geological Survey data release, https://doi.org/10.5066/P9FKARIZ.
Appendix 1  21

Appendix 1. Burst Data, Matanzas Inlet, Florida, January–April 2018

Table 1.1. Links to burst data, by site and instrument, for sea-floor platforms deployed offshore of
Matanzas Inlet, Florida, from January 24 to April 13, 2018.
[Data files are in Suttles and others (2019). ID, identification number; no., number; mab, meters above bottom; ADCP,
acoustic Doppler current profiler; ABSS, acoustic backscatter sensor; HR, high resolution]

                                                                       Sensor
  Mooring ID                Instrument                Serial no.      elevation                Data file
                                                                        (mab)
                                                      Shallow
 1110             TRDI–V ADCP                       23881                2.4       11101whVr-cal.cdf
 1110             Nortek Signature                  100593               1.5       11102sigb_burst-cal.nc
 1110             Nortek Signature                  100593               1.5       11102sigb_echo1-cal.nc
 1110             Nortek Signature                  100593               1.5       11102sigb_iburstHR-cal.nc
 1110             Aquatec Aquascat ABSS             910-131              1.3       11103abssb-cal.nc
 1110             Nortek Vector                     12249/5086           0.6       11109vecb-cal.nc
 1110             Sea-Bird SBE 26 Seagauge          1378                 0.4       111010sgr-cal.nc
                                                        Deep
 1112             TRDI–V ADCP                       23857                2.4       11121whVr-cal.cdf
 1112             Nortek Aquadopp HR                5374                 1.5       11122HRaqdb-cal.nc
 1112             Aquatec Aquascat ABSS             910-130              1.3       11123abssb-cal.nc
 1112             Nortek Vector                     11716/5096           0.6       11127vecb-cal.nc
 1112             Nortek Vector                     11716                2.0       11127vectx-a.nc
 1112             Nortek Vector                     12944/5243           0.6       11128vecb-cal.nc
 1112             Sea-Bird SBE 26 Seagauge          1099                 0.4       11129sgr-a.nc
For more information about this report, contact: Director, Woods Hole Coastal and Marine Science Center U.S. Geological Survey 384 Woods Hole Road Quissett Campus Woods Hole, MA 02543–1598 WHSC_science_director@usgs.gov (508) 548–8700 or (508) 457–2200 or visit our website at https://www.usgs.gov/centers/whcmsc Publishing support provided by the Pembroke Publishing Service Center
Martini and others—Summary of Oceanographic and Water-Quality Measurements Offshore of Matanzas Inlet, Florida, 2018—OFR 2021–1014
https://doi.org/10.3133/ofr20211014
ISSN 2331-1258 (online)You can also read