ACQUISITION AND PROCESSING OF DATA IN CPS FOR REMOTE MONITORING OF THE HUMAN FUNCTIONAL STATE
←
→
Page content transcription
If your browser does not render page correctly, please read the page content below
ADVANCES IN CYBER-PHYSICAL SYSTEMS
Vol. 6, Num. 1, 2021
ACQUISITION AND PROCESSING OF DATA IN CPS FOR REMOTE
MONITORING OF THE HUMAN FUNCTIONAL STATE
Petro Hupalo and Anatoliy Melnyk
Lviv Polytechnic National University, 12, Bandera Str, Lviv, 79013, Ukraine
Author's e-mail: gypalo911@gmail.com; anatoliy.o.melnyk@lpnu.ua
https://doi.org/10.23939/acps2021.01.___
Submitted on 02.05.2021
© Hupalo P., Melnyk A., 2021
Abstract – Data acquisition and processing in cyber-physical healthcare diagnostics using data collected with wireless
system for remote monitoring of the human functional state wearable devices.
have been considered in the paper. The data processing steps,
strategies for multi-step forecasting evaluation metrics and II. CURRENT STATUS OF THE PROBLEM
machine learning algorithms to be implemented have been
analysed and described. What is important, this way it will be With the popularization of smartphone use,
possible to track the condition of the sick and response to the applications of wearable technology have exploded,
health changes in advance. converged with artificial intelligence (AI), IoT, and smart
sensing. Today, they are widely used not only in the
Index terms: biometric data, data collection, machine healthcare industry but also in gaming, communications,
learning, neural networks, remote monitoring of human state. industrial operations, and safety. For example, in healthcare,
IBM offers a wide variety of mobile services through its
I. INTRODUCTION Mobile Wireless Health Solutions, and GE Healthcare has
Wearable technology has added a whole new developed Vscan to provide more accurate and faster
dimension in the healthcare system by real-time continuous healthcare services that are not constrained by time and
monitoring of human body physiology. They are used in place.
daily activities and fitness monitoring and have even Wearable devices in healthcare consist of various
penetrated in monitoring the health condition of patients devices, including wearable fitness trackers, smart health
suffering from chronic illnesses. watches, wearable ECG monitors, wearable blood pressure
The wearable medical devices face the challenges of monitors, and biosensors. The development of smartphone
reliability, accuracy, precision, and robustness. There are apps has helped provide a wide range of healthcare services
two important sub-sections for a complete wearable medical and this trend is expected to accelerate in the future. Apple’s
device: hardware, which involves the sensor selection and Watch, Garmin’s series of devices, Galaxy Watch of
characterization, noise removal from the acquired signals, Samsung Electronics, Fitbit’s, and Xiaomi’s Mi Band are
and communication to the decision-making subsystem and good examples [3].
software, which involves taking decisions based on the Developed data acquisition and processing tools
acquired signals. The second subsystem is where the consist of the next parts:
machine learning comes into play, and the recent outburst of wearable devices (Garmin, Apple Watch, any other
development in the field of machine learning has increased that can export data to health data aggregators like
the possibility of remote monitoring and diagnosing with the Apple Health)
acquired data from the wearable devices. mobile application (both for iOS and Android)
The machine learning block of the wearable devices server-side (to collect and process aggregated data)
involves various steps such as pre-processing, feature machine learning models (that are training, testing
selection, training on the labelled dataset, and testing to and doing prediction on the server)
verify its accuracy and competency. Thus, it is inevitable
Based on that structure a contemporary and convenient
that machine learning methods that include algorithm
system for people who want to analyze and share their
training are required to enable the diagnosis of different
functional state data to their doctor was created. Using that
diseases [1].
system for 3 months by 10 regular users, a dataset of their
Human state remote monitoring tools contain wireless
functional state mostly continuously every day was
wearable devices that measure its status parameters, cloud
collected. Among indicators that had been collected there
storage and data processing services. The work of remote
were oxygen saturation (SpO2), heart rate and respiration
monitoring tools consists in the transfer of data from
rate with the further growth of wearable devices that would
wireless wearable devices to cloud services and the
be possible to extend that list with such important indicators
interaction of these services with mobile user terminals [2].
as temperature, glucose level and blood pressure. Each
This paper is intended to describe the system of remote
additional sensor included in a device can be used to add
monitoring of the human functional state and give an
additional types of metrics for the user or supply internal
overview of the implementation of machine learning for
algorithms with additional data to improve accuracy of2 Petro Hupalo, Anatoliy Melnyk
already available metric types. However, additional sensors Size and weight
affect price and power consumption [4]. Wireless communication function with a
If to look from the side of how much data is being smartphone (via Bluetooth)
collected using wearable devices and their ability to obtain Ability to export blood oxygen saturation data to
large amounts of information in real time, it is obvious to GoogleFit on Android and HealthKit on iOS
say that data has become too big in amount, and it changes
Measurement accuracy
shape almost as fast as it accumulates. Big data has emerged
as the catch-all term for both the data itself and also for the Duration of autonomous work
tools and practices people use to get it under control. That is Periodic measurement.
why, that is a good field for machine learning problems of Based on the conducted analysis of pulse oximeters
forecasting, classification and clustering [3]. available on the market, there were selected devices that can
Consequently, the main aim of the data acquisition and be used in cyber-physical systems for 24/7 monitoring of
processing tools for remote monitoring of the human lung functions, what means they are portable, have wireless
functional state is not only to process and share data to the communication function with a smartphone (via Bluetooth)
doctors, but also to give them advanced insight information and provide the ability to export saturation data blood
to define and prevent many illnesses on early stage. oxygen SpO2 to GoogleFit on Android and HealthKit on
Especially during the Covid-19 pandemic when any minor iOS. Here are some specific devices that were used by
changes in the main human health indicators can have their people who exported data to the created system:
effects very quickly. That is why, the reaction on that should Garmin Vivoactive 4/4s, Venu
not be delayed. Garmin Fenix 6/5
Garmin Vivomove 4
III. DATA ACQUISITION IN CYBER-PHYSICAL Apple Watch Series 6
SYSTEM FOR REMOTE MONITORING OF THE Huawei Band 4
HUMAN FUNCTIONAL STATE Beurer PO 60 Bluetooth® pulse oximeter
A. SELECTION OF WEARABLES B. DATA TRANSFERRING
New fitness trackers and smartwatches are released to As it was mentioned above, it is important to choose
the consumer market every year. These devices are devices that can measure health indicators continuously and
equipped with different sensors, algorithms, and export data via Bluetooth or WiFi.
accompanying mobile apps. With recent advances in mobile The measuring device includes sensors that collect
sensor technology, privately collected physical activity data information and transmit it to a mobile terminal.
can be used as an addition to existing methods for health The mobile terminal includes a block for receiving
data acquisition in research. Furthermore, data collected data from measuring device sensors, a data transfer unit to
from these devices have possible applications in patient the cloud service (for interaction with the cloud service), an
diagnostics and treatment. With an increasing number of authentication unit (for interaction with the authentication
diverse brands, there is a need for an overview of device service) and a secure storage (for storing the necessary
sensor support, as well as device applicability in research personal data).
projects[5] [5]. The cloud service receives data from the mobile
The main goal was to define devices that can be used terminal (using a secure https channel) as a REST API. As
to track lungs health state due to the Covid-19 pandemic. in the mobile terminal, there is an authentication unit. Fig.1
Beside smart watches there were also analyzed different shows the transmission process from the measuring device
pulse-oximeters which could satisfy defined characteristics. to mobile terminal and cloud service.
Pulse oximeters, which are used in cyber-physical
systems for 24/7 monitoring of lung function, must be
connected to a smartphone via the Bluetooth interface to
transmit measurement data.
Mobile applications connected to heart rate monitors
must integrate with GoogleFit on Android and HealthKit on
iOS to combine data from different sensors.
Pulse oximeters must be portable and have a long
battery life.
The accuracy of their blood oxygen saturation
Fig. 1. Transmission of data measured with a measuring
measurement should not be lower than in calibrated medical
device using Bluetooth technology to the mobile terminal
devices.
and cloud service.
Pulse oximeters should measure blood oxygen
saturation with SpO2 over certain time intervals without the The information measured by the sensor is transmitted
human intervention. using Bluetooth technology to the user mobile terminal.
Based on the above, we can form the following Then the data are automatically sent through the network of
criteria for comparison and selection of pulse oximeters [6]: the mobile operator or WiFi to the server without the user’s
Price participation. The only thing user should care about is that
Portability his mobile terminal should be connected to the internet.Acquisition and Processing of Data in CPS for Remote Monitoring of the Human functional State 3
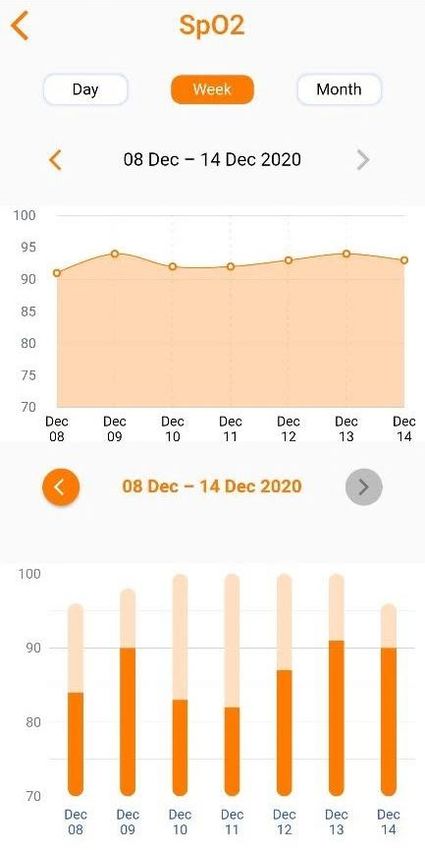
C. DATA ACQUISITION AFTER Developed system presents graphs of average values of
TRANSFERRING OR AGGREGATION FROM indicators for the day, week and month, as well as graphs of
EXTERNAL SOURCES minimum and maximum values. For example, in Fig. 2 the
After the data from devices was accepted by Cloud graphs of average (top), minimum and maximum (bottom)
Service it needs to be properly stored in the database. When values of blood oxygen saturation of a patient are shown
creating systems that collect data from different devices or (obtained during the week). As it can be seen, the average
services that is necessary to process it differently depending values are within acceptable limits. However, the minimum
on the technologies that are provided by the device values of the first patient are a cause for concern. Therefore,
manufacturer. the doctor should pay attention to them and conduct
Here is presented small part of response from Garmin additional research, in particular to analyze all the indicators
health API after user synchronized his devices with the obtained from the first patient. To do this, in the application
Cloud Service: it is possible to view all the measured indicators on the basis
{"dailies"=>[{"userId"=>"02236a89-0fb8-4a2e-9f6a- of which the graphs are based. The indicators of the second
4a9b6b84e825", patient are satisfactory.
"summaryId"=>"x35eb9dc-60ac13d0-d728-6", In the process of measurement, the question of
"calendarDate"=>"2021-05-25", reliability of the measured indicators is important. In
"activityType"=>"WALKING", particular, the accuracy of the measurement may be affected
"activeKilocalories"=>85, by external factors, such as the position of the human body
"bmrKilocalories"=>1390, or the movement during the measurements. For example,
"steps"=>5481, measuring blood oxygen saturation while a patient is
"distanceInMeters"=>4563.0, moving may be inaccurate. Therefore, it is necessary to
"durationInSeconds"=>55080, process the received indicators. That is considered
"activeTimeInSeconds"=>4737, inappropriate to use tracking filters, in particular the Kalman
"startTimeInSeconds"=>1621890000, filter, because they distort the obtained indicators. At the
"startTimeOffsetInSeconds"=>10800, same time, creating a histogram of indicators for the period
"moderateIntensityDurationInSeconds"=>0, of time and the ratio of the periods of maximum or
"vigorousIntensityDurationInSeconds"=>0, minimum values of the indicators to the total measurement
"floorsClimbed"=>1, time will be useful.
"minHeartRateInBeatsPerMinute"=>38,
"maxHeartRateInBeatsPerMinute"=>103,
"averageHeartRateInBeatsPerMinute"=>55,
"restingHeartRateInBeatsPerMinute"=>40,
"timeOffsetHeartRateSamples"=>{"15"=>58, "30"=>58,
"45"=>58, "60"=>58, "75"=>58, "90"=>58, "105"=>58,
"120"=>58, "135"=>58, "150"=>58, "165"=>58,
"180"=>58, "195"=>59, "210"=>59, "225"=>59,
"240"=>59, "255"=>58, "270"=>58, "285"=>58,
"300"=>58, "315"=>59, "330"=>59, "345"=>59,
"360"=>59, "375"=>61, "390"=>61,, … ]}
It does not look pretty good to be understood for the
ordinary user. And furthermore, all this data has no need to
be stored on the web-server. That is why the data should be
processed to a better presentable form to store and then
retrieve all these time series.
IV. DATA PROCESSING AND FORECASTING USING
MACHINE LEARNING IN CYBER-PHYSICAL
SYSTEM FOR REMOTE MONITORING OF THE
HUMAN FUNCTIONAL STATE
D. DATA PROCESSING
During the COVID-19 pandemic, due to the large
number of patients in hospitals, doctors do not have enough
time to be distracted to self-execute the analysis of
indicators of various medical measuring devices. It is very
important that the information is presented in a processed
form. In this case, from the point of view of clarity, a Fig. 2. Presentation of a patient data in the mobile
graphical representation of information is the best for application.
perception. All the collected data is a time series. A time series is a
sequence S of historical measurements yt of an observable4 Petro Hupalo, Anatoliy Melnyk
variable y at equal time intervals. That means that one Traditionally, time series prediction is dominated by
measurement corresponding to concrete time cannot be linear algorithms such as ARIMA, as they are well
repeated. As it was described earlier, wearable devices are understood and effective to solve many problems. But these
measuring simultaneously 3 main parameters: Oxygen classic methods also have a number of limitations, such as:
Saturation, Pulse and Respiration Rate. With the collected Completeness of data: missing data or damaged
data and a goal to predict lungs state for some period in the data will usually make the forecast unreliable
future there is a need of implementation machine learning One-dimensional data: Many real-world problems
algorithms. have several input variables.
One-Step Forecasts: Many real-world problems
E. MACHINE LEARNING STRATEGIES FOR require long-term forecasts.
TIME SERIES FORECASTING
Machine learning techniques can be effective for more
Time series are studied for several purposes such as the complex time series prediction problems with multiple input
forecasting of the future based on knowledge of the past, the variables, complex nonlinear relationships, and missing
understanding of the phenomenon underlying the measures, data. For efficient operation, these methods often require
or simply a succinct description of the salient features of the manually developed functions [8].
series. Forecasting future values of observed time series
plays an important role in nearly all fields of science and F. DATASET
engineering, such as economics, finance, business
An unstructured data is the information that does not
intelligence, meteorology and telecommunication. An
adhere to a pre-defined model or organizational framework.
important aspect of the forecasting task is represented by the
In the healthcare sector, it could be materialized in terms of
size of the horizon. If one-step forecasting of a time series is
better management, care and low-cost treatments. We are
already a challenging task, performing multi-step
miles away from realizing the benefits of big data in a
forecasting is more difficult because of additional
meaningful way and harnessing the insights that come from
complications, like accumulation of errors, reduced
it. In order to achieve these goals, we need to manage and
accuracy, and increased uncertainty [7].
analyze the big data in a systematic manner [9][9].
There are many things to keep in mind when a new
It was described above that the collected data are
time series prediction problem arises. The choice made at
dynamic multidimensional time series with n-steps forward
the beginning directly affects each step of the project. You
prediction, which means that the algorithmic model will be
can very quickly narrow down the options by doing a
based on new data before each prediction and has several
number of basic questions about a specific problem of time
input variables measured over time.
series forecasting. By considering and answering questions
Fig.3 shows the collected data of one person during the
independently within each topic, the type of problem is
period of 2 months. Mainly, indicator values were measured
narrowed and the choice of algorithms for the project is
for every minute, except periods of activity or when device
simplified.
was unused. That is a typical example of one-dimensional
Based on data from different types of pulse oximeters,
time series.
the aim was to analyze how to create a multi-stage
forecasting system that can predict some important
indicators of human health for different periods of time
ahead.
After a brief study and analysis of a series of available
data, it was concluded that the studied data type, namely
unstructured time series with more than one parameter,
measured simultaneously in time. Working with this data
involves forecasting n-steps forward and the forecasting
model must learn from the new data before each prediction.
Target users are people who have or have had COVID-
19 or have symptoms of other respiratory illnesses.
To implement the ideas described above, the overall
structure of the system will have the following steps:
Data collection
Preparation and pre-processing of data
Choice of algorithms and testing
Comparison of algorithm results and selection of Fig.3. Example of collected SpO2 time series data for one
optimal ones person
Data visualization The number of observations recorded over time in the
First of all, the main issue after data acquisition is to time series data set matters. Traditionally, different names
prepare them properly so that they match the algorithm. are used:
There is one type of data preparation for controlled machine One-dimensional time series: these are data sets
learning models, and quite another to prepare data for neural where only one variable is observed at a time, such
network connections - CNN or LSTM. as temperature per hour.Acquisition and Processing of Data in CPS for Remote Monitoring of the Human functional State 5
Multidimensional time series: these are data sets fraud, change detection in disease patterns, high-quality
where two or more variables are observed healthcare, and better efficiency of medical resource
simultaneously. allocation [11]. One or more models that would be most
Most methods of time series analysis, as well as books accurate in the test data set would be included in the
on the subject, focus on one-dimensional data. This is prediction system.
because they are the easiest to understand and work with.
Multidimensional data is often more difficult to process. G. EVALUATION METRICS
They are more difficult to model and often many classical Before forecasting, it should be clear how to measure
methods do not show sufficient results. the quality of the predictions. There are many metrics that
In Fig.4 there is an example of collected data from can be used for this.
wearable devices with selected features based on the task of Time series prediction performance measures provide
the oxygen saturation forecasting. Anthropometric data a summary of the skill and capability of the forecast model
helps to distinguish time series of different groups of people. that made the predictions. There are many different
performance measures to choose from. It can be confusing
to know which measure to use and how to interpret the
results. Here are the most common Forecasting Performance
Measures [13]:
Forecast Error (or Residual Forecast Error)
The forecast error is calculated as the expected value
minus the predicted value. This is called the residual error of
the prediction.
forecast error = expected value − predicted value
Mean Forecast Error (or Forecast Bias)
Mean forecast error is calculated as the average of the
forecast error values.
mean forecast error = mean (forecast error)
Mean Absolute Error
The mean absolute error, or MAE, is calculated as the
average of the forecast error values, where all of the forecast
Fig.4. An example of a multidimensional time series for values are forced to be positive. Forcing values to be
multi-step sequential prediction. positive is called making them absolute.
mean absolute error = mean (abs (forecast error))
For these purposes, it is necessary to determine the Mean Squared Error
algorithms that best suit them. To choose the most accurate Mean forecast error is calculated as the average of the
model, one needs to conduct several experiments with the forecast error values.
following algorithms: mean squared error = mean (forecast error2)
Autoregression. Root Mean Squared Error
Linear and nonlinear machine learning. The mean squared error described above is in the
Ensemble machine learning. squared units of the predictions. It can be transformed back
Deep learning. into the original units of the predictions by taking the square
DL approaches differ from shallow ML algorithms in root of the mean squared error score.
terms of scalability, i.e., depth (number of hidden layers)
and width (number of cells or units or neurons in each
layer). DL (or deep ML) is a scalable ML approach capable H. MULTI-STEP FORECASTING STRATEGIES
of scaling to the data size in terms of high number of data
There can be considered three main strategies to show
samples or data dimensionality. DL is applied to artificial
how learning techniques can be used to tackle the multi-step
neural networks (ANN or NN) and that is why it is also
forecasting problem. Namely, there are the following
known as deep neural networks (DNN).
strategies: recursive, direct and multiple output.
Deep Learning is loosely inspired by the visual cortex.
A multi-step time series forecasting task consists of
It is mimicking our brain in terms of learning and
predicting the next H values [yN+1,...,yN+H] of a historical
recognizing the spatial and temporal patterns (or
time series [y1,...,yN] composed of N observations, where H
spatiotemporal) in the data. DNN are basically deep
> 1 denotes the forecasting horizon [12].
hierarchical layers of perceptrons, as artificial neurons, for
The Recursive strategy trains first one-step model f:
representation and regression learning [10][11].
Deep learning in healthcare provides doctors with the
analysis of any disease accurately and helps them treat them yt+1=f(yt,...,yt−n+1)+wt+1, with t∈ {n,...,N−1} and then uses it
better, thus resulting in better medical decisions. Deep
learning technologies can be applied to hospital
management information systems to achieve: lower cost, recursively for returning a multi-step prediction. A well-
fewer hospital stays, and its length, control of insurance known drawback of the recursive method is its sensitivity to6 Petro Hupalo, Anatoliy Melnyk
the estimation error, since estimated values, instead of actual Deep Learning models have a unique processing which
ones, are more and more used when we get further in the allows them to be more efficient than other traditional
future. models. Models like LSTM and CNN are efficient for time
The Direct strategy learns independently H models fh: series multivariate forecasting. Deep Learning models yield
a high accuracy at forecasting future values. Although this is
the case, even deep learning models must be used at
yt+h=fh(yt,...,yt−n+1)+wt+h, with t∈{n,...,N−H}and h∈{1,...,H} discretion for highly dynamic datasets. Deep Learning
models work as an effective modelling technique for time
series forecasting.
and returns a multi-step forecast by concatenating the H
predictions. V. CONCLUSIONS
A detailed review and comparison of strategies for
Nowadays, various biomedical and healthcare tools
multi-step time series forecasting based on the local learning
such as genomics, mobile biometric sensors, and
algorithm is presented in [8].
smartphone apps generate a big amount of data. Therefore,
it is mandatory to know about and assess that can be
I. MODELS TRAINING AND EXPERIMENTAL
achieved using this data. For example, the analysis of such
RESULTS
data can provide further insights in terms of medical and
The process of choosing a model can usually be other types of improvements in healthcare. It can be a
divided into the following stages [13]: preventive method of curing many illnesses.
1) The division of the data set into training and test Described steps and methods of data acquisition and
sets. processing can be applied to build more sophisticated
2) Algorithm modelling. Setting the basic hyper systems for forecasting and other machine learning
parameters of the model. problems and evaluation of the created models.
Predicting the future is one of the most relevant and
3) Prediction on the test set directly or using forward
challenging tasks in applied sciences. Building effective
testing. predictors form historical data demands computational and
4) Calculation of a metric that compares forecasts statistical methods for inferring dependencies between past
with expected values. Based on the evaluation of the metric, and short-term future values of observed values as well as
one can compare the models and accordingly select those appropriate strategies to deal with longer horizons.
whose accuracy satisfies the conditions of the problem. Cyber-physical system with forecasting opportunity
5) Automation of work. Development of a framework can be used in both clinical practice and epidemiological
studies, can help monitor disease progression and in many
for automation of one or more parts of the process.
cases prevent the growth of negative outcomes.
6) According to this type of problem, the following
References
algorithms were identified: convolutional neural network [1] Machine Learning in Wearable Biomedical Systems, August
(CNN), and long short-term memory networks (LSTM). The 2020, url: https://www.intechopen.com/books/sports-science-
detailed explanation of the decision of the algorithms can be and-human-health-different-approaches/machine-learning-in-
wearable-biomedical-systems
found there [13].
[2] Anatoliy Melnyk, Yurii Morozov, Bohdan Havano, Petro
Based on the set task and collected data were defined Hupalo. HealthSupervisor: Mobile Application for Round-
to use a LSTM model for the experimental prediction of the the-Clock Remote Monitoring of the Human Functional State
user oxygen saturation data. In Fig.5 the result of the (keynote). Proceedings of the 2nd International Workshop on
forecasting is shown. Intelligent Information Technologies & Systems of
Information Security with CEUR-WS. Khmelnytskyi, Vol-
2853, Ukraine, March 24–26, 2021, pp. 24-37. - http://ceur-
ws.org/Vol-2853/
[3] Sang M. Lee, DonHee Lee, Healthcare wearable devices: an
analysis of key factors for continuous use intention, October
2020, url: https://link.springer.com/article/10.1007/s11628-
020-00428-3
[4] Aras R. Dargazany, Paolo Stegagno, and Kunal Mankodiya,
WearableDL: Wearable Internet-of-Things and Deep
Learning for Big Data Analytics - Concept, Literature, and
Future, Mobile Information Systems, November 2018
[5] Using Fitness Trackers and Smartwatches to Measure
Physical Activity in Research: Analysis of Consumer Wrist-
Fig. 5. Graph with forecasted Oxygen Saturation by LSTM Worn Wearables, Journal of Medical Internet Research,
model with MAE and RMSE values March 2018, url:
https://www.ncbi.nlm.nih.gov/pmc/articles/PMC5887043/
Measured errors show to us that we have little
[6] Anatoliy Melnyk, Yuriy Morozov, Bohdan Havanio, Petro
difference in the forecasted and real values. They would be Hupalo. Investigation of Wireless Pulse Oximeters for
improved by further optimizations of the model and Smartphone-based Remote Monitoring of Lung Health.
expanding of the dataset. Advances in Cyber-Physical Systems. 2020; Volume 5,Acquisition and Processing of Data in CPS for Remote Monitoring of the Human functional State 7
Number 2: pp. 70 – 76.
https://doi.org/10.23939/acps2020.02.070
[7] Ben Taieb, S., Bontempi, G., Atiya, A., Sorjamaa, A.: A
review and comparison ofstrategies for multi-step ahead time
series forecasting based on the NN5 forecastingcompetition.
ArXiv e-prints, August 2011
[8] Jason Brownlee. Introducing to time series forecasting with
Python, 2017
[9] Dash, S., Shakyawar, S.K., Sharma, M. et al. Big data in
healthcare: management, analysis and future prospects. J Big
Data 6, 54 (2019). https://doi.org/10.1186/s40537-019-0217-
0.
[10] M Supriya, AJ Deepa, Machine learning approach on
healthcare big data: a review, Big Data and Information
Analytics, 2020, Volume 5, Issue 1: 58-75. October 2020
[11] Aras R. Dargazany, Paolo Stegagno, and Kunal Mankodiya,
WearableDL: Wearable Internet-of-Things and Deep
Learning for Big Data Analytics - Concept, Literature, and
Future, Mobile Information Systems, November 2018
[12] Gianluca Bontempi, Souhaib Ben Taieb, Yann-Aël Le
Borgne, Machine Learning Strategies for Time Series
Forecasting. Lecture Notes in Business Information
Processing, January 2013, pp.138, url:
https://www.researchgate.net/publication/236941795_Machi
ne_Learning_Strategies_for_Time_Series_Forecasting
[13] Jason Brownlee, Deep Learning for time series forecasting,
August 2018
Anatoliy O. Melnyk has been a Head
of the Department of Computer
Engineering at Lviv Polytechnic National
University since 1994 and a Head of the
Department of Artificial Intelligence of
John Paul II Catholic University of Lublin
since 2018. He graduated from Lviv
Polytechnic Institute with Engineer Degree
in Computer Engineering in 1978. In 1985
he obtained his PhD degree in Computer
Systems from Moscow Power Engineering Institute. In 1992, he
received his DSc degree from the Institute of Modeling Problems
in Power Engineering of the National Academy of Science of
Ukraine. He was recognized for his outstanding contributions to
high-performance computer systems design as a Fellow Scientific
Researcher in 1988. He became a Professor of Computer
Engineering in 1996. From 1982 to 1994 he was a Head of the
Department of Signal Processing Systems at Lviv Radio
Engineering Research Institute. From 1994 to 2008 he was a
Scientific Director of the Institute of Measurement and Computer
Technique at Lviv Polytechnic National University. From 1999 to
2009 he was a Dean of the Department of Computer and
Information Technologies at the Institute of Business and
Perspective Technologies. Since 2000 he has served as President
and CEO of Intron ltd. He was also a professor at Kielce
University of Technology, Rzeszow
University of Information Technology and
Management, a visiting professor at University
of Bielsko-Biala.
Petro Hupalo is a fourth-year student in
computer engineering at Lviv Polytechnic
National University. He was involved in some
technological startups. His interests are related
to the development of software solutions,
machine learning and data analyticsYou can also read