Insurance Retreat sea level rise - Sea level rise and the withdrawal of residential insurance in Aotearoa New Zealand - Deep South Challenge
←
→
Page content transcription
If your browser does not render page correctly, please read the page content below
Insurance Retreat: Report for the Deep South National Science Challenge, December 2020

 Insurance
 Retreat
 sea level rise
Sea level rise and the
 Sea levelof rise
withdrawal residential
insurance in Aotearoa New
Zealand

December 2020

Climate Sigma
for the Deep South National Science Challenge

 i
Insurance Retreat: Report for the Deep South National Science Challenge, December 2020

Acknowledgements
This project was funded by the New Zealand Ministry of Business, Innovation and Employment (MBIE) through the Deep
South National Science Challenge.

The authors would like to express our appreciation to those who assisted with data support and access, especially Ryan
Paulik from NIWA. The lead author would also like to give thanks to all those who worked so tirelessly to bring this report
to completion, especially Ceridwyn Roberts and Nienke Kloppenburg.

Authors

Belinda Storey, Climate Sigma; Sally Owen, Te Herenga Waka-Victoria University of Wellington; Ilan Noy, Te Herenga
Waka-Victoria University of Wellington; and Christian Zammit, NIWA.

Photography Attributions

Page 1: Paul Brislen cc by 2.0
Page 19: Joy Stamp
Page 24: Gabe Raggio
All other photography sourced via Unsplash

Suggested citation:

Storey, B., Owen, S., Noy, I. & Zammit, C. (2020). Insurance Retreat: Sea level rise and the withdrawal of residential
insurance in Aotearoa New Zealand. Report for the Deep South National Science Challenge, December 2020.

This document may be quoted provided that the source is acknowledged.

This report and other publications for the Deep South National Science Challenge are available at:
https://www.deepsouthchallenge.co.nz/

 ii
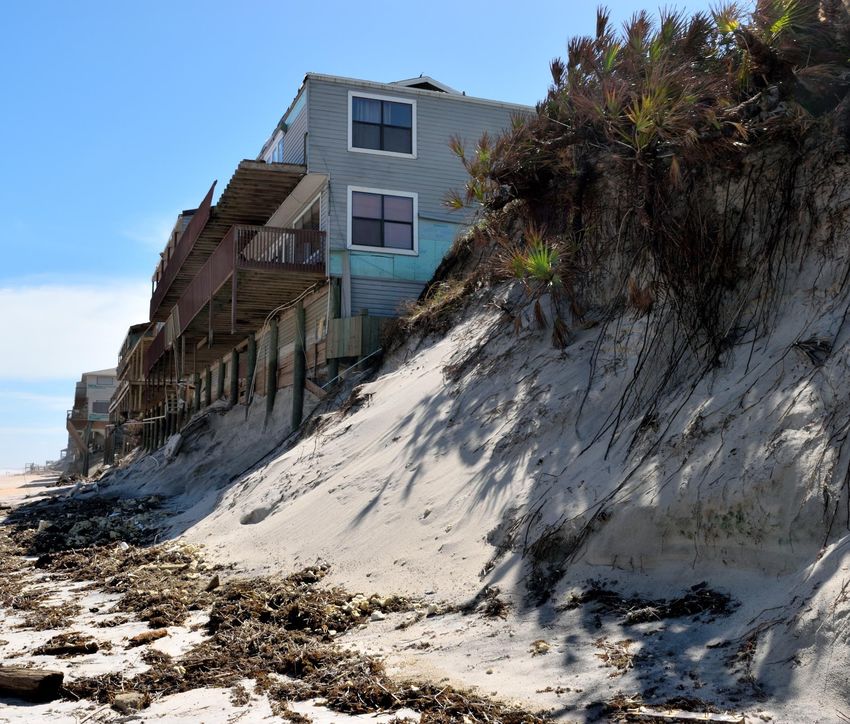
Insurance Retreat: Report for the Deep South National Science Challenge, December 2020

Executive Summary
The homes of Aotearoa New Zealand hug the coast of our long thin islands tightly and this affects the pace of insurance
retreat here. Climate change poses an increasing risk for these homes with current estimates projecting the sea level to rise
by at least 10cm by 2040. Even a modest amount of sea level rise will raise the likelihood of a storm surge overtopping
previous high-water marks and so flooding events that used to be rare are becoming more common. This will eventually lead
to insurance retreat in certain areas.

This report analyses on the change in frequency of coastal flood events over the next few decades. It explores how quickly
sea level rise induced insurance retreat will affect coastal areas in Auckland, Wellington, Christchurch and Dunedin. Also, it
estimates how expected sea level rise translates into higher insurance premiums. We analyse whether a 0.2% AEP (1 in
500 year) event in the Bay of Plenty is likely to trigger reinsurance contracts.

The analysis in this report is conservative. We expect the true number of homes facing coastal insurance retreat to be
higher, and the number on our inland floodplains to be far higher. Our results should be taken as a lower bound. This report
summarises and accompanies two academic papers.

The analysis shows that homes in Wellington and Christchurch which currently have a 1% probability of coastal inundation
are expected to face a partial insurance retreat from 2030, with homes in similarly exposed locations in Auckland and
Dunedin following only a few years later. In these four cities, full insurance retreat is likely to occur for at least 10,000
properties by 2050.

A 0.2% AEP (1 in 500 year) event making landfall in Tauranga is unlikely to be expensive enough to trigger reinsurance
contracts but highlights that Aotearoa New Zealand is still moving into and building in hazardous coastal locations. This
rapid development is increasing our exposure to escalating hazards under climate change.

A common response to increasing climate risk is to “harden the coasts” to defend property from inundation. However,
engineering solutions like sea walls, stop banks and levees only delay damage at best and might even be
counterproductive, as it encourages intensification in hazardous locations. Responses to sea level rise insurance retreat
should attempt to eliminate the underlying risk by moving homes out of harm’s way.

 3
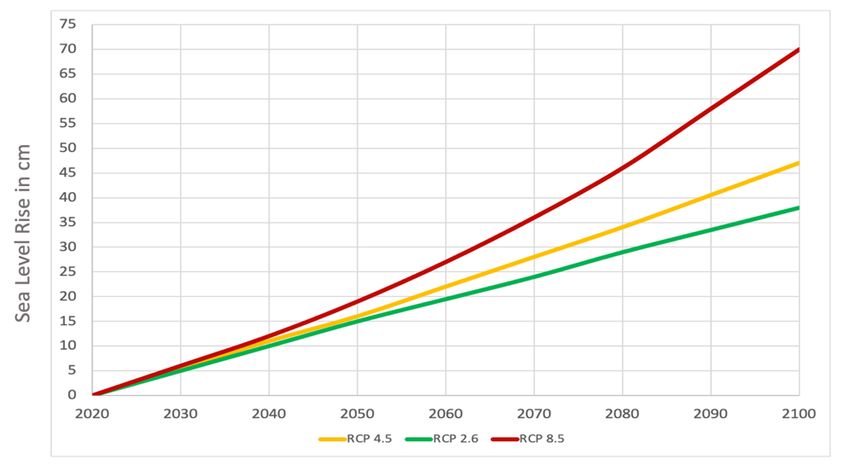
Insurance Retreat: Report for the Deep South National Science Challenge, December 2020

Introduction
Climate change is increasing risks for Aotearoa New Zealand’s homes, most noticeably in flood-prone areas and along our
coasts. Even a small amount of sea-level rise changes the probability of a coastal storm damaging property (Storey, Owen,
Noy, & Zammit, 2020a; Parliamentary Commissioner for the Environment, 2015). In areas exposed to these escalating
hazards, properties are likely to find it increasingly difficult to retain insurance (Storey et al., 2017).

This report is about sea level rise insurance retreat which takes place when sea level rise makes it too costly for insurance
companies to insure properties that are exposed to coastal disasters. Insurance retreat occurs when a private or public
insurer declines an application for insurance coverage or stops offering renewal of existing coverage, based on the
property’s exposure and vulnerability to an escalating hazard (Storey, 2017). Partial retreat refers to situations where an
insurer introduces terms that transfer a significant proportion of a property’s risk back onto the policy holder (Storey,
forthcoming). These are usually seen through monetary caps on coverage, hazard specific excesses and the exclusion of
the an entire hazard.

This project investigates coastal property that faces escalating hazards from sea level rise, through the lens of insurance
retreat. Using the elevation of coastal areas, the sea level, historic extreme sea levels, and the replacement cost of housing,
we estimate when insurance companies will pull out of insuring properties which are currently exposed to extreme weather
events, due to the increased frequency of those events from sea level rise. The intensity of storms will also increase with
climate change, but this work only focuses on the changing frequency of coastal flood events due to sea level rise.

Insurance companies generate revenue by charging premiums in exchange for insurance coverage. Insurers then reinvest
those premiums into other income-generating assets so they have a reserve of capital available to pay out to policy holders
when a major event occurs. In order to remain solvent, the premiums the insurer collects must, on average, equal more
than the total amount paid out in claims.

Coastal Hazard: Storm tides
Between now and 2040 Aotearoa New Zealand’s mean sea level will rise by at least 10cm as shown in Figure 1 (Ministry for
the Environment, 2017). Even 10 centimetres of sea level rise will increase the probability that a storm tide will overtop
previous high water marks.

 Figure 1: Aotearoa New Zealand’s expected sea level rise under different Representative Concentration Pathways (RCP)
 Authors’ own visualisation from Ministry for the Environment data (2017)

 4
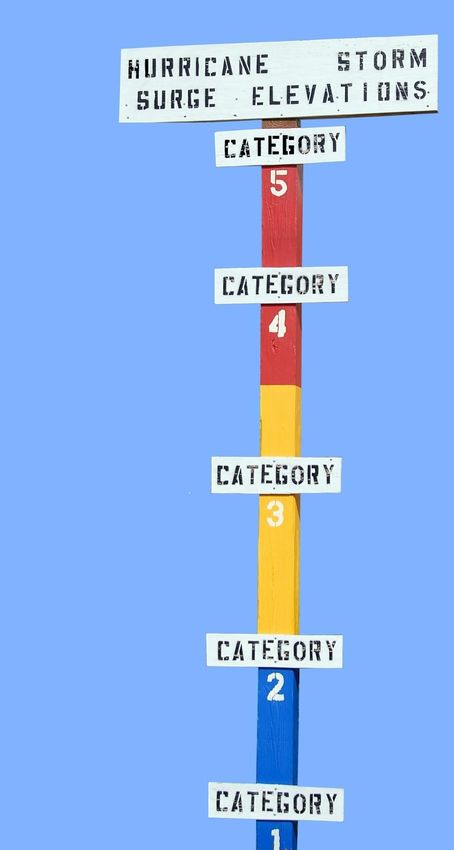
Insurance Retreat: Report for the Deep South National Science Challenge, December 2020

Tides are long-period waves that roll around the planet as the ocean is "pulled" back and forth by the gravity of the moon’s
orbit. In Aotearoa New Zealand we experience high and low tides twice a day, at different times each day. A spring tide —
popularly known as a "king tide"—refers to the 'springing forth' of the tide during new and full moon. A neap tide — seven
days after a spring tide—refers to a period of moderate tides when the sun and moon are at right angles to each other. The
difference between the height of high tide and low tide is known as tidal range. The most extreme tidal range occurs during
spring tides.

A storm surge is an abnormal rise of water over and above predicted tides generated by a storm. If an extra tropical cyclone
passes over the coast, the lower pressure in the centre of the storm causes the ocean to rise up as the storm pushes water
toward the shore. This can cause a storm surge that temporarily raises the surface of the ocean. The lower central pressure
of the storm causes the ocean to rise up, much like the way a carpet bulges underneath a vacuum cleaner moving across it.
In addition, the wind pushes the vacuum over the land creating large surges at the coastline. The rise in water level resulting
from storm surges which can lead to extreme flooding in coastal areas. The maximum surge depends on many different
factors including: storm intensity, pressure, speed, and size; as well as the angle of approach, the shape and characteristics
of coastal features, and the width and slope of the sea floor near the coast. Storm surge waves may not only batter buildings
directly along the coast but also make it possible for waves to extend inland, where extended pounding can demolish
structures not designed to withstand such forces. When a storm surge coincides with a high tide, this is known as a storm
tide.

Sites with a small tidal range, such as Napier, Tauranga and Wellington, are more sensitive to effect of sea level rise on
storm surges than those with a large tidal range, such as Auckland, New Plymouth and Nelson, because a similarly sized
storm surge is more likely to be harmlessly absorbed within a large tidal range. For example, in Auckland where the spring
tidal range is 2.88m, a storm surge of 1m is much more likely to be absorbed within the existing tidal range than a 1m storm
surge would be in Wellington with its spring tidal range of only 1.37m (LINZ, 2020). If a storm surge came in at the halfway
point between high tide and low tide in Wellington, it would inundate property, whereas if it arrived at the halfway point in
Auckland it would still be within the city’s tidal range.

The data we use in this analysis uses NIWA’s “extreme sea level one” (ESL1) flooding at present-day mean sea-level. This
is a combination of tide, storm surge, mean sea-level anomalies and wave setup (Paulik et al., 2019). An ESL1 is a map of a
coastal area that has a 1 percent probability of being inundated each year. It is similar to a map of a 1 in 100 year flood
zone.

Insurance
People use insurance as a way of transferring risk, however it does not reduce the risk itself. For most insurance
companies, the essential insurance model involves pooling risk from a large portfolio of homeowning policy holders and then
sharing that risk through international financial markets. To remain solvent, premiums must equal more than claims over
extended periods of time. Each year insurers assess their expected losses across their entire portfolio of policies. An
expected loss is an estimate of the cost of a claim multiplied by the probability of that claim occurring. If the probability of a
hazard increases or the value of the exposed asset increases, the expected loss also increases. This is why insurance
premiums change every year. Each year insurers also decide which policies to renew and under what conditions.

Insurance companies work with Annual Exceedance Probabilities (AEP) to decide what to charge for coverage and when
to stop insuring a property. A 1% AEP event occurs on average once every 100 years, a 2% AEP event occurs on average
once every 50 years and a 5% AEP event occurs approximately once every 20 years. Anecdotal evidence from the
insurance industry suggests that partial insurance retreat begins to occur when the likelihood of an event reaches the 2%
AEP threshold, and full retreat will have occurred by the time this reaches 5%. However, in the United Kingdom private flood

 5
Insurance Retreat: Report for the Deep South National Science Challenge, December 2020

insurance has become difficult to obtain for properties that have an AEP for inundation of 1.33% (Surminski, 2014)
suggesting it could also retreat earlier here.

When modellers estimate the damage a house experiences in different flood depths, they multiply the total replacement cost
of the house by a percentage which best reflects the expected damage the house will suffer with a given water height.
Insurance companies call this a damage function. If a house is 100 percent damaged, it is written off – just like a car that is
not worth replacing after an accident.

Residential Insurance Retreat findings
Data
Our Insurance Retreat empirical study relies on the following datasets:
• property data from RiskScape1,
• elevation data from the New Zealand School of Surveying (NZSoS)2,
• tide gauge, coastline and land district data from Land Information New Zealand (LINZ),
• and extreme sea level extent modelling from the National Institute of Water and Atmospheric Research (NIWA).

 Coastal houses Construction Floor type Floor height Replacement
 in ESL1 zone year 1=wood cost
 2=concrete (median)
 (n) (median) (mean) (median)

 Auckland 540 1970 1.20 63 cm $314,000

 Wellington 1,740 1955 1.17 63 cm $273,000

 Christchurch 4,850 1970 1.65 40 cm $239,000

 Dunedin 3,100 1925 1.15 63 cm $248,000

Table 1: Summary statistics of residential properties located within 1% AEP coastal inundation extents (ESL1), as modelled
 by NIWA. Note this only includes properties within 1km from the coast.

1 Described in King,et al. (2009)
2 Described in Columbus, Sirguey, & Tenzer (2011)

 6
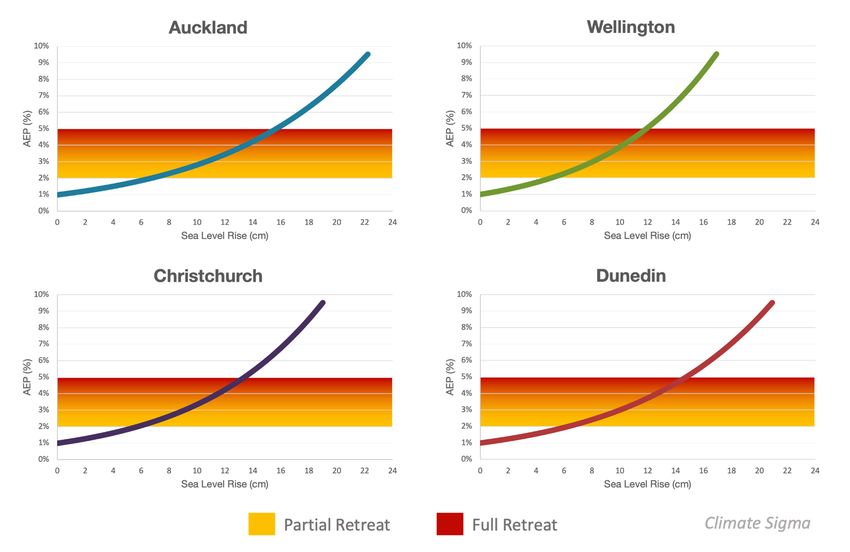
Insurance Retreat: Report for the Deep South National Science Challenge, December 2020

Process
We fit a three parameter Generalized Extreme Value (GEV) distribution to the annual maximum value sea level series from
four cities to model the relationship between each cm of sea level rise and how much more frequent a 1% AEP (1 in 100
year) event is likely to become.

For properties already within the 1% AEP (1 in 100 year) inundation zone, we estimate the water height per property to
estimate damage incurred (di ) and then calculate the hazard specific risk-adjusted premium. Our analysis assumes that a
property incurs 50 percent damage if the water reaches over 1 metre above the floorboards, 30 percent damage if the floor
is of timber construction and the flooding rises above the ground level floorboards (but less than one metre deep) and 10
percent if the floor is concrete and the flood rises up to 1 metre above the floorboards.

We model expected annual losses (E(L)i) from AEP 1% extreme sea level inundations across New Zealand properties, as
below:

 ( ) = . . .

Based on these expected annual losses, we model expected premiums for this single event to be insured, as below:

 1% = 1.3 . ( )

where we expect a 30 percent “loading” by insurers (covering administrative costs and an acceptable profit margin).

This gives us the approximate annual premium for this single coastal hazard, in other words, the likely contribution of this
coastal hazard to a home-owners premium (Storey et al. 2020a).

Findings
Figure 2 presents our key GEV results graphically. This shows how much more frequent a 1% AEP coast inundation event
becomes with given sea level rise. The key driver of the different steepness of these curves is the tidal range.

 7
Insurance Retreat: Report for the Deep South National Science Challenge, December 2020

Figure 2: The authors' estimate sea level rise to AEP curves, recreated from LINZ tidal gauge data3.

We validate our results using comparison to Hunter (2015) commissioned by the Parliamentary Commissioner for the
Environment (2015). Our process is able to replicate theirs within a small margin of error.

 Modelled national elevation of properties

 Total < 50cm 50cm - 1m 1m - 1.5m 1.5m - 2m > 2m

 All 1,466,330 10,420 9,340 10,780 9,960 1,425,830

 Coastal 451,900 10,140 8,740 8,370 7,830 416,820
 (within 1km
 of coast)
Table 2: RiskScape residential property counts by elevation band rounded to the nearest ten. Source: Storey et al. (2020a)

3 Provided by LINZ with Ports of Auckland permission in 2020

 8
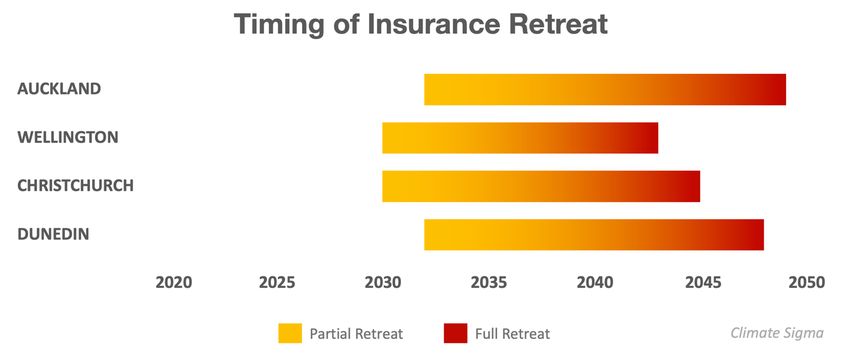
Insurance Retreat: Report for the Deep South National Science Challenge, December 2020

In Table 3 we present the results from our at-risk property insurance modelling. For each specification we present the
number of properties which are located within 1% AEP Extreme Sea Level (ESL1) surge zones and are also less than 1 km
from the coast.

 Current modelled 1% AEP Sea level rise to Expected premiums
 coastal flood premium reach 5% AEP at 5% AEP
 threshold (without retreat)

 N Median Mean Std dev. Median

 Auckland 540 $2,000 $2,600 $4,227 15 cm $10,000

 Wellington 1,740 $1,800 $1,700 $1,624 12 cm $8,700

 Christchurch 4,850 $1,600 $2,100 $2,997 13 cm $7,600

 Dunedin 3,100 $1,600 $1,800 $779 14 cm $7,900

Table 3: Single hazard modelled premiums, and how these will change with as little as 12cm of sea level rise. Dollar figures
presented rounded to the nearest hundred, and n to nearest ten.

We find that in Auckland the median 1% ESL annual risk-based premium currently should be $2,000 for properties within the
current ESL1 zone. For Wellington, the median 1% ESL annual risk-based premium currently should be $1,800, and for both
Christchurch and Dunedin we find a median of $1,600.

In order to understand the timing of retreat, we compare the differences between the water heights in a 1% AEP event
estimated by our GEV results with the water heights in 2% and 5% AEP events, and compare these to Aotearoa New
Zealand’s expected sea level rise, shown in Figure 1 (Ministry for the Environment, 2017). By comparing the difference
between these, we can estimate the timing of insurance retreat within the at-risk properties in each city. Timings are shown
for RCP 4.54 in Figure 3.

As coastal locations with a small tidal range are more at risk from storm surges than those with a large tidal range, the
coastal hazard insurance retreat thresholds caused by sea level rise are likely to occur several years earlier in Wellington
than in Auckland.

4 We also investigated RCPs 2.6 and 8.5, finding only 2 - 5 years difference (at most) for either partial or full retreat.

 9
Insurance Retreat: Report for the Deep South National Science Challenge, December 2020

Figure 3: Timing of modelled insurance retreat in major coastal cities. Authors’ own graphic.

Figure 4: Partial (2% AEP) and full (5% AEP) insurance retreat thresholds with Sea Level Rise (cm) in major coastal cities.
 Authors’ own graphic.

Figure 4 presents the curves for each city, created using GEV analysis of LINZ collated tidal levels. Red indicates a retreat
threshold of 5% AEP and yellow a partial retreat threshold for 2% AEP.

 10
Insurance Retreat: Report for the Deep South National Science Challenge, December 2020

Reinsurance findings
Extra-tropical Cyclone Giselle hit Tauranga in the Bay of Plenty on 10 April 1968. This event is known in Aotearoa New
Zealand as the Wāhine storm, due to a tragic maritime disaster.5 At Tauranga, the maximum water level recorded during the
Wāhine Storm was 2.55m above chart datum, with a 0.88m storm surge (de Lange & Gibbs, 2000). We investigate whether
a 0.2% AEP (1 in 500 year) storm making landfall in Tauranga today could trigger reinsurance contracts for Aotearoa New
Zealand.

Catastrophe reinsurance enables the Earthquake Commission (EQC) and private insurers to transfer some of the risk of
natural disasters to international financial markets, just as retail insurance allows a homeowner to transfer home and
contents risk to a local insurer. Private insurers use reinsurance to meet prudential requirements placed on them by the
Reserve Bank of New Zealand. Like home insurance, reinsurance contracts include a deductible (an “excess”). Information
on private re-insurance thresholds is not available. However, we know that EQC’s catastrophe reinsurance deductible is
$1.75 billion (Treasury, 2017, page 11).

We investigate the implications of a 0.2% AEP event hitting Tauranga City and neighbouring coastal towns in the Bay of
Plenty. Using both in-harbour modelling of flood extents and elevation/distance-to-coast approaches to identify at risk
properties, and applying a simplified insurance model, we estimate that insured residential damage to dwellings6 from a
0.2% AEP (1 in 500 year) event would likely be in the range of $100 – 600 million (Storey, Owen & Noy 2020b). Given that
EQC's reinsurance deductibles are $1.75 billion, and EQC only insures residential land against storms and floods, we
conclude that under the current rate of change in storminess and sea level rise, EQC’s reinsurance contracts are unlikely to
be triggered by a major weather event hitting the Bay of Plenty. However, our analysis highlights that rapid development is
increasing our exposure to escalating hazards under climate change.

 Table 4: Summary statistics of homes, by development period, within the 0.2% AEP zone in the Bay of Plenty

 Houses in Construction year Flooring Floor height Replacement cost
 0.2% AEP (median) (mean) (median)
 (median)
 zone (n)

 built pre 1968 260 1955 1.16 63 cm $278,000

 built after 1968 860 1985 1.35 63 cm $369,000

Table 4: Note these are RiskScape modelled houses within the NIWA 0.2%7 AEP coastal flood inundation zone at current
sea level. To avoid houses rebuilt following damage by the Wāhine storm we exclude houses reportedly built in 1968. N

5 During extra-tropical cyclone Giselle, the Wāhine ferry sunk on 10 April 1968 in Wellington harbour, leading to the loss of fifty three lives.
6 Data on land valuations were not available to this study.
7 For the Bay of Plenty (Tauranga regional area) we received ESL shapefiles for AEP 2%, 1% and 0.02% at current sea level. We used the 0.02% AEP

extent (a 1:500 year event) for our reinsurance analysis. See Reeve et al. (2019) for a detailed explanation of the inundation modelling undertaken in
Tauranga. We note that the severity of extra-tropical Cyclone Giselle was likely to be greater than a 0.2% AEP (1 in 500 year) event.

 11
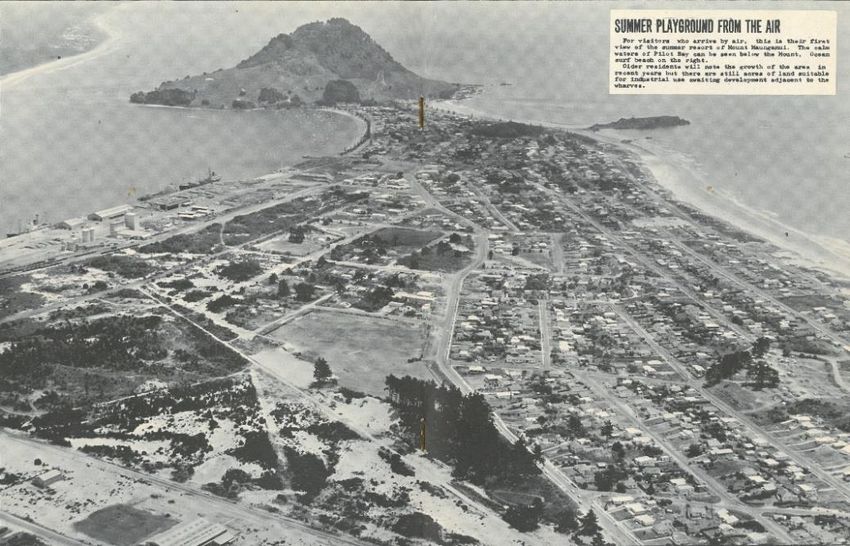
Insurance Retreat: Report for the Deep South National Science Challenge, December 2020

values rounded to nearest 10. Flooring types: 1 denotes wooden and 2 denotes concrete. Replacement costs supplied in
2018, adjusted for inflation into 2020 dollars.

In the fifty years since 1968, development in Tauranga has continued in zones affected by extra-tropical cyclone Giselle. Of
the approximate 1,100 houses within the 0.2% AEP (1 in 500 year) zone 8, more than three quarters (approximately 860)
have been built since the Wāhine storm. Of houses built since 1968, approximately 280 have been built in the 2% AEP (1 in
50 year) zone.

Image 1: Mt Maunganui suburb of Tauranga in 1964. (TPN, 1964)

Tauranga’s increased exposure will compound with changes in the probability of events to increase both the aggregated
losses of a future extreme (such as 1 in 500 year) event and the number of homes at risk of insurance retreat.

8 Since 0.2% inundation maps are only available inside the harbour, our initial numbers are by definition an underestimate.

 12
Insurance Retreat: Report for the Deep South National Science Challenge, December 2020

Discussion
Any response to insurance retreat should attempt to reduce the underlying risk instead of simply delaying the risk or shifting
responsibilities for insurance. Some of the most obvious responses may lock in maladaptive paths that increase risk in the
long term.

With sea level rise and storm surge incursion, there may be a temptation to harden our coasts to defend property from
inundation. Hardening defences might allow us to maintain insurance temporarily, but it only extends the deadline rather
than eliminates it.

Engineering responses like sea walls, stop banks and levees can create a false sense of security. People living in areas
‘protected’ by a stop bank, levee or sea wall perceive - and often are told - they are safe from future floods and storms. As a
result, there is increased economic development in these areas and property owners see little need to invest in other kinds
of defensive measures.

However, as our climate changes, engineering solutions designed for 1% AEP events with face storms of increasing severity
including, for example, events that currently have only a 0.2%AEP (i.e. events that currently occur, on average, only once
every 500 years). This will increase the likelihood that these defences will fail.

The “levee effect” refers to the paradox that constructing something to defend an at-risk low-lying area from flooding might
induce property owners to invest more in their property or build more dwellings, increasing the potential damages should the
stop bank breach. When a stop bank, sea wall or levee is overtopped or fails, the resulting losses can be catastrophic.

In addition, most engineering solutions defend the land immediately behind them, but can make flooding worse in other
areas by creating a traffic-jam or ripple effect that forces water higher elsewhere. So, paradoxically, what is seen as a
solution may increase overall flood risk.

 13
Insurance Retreat Report for Deep South National Science Challenge

Conclusion
Many coastal locations face unprecedented disasters spurred by human-made climate change. The homes of Aotearoa New
Zealand hug the coast of our long thin islands tightly and this affects the pace of insurance retreat here. Aotearoa New
Zealand has relatively small tidal ranges compared to elsewhere in the world. This means only a very modest amount of sea
level rise is sufficient to change the probability of a storm surge overtopping previous high-water marks. Further, while
climate change is changing our hazards, we are also increasing our exposure to those hazards.

Our insurance retreat paper analyses at risk residential properties, with key results focusing on those which are both within
the reach of existing 1% AEP storm surges and within 1km from the coast. It does not analyse the impact on properties
further inland. Our research shows a relatively small increase in sea level rise will likely cause at least partial insurance
retreat for the vast majority of these properties within only fifteen years.

Insurance is a requirement for residential mortgages in New Zealand and failing to maintain insurance can trigger default.
While mortgages are often granted with repayment periods of up to 30 years, insurance contracts are renewed annually. An
insurer can exit a market within 12 months, while a lender may still have decades before their loans mature. Currently,
despite rules requiring mortgagors to insure, the general absence of compliance checks means banks do not currently know
whether some properties they mortgage remain insured beyond the first year of ownership.

Once insurance is unavailable, property buyers will find it difficult to borrow money to purchase a property, and existing
owners may need to make expensive modifications to their homes to prevent flood waters reaching inside. Insurers may be
willing to continue to provide insurance to high risk areas if active differentiation between these areas and lower-risk area is
widely accepted. This differentiation could include policy exclusions or very high premium prices and excesses.

We expect particular hazards may be dropped first, for example people may still have insurance for flooding caused by
excessive rain, but not insurance for damage caused by a storm surge. In some cases it may be difficult to identify a single
cause of a flooding event – for example if rain water cannot drain because of a storm surge - which could result in litigation
between policy holders and insurers. After insurance is unbundled we expect properties to quickly lose insurance for climate
related hazards. Our prediction is that homeowners currently facing a 1% probability of coastal inundation will begin to
experience partial insurance retreat within the next fifteen years. By 2050 most homes in these locations are likely to have
experienced full insurance retreat. This affects approximately 10,230 properties in the four cities investigated in this paper.

Our reinsurance analysis indicates that a 1:500 year event making landfall in Tauranga is unlikely to trigger public
reinsurance contracts but demonstrates that people are still living in, moving into, and building on flood‐prone areas in
Aotearoa New Zealand. This demonstrates the established finding that development continues even in clearly hazardous
areas.

A common response to this increasing risk is to “harden the coasts” to defend property from inundation. However,
engineering solutions like sea walls, stop banks and levees will only delay damage at best and might even be
counterproductive, as they can encourage intensification in hazardous locations.

Responses to sea level rise insurance retreat should attempt to eliminate the underlying risk by moving homes out of harm’s
way.

 14
Insurance Retreat Report for Deep South National Science Challenge

List of Acronyms
AEP – Annual Exceedance Probability

EQC – Earthquake Commission

ESL – Extreme Sea Level

GEV – Generalised Extreme Value

RCP – Representative Concentration Pathway

References
Colombus, J., Sirguey, P., & Tenzer, R. (2011). A free, fully assessed 15-m DEM for New Zealand. Survey Quarterly.
 https://www.otago.ac.nz/surveying/research/geospatial/otago040574.html
Hunter, J. (2015) Sea-Level Extremes At Four New Zealand Tide Gauge Locations And The Impact Of Future Sea-Level
 Rise. Report for the Parliamentary Commissioner of the Environment.

King, A. B., Bell, R., Heron, D., Matcham, I., Schmidt, J., Cousins, W. J., Reese, S., Wilson, T., Johnston, D., Henderson, R.,
 Smart, G., Goff, J., Reid, S., Turner, R., Wright, K., & Smith, W. D. (2009). RiskScape Project: 2004-2008.
Land Information New Zealand (2020). Standard port tidal levels: Tidal levels table. Retrieved 1 October 2020.
 https://www.linz.govt.nz/sea/tides/tide-predictions/standard-port-tidal-levels
de Lange, W. & Gibb, J. (2000). Seasonal, interannual, and decadal variability of storm surges at Tauranga, New
 Zealand. New Zealand Journal of Marine and Freshwater Research - N Z J MAR FRESHWATER RES. 34. 419-
 434.
Ministry for the environment (2017). Coastal hazards and climate change: Guidance for local government. Retrieved Month
 1 November 2020, from https://www.mfe.govt.nz/sites/default/files/media/Climate%20Change/coastal-hazards-
 guide-final.pdf
Parliamentary Commissioner for the Environment. (2015). Preparing New Zealand for rising seas: Certainty and Uncertainty.
 https://www.pce.parliament.nz/media/1390/preparing-nz-for-rising-seas-web-small.pdf
Paulik, R., Stephens, S., Wadwha, S., Bell, R., Popovich, B., & Robinson, B. (2019). Coastal Flooding Exposure Under
 Future Sea-level Rise for New Zealand (No. 2019119WN; p. 76). Deep South National Science Challenge.
 https://www.deepsouthchallenge.co.nz/sites/default/files/2019-
 08/2019119WN_DEPSI18301_Coast_Flood_Exp_under_Fut_Sealevel_rise_FINAL%20%281%29_0.pdf
Reeve, G., Stephens, S. & Wadhwa, S. (2019) Tauranga Harbour inundation modelling - NIWA Client report. Prepared for
 Bay of Plenty Regional Council. June 2019
Storey, B. (2017). Conversion to Leasehold as Methodology to Price Sea Level Rise Risk. Thesis submitted 6 March 2017 to
 the University of Canterbury in completion of the Masters’ of Disasters. Page 55.

 15
Insurance Retreat Report for Deep South National Science Challenge

Storey, B., Noy, I., Owen, S., Townsend, W., Kerr, S., Salmon, R., Middleton, D., Filippova, O., & James, V. (2017)
 Insurance, Housing and Climate Adaptation: current knowledge and future research. Motu Working Paper Series.
 Motu Economic and Public Policy Research. Wellington, New Zealand
Storey, B. (forthcoming) Climate leases: Pricing property under climate change

Storey, B. Owen, S., Noy, I. & Zammit, C. (2020a) Residential insurance retreat due to sea level rise: modelling pricing of
 coastal inundation premiums in Aotearoa New Zealand.
Storey, B. Owen, S. & Noy, I. (2020b) Could a 1:500 year coastal storm event trigger re-insurance contracts for Aotearoa
 New Zealand?
Surminski, S. (2014) The Role of Insurance in Reducing Direct Risk - The Case of Flood Insurance. International Review of
 Environmental and Resource Economics. 7. 241-278.
Treasury (2017) Treasury Report: Final Decisions – Family Incomes Package and Budget Package. 28 April 2017.

TPN (1964) Tauranga Photo News No.20, taken Feb 8 1964. Sourced from the Tauranga City Libraries, Local History
 Collection

 16
Disclaimer
© 2020 Climate Sigma Ltd and the authors.

This report for the Deep South National Science
Challenge is research material circulated by the
authors for the purposes of information and
discussion. The academic papers attached should be
read for full documentation of methodologies and
discussion of results.

Climate Sigma
https://twitter.com/ClimateSigma
https://www.linkedin.com/company/climate-sigma
http://climatesigma.com/

 17
You can also read