Capital facilities element - INTRODUCTION - City of Issaquah
←
→
Page content transcription
If your browser does not render page correctly, please read the page content below
capital facilities element
INTRODUCTION
The Growth Management Act requires that communities plan for capital facilities to ensure there is
an adequate level of facilities and services in place to support development at time of occupancy or
use.

The overall goal is to ensure that new development does not exceed a jurisdiction’s ability to pay for
needed facilities or that new development does not decrease current service levels below locally
established minimum standards.

Pursuant to this goal, the Capital Facilities Element, together with referenced parts of the Municipal
Budget and Capital Improvement Plan, provides a six year financial plan that allows the City to
prioritize public projects and identify adequate funding sources. This Capital Facilities Element
serves as a guide to the City’s financial commitment in providing those facilities desired by the
community by monitoring planned investments relative to adopted levels of service in key areas.

The Capital Facilities Element is linked to the City’s biennial Capital Improvement Plan, which
identifies current and future capital projects including proposed locations, capacities, and public
funding sources. The current Capital Improvement Plan is adopted by reference in the Capital
Facilities Element of the Comprehensive Plan. Only a subset of the projects listed in the Capital
Facilities Element and Capital Improvement Plan receive funding and are approved in the City’s
annual budget process.

CAPITAL FACILITIES VISION
Provide high-quality public safety services and well-maintained and dependable public facilities,
excellent fire and emergency response times, professional police services, beautiful parks, clean
drinking water and effective wastewater and stormwater management because the capital facilities
needed to provide these services are planned and maintained for the long term. The cost of
providing and maintaining quality services and facilities is shared equitably, balancing the needs of
the community with those of the individual.

STATE REQUIREMENTS
growth management act requirements
As required by the Growth Management Act (RCW 36.70A.070), this element includes:

GMACF-1         An inventory of existing capital facilities owned by the City, showing the locations
                and capacities of the facilities;

GMACF-2         A forecast of the future needs for the capital facilities;

                                      (Ord 2894XXXX effective date: 12/25/2019XX/XX/2020)     page CF-1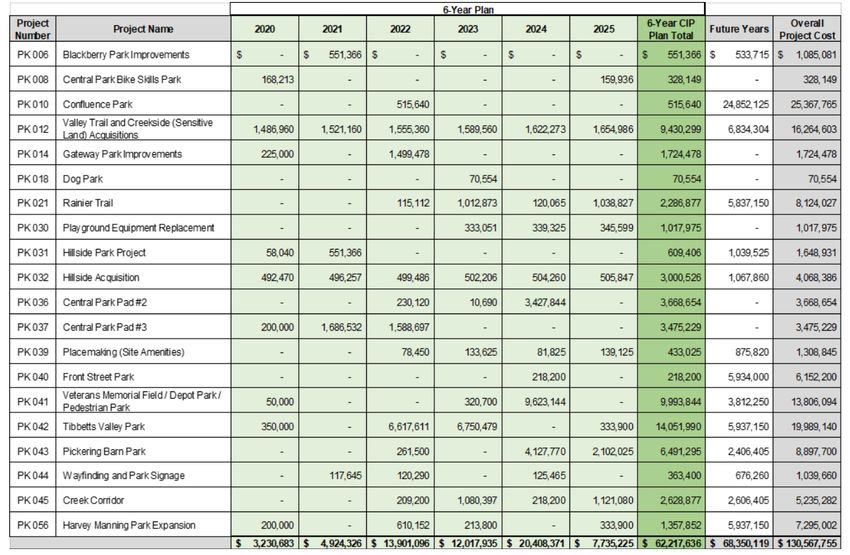
GMACF-3         The proposed location and capacities of expanded or new capital facilities;

GMACF-4         A six-year plan to finance such capital facilities within projected funding capacities
                and clearly identified sources of public money for such purposes;

GMACF-5         Policies to reassess the Land Use Element if probable funding falls short of meeting
                existing needs and to ensure that the Land Use Element, Capital Facilities Element
                and financing plan within the Capital Facilities Element are coordinated and
                consistent.

In addition, state law requires that cities which collect impact fees under Chapter 82.02 RCW
identify the following:

6   Deficiencies in public facilities serving existing development and the means by which existing
    deficiencies will be eliminated within a reasonable period of time;

7   Additional demands placed on existing public facilities by new development; and

8   Additional public facility improvements required to serve new development.

LEVEL OF SERVICE STANDARDS
Levels of service (LOS) are quantifiable measures of the amount of public facilities that are provided
to the community and typically coincide with those capital facilities associated with the collection of
impact fees. Typically, measures of levels of service are expressed as ratios of capacity to demand.

Each facility’s level of service is measured using a standard specific to that facility type to determine
the level of service needs. For example, fire “demand” is defined as the amount of time spent by
staff responding to incidents, and “availability” as all the time not spent responding to incidents. The
minimum acceptable availability percentage for the City is 90%. When availability goes below 90%,
the service provision goes below an acceptable level. Table CF-1 lists the City’s levels of service for
those capital facilities associated with the collection of impact fees.

A city uses a defined level of service standard to determine the community’s future facility needs to
plan for both the provision and funding of future capital facilities associated with the collection of
impact fees. The GMA stipulates that a community has the ability to provide needed facilities
within six fiscal years of any development.

Level of Service Goals: The LOS goals are standards which the City generally meets under existing
conditions, yet may not meet at certain times or in certain areas. These levels of service also
generally indicate needed capital facilities improvements in order to achieve the LOS goal.

                                     (Ord 2894XXXX effective date: 12/25/2019XX/XX/2020)       page CF-2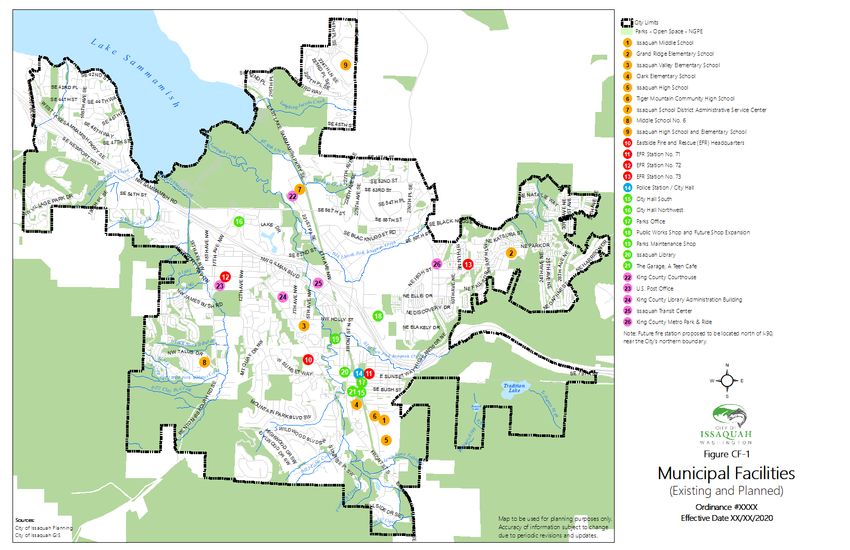
Table CF-1: City of Issaquah Level of Services Associated with Collection of Impact Fees
     Type of Capital
          Facility       Lead Agency                                  Level of Service Standards
     Fire               Eastside Fire and      1 Demand     is defined as the amount of time spent by staff
                        Rescue                 responding to incidents, and availability as all the time not spent
                                               responding to incidents. The minimum acceptable availability
                                               percentage for the City is 90%. When availability goes below 90%,
                                               the service provision goes below an acceptable level.
     Parks              City of Issaquah       2 Issaquah’s park and recreation system measures the overall parks

                        Parks                  inventory and capacity projects in the current Capital Improvement
                        Department             Program. Through this analysis, the City ensures that each resident
                                               and employee receive an equitable amount of parks and recreational
                                               facilities. The City provides this value through investment in parks
                                               and recreation facilities that are most appropriate for each site,
                                               responding to the changing needs and priorities tied to City growth
                                               and population demographic changes.
     Transportation     City of Issaquah       1 The intersection level of service (LOS) standard in Issaquah shall

                        Public Works           be LOS D, as defined by the latest edition of the Highway Capacity
                        Department             Manual. For Transportation Concurrency purposes, five (5)
                                               concurrency intersections may operate at LOS E or F at any point
                                               in time; as long as the weighted average (by traffic volume) Citywide
                                               LOS standard for all concurrency intersections is maintained at
                                               LOS D. All other concurrency intersections must operate at LOS D
                                               or better. The following five (5) intersections may operate at LOS E
                                               or F:
                                                   • NW Sammamish Road/12th Avenue NW/17th Avenue
                                                      NW/SE 56th Street
                                                   • SR 900/I-90 Eastbound Ramps 3
                                                   • Sunset Way/Front Street
                                                   • SE Issaquah Fall City Road/Issaquah Pine Lake Road
                                                      SE/Highlands Drive NE
                                                   • SE Issaquah Fall City Road/SE Black Nugget Road
     Schools            Issaquah School        Set by Issaquah School District in the District’s Capital Facilities
                        District               Plan, as annually amended
1.
       For most recent transportation and fire impact fee analysis, see Ord 2877, Impact and mitigation fees, including
       transportation and fire impact fees, and police, general government buildings, and bike/pedestrian mitigation fees
2.
       For most recent park impact fee analysis, see Ord 27732902 (effective date 3/11/20)., Traffic Impact Fees Rate
       Study and Parks, Open Space and Recreation Facilities Impact Fees Rate Study
3.
       Adoption of a different operational LOS for concurrency purposes in the Capital Facilities Element does not
       override the Washington State Department of Transportation statutory LOS noted in the Transportation Element
       of this Comprehensive Plan.

                                             (Ord 2894XXXX effective date: 12/25/2019XX/XX/2020)               page CF-3
CAPITAL FACILITY FACILITIES INVENTORY
discussion
A full inventory of all capital facilities is maintained as part of the bienniel City’s Capital
Improvement Plan (CIP), which is adopted in the Capital Facilities Element by reference.
water
The locations of the City’s water facilities are illustrated in the City’s Water System Plan Update,
which is incorporated in the Capital Facilities Element by reference.
water level of service
The existing water supply level of service standard is to provide reliable water service for
domestic use, fire flow protection and emergencies. All future development must demonstrate
that there is adequate water for the proposed land use and that fire flow requirements can be
met. Water level of service standards are defined in the City’s Water System Plan Update which
forecasts future water needs beyond the immediate 6 year Capital Facilities Element planning
period.
future water needs
The City relies on groundwater from the Lower Issaquah Creek Basin Aquifer System for much
of its water needs. The aquifer also serves several neighboring communities. The City also
obtains water from the Cascade Water Alliance, which obtains water through a wholesale
agreement with Seattle Public Utilities, for use in part of the City’s service area.
The groundwater pumping capacity is determined by groundwater rights, and the Cascade Water
Alliance agreement provides additional supply needs (see the Utilities and Public Services
Element for a complete discussion regarding water service in the City). The City’s future water
needs will be met through continued use of groundwater resources as well as new water sources
to be developed by the Cascade Water Alliance. The City will need to continue to ensure there is
an adequate supply of water for current and anticipated demand, without adversely impacting
water quality.
finance
Water capital projects for the 2020-2025 planning period, including proposed locations,
capacities, and public funding sources are identified in the adopted 2020 Issaquah Municipal
Budget and in the 2020-2025 Capital Improvement Plan and are incorporated here by reference.
sanitary sewer
discussion
The sanitary sewer system handles the sewage needs for much of the City. There are several areas of
the City not served by sewer; though the City’s goal is to provide sewer service, where feasible, to all
areas within City boundaries.
The inventory and locations of the City’s existing sewer facilities are identified in the City’s Sewer
System Plan, which is incorporated in the Capital Facilities Element by reference.
sanitary sewer level of service
(Ord 2894XXXX effective date: 12/25/2019XX/XX/2020) page CF-4The City's existing minimum LOS standard for providing sanitary sewer service is the provision
of all necessary mains and other facilities to adequately handle the demand from each service
connection.
future sanitary sewer needs
The City's future LOS goals for sewer service are as follows:
a) Use 100 percent of the Department of Ecology Criteria for Sewage System Design.
b) Provide gravity system sanitary sewer service wherever economically feasible.
c) New systems shall be designed to safely pass the wastewater flow under the future 20-year
development scenario, as determined by full site build out or by the Sewer System Plan
Update, which forecasts future sewer needs beyond the immediate 6 year CFE planning
period.
finance
Several sewer projects have been identified to correct existing deficiencies and to accommodate
population growth from 2020-2025. Sewer capital projects for the planning period, including
proposed locations, capacities, and public funding sources are identified in the adopted 2020
Issaquah Municipal Budget and in the 2020-2025 Capital Improvement Plan and are
incorporated here by reference.
stormwater
discussion
Stormwater management deals with the detention/ retention and movement of water on the surface
of the ground, typically associated with stormwater.
The control of stormwater is essential to preventing property damage due to flooding and to prevent
the degradation of water quality. To this end, the City commits substantial resources to providing
adequate stormwater management facilities. An inventory of the City’s stormwater facilities and their
locations is provided in the City’s Stormwater Management Plan, which is incorporated in the
Capital Facilities Element by reference.
stormwater level of service
The City's existing minimum LOS standard for surface water drainage management is the
requirement that all private or public on-site or off-site storage, conveyance and treatment
facilities meet stormwater development standards in the King County Surface Water Design
Manual (as amended by the City of Issaquah) that result in little or no impact to downstream
water quality and quantity.
future stormwater needs
Nonstructural storm drainage management measures, such as the implementation of the
Issaquah Basin Action Plan, will be used to help the City plan for future stormwater needs.
(Ord 2894XXXX effective date: 12/25/2019XX/XX/2020) page CF-5finance
Stormwater capital projects for the planning period, including proposed locations, capacities, and
public funding sources are identified in the adopted 2020 Issaquah Municipal Budget and in the
2020-2025 Capital Improvement Plan and are incorporated here by reference.
fire service facilities
discussion
Eastside Fire and Rescue (EF&R), which was created in 1999 by the consolidation of Issaquah Fire
Department and Fire District 10, provides fire protection services to the City. Today EF&R also
includes Fire District 38 and the Cities of North Bend and Sammamish.
EF&R as the fire department provides a complete range of services including fire protection,
emergency medical services, fire code planning, engineering and enforcement to both businesses and
residents alike. This requires EF&R as the City’s Fire Department to maintain appropriate resources
to respond to a variety of firefighting and medical aid needs. Capital facilities associated with fire
protection include facilities such as fire stations and equipment, including service/aid vehicles and
firefighting equipment.
fire level of service
The level of service (LOS) standard is based on demand versus availability. Fire “demand” is
defined as the amount of time spent by staff responding to incidents, and “availability” as all the
time not spent responding to incidents. The minimum acceptable availability percentage for the
City is 90%. When availability goes below 90%, the service provision goes below an acceptable
level. Any availability percentage below 90% would require increased apparatus acquisitions by
the City.
The City of Issaquah currently meets its fire level of service standards.
future fire needs
By analyzing Eastside Fire & Rescue’s historical data, it was determined that the City’s
availability ratio decreased by approximately 0.25% for every 1,000 person increase in
population. Using data from the City’s Comprehensive Plan, the City’s population growth was
forecast at a rate of 1.61%, as shown in Table CF-2.
(Ord 2894XXXX effective date: 12/25/2019XX/XX/2020) page CF-6Table CF-2: Population and Availability Projections
Year Population Availability
2013 32,130 91.51%
2014 32,880 91.32%
2015 33,330 91.90%
2016 34,590 91.67%
2017 36,030 91.26%
2018 37,110 90.72%
2019 37,708 90.57%
2020 38,316 90.42%
2021 38,934 90.27%
2022 39,561 90.11%
2023 40,199 89.95%
2024 40,847 89.79%
2025 41,505 89.62%
Source: Ord. 2877 Adopted Fire Impact Fees, 2019
As shown by Table CF-2, the City’s projected Level of Service falls below 90% in 2023.
Therefore, the City’s projected population in 2022 of 39,561 serves as the maximum capacity of
the City’s existing assets.
finance
Public identified funding sources for the 2020-2025 fire service capital planning period are
included in the 2020-2025 Capital Improvement Plan and the 2020 Issaquah Municipal Budget.
These documents are incorporated here by reference.
Determination of the City’s fire service needs is based on the adopted level of service standard
as illustrated in Table CF-3 below. As Table CF-3 illustrates, the City will need to address fire
service deficiencies over the next six years in order to maintain its adopted level of service
standards.
Table CF-3: Fire Service 6-Year Capital Improvement Plan
Project List 2020 2021 2022 2023 2024 2025 Total Cost
Temporary Fire Station 1 $2,657,500 $2,657,500
New Fire Station 71 1 $200,000 $8,246,966 $14,716,378 $23,163,344
Debt Payments related to $3,516,000 3
the construction of
Station 72 (Maple St)
Adopted into Capital
Improvement Plan 2
Total Annual Costs $2,857,500 $8,246,966 $14,716,378
Total 6-year Costs $29,336,844
1 Source: 2020-2025 Capital Improvement Plan
2 Source: Ord. 2877 Adopted Fire Impact Fees, 2019
(Ord 2894XXXX effective date: 12/25/2019XX/XX/2020) page CF-73 $5.86 million is the total amount of fire station debt outstanding. However, only 60% of that is allocated
to growth within the Fire Impact Fee Report study period, so the debt payment paid off by fire impact fees
is $3,516,000. The remaining $2,344,000 of debt related to the construction of Station 72 (Maple Street)
would have to be funded through a different mechanism.
police service facilities
discussion
Police protection services are provided by the City of Issaquah Police Department. In early 2000, a
new police facility was constructed across from City Hall South, which combines police, jail and
emergency operations under one roof.
The construction of a new police facility in 2000 allowed the City to meet its facility requirements
for some time afterward, however in 2019 the City began to move police staff into the second floor
office space as they had outgrown the first floor. This displaced other City staff on the second floor
to other City offices.
police level of service
The 2019 Law Enforcement Mitigation Fee Study (Ord 2877) showed the Issaquah Police
Department responded to 16,329 incidents in 2017. This information was analyzed to identify
which incidents were associated with patrol vehicles and those that were associated with criminal
investigations. This provides for separate calculation of asset cost per patrol vehicle and asset
cost per criminal investigation.
Capital facilities associated with police services include police stations, training facilities, and
police equipment. Projected capital facility requirements are based on the number of officers
needed to respond to the calls for service. As the need for additional officers increases, the need
for additional police equipment and facilities increases as well.
future police needs
With the construction of a new police facility in 2000, the City met its facility requirements. The
City also continues to acquire new police equipment that helps promote efficiency through the
use of the latest technologies. There are no police vehicles or new police building facilities in the
2020-2025 Capital Improvement Plan.
finance
Police projects for the 2020-2025 planning period are identified in the adopted 2020 Issaquah
Municipal Budget and in the 2020-2025 Capital Improvement Plan and are incorporated here by
reference, however there are no police capital projects.
parks and open space
discussion
Park and recreation facilities and open spaces are essential to a community’s mental and physical
well-being. Parks and open spaces help soften dense development, provide important ecological
functions and provide recreation opportunities for citizens and visitors.
(Ord 2894XXXX effective date: 12/25/2019XX/XX/2020) page CF-8For more detailed information, including the current inventory, regarding parks and open space, see
the Parks, Recreation, Trails and Open Space Element, the Parks Strategic Plan, and/or the 2019-
2020 park impact fee study and Ordinance 2902.
parks level of service
Calculation of parks level of service standards is based on the City’s existing inventory and
proposed project list found in the Capital Improvement Program. The 2020-2025 Capital
Improvement Program identifies $62.2 million worth of parks and recreation-related capital
investments, of which $41.7 million of outyear investments (i.e. 2022 through 2025) are currently
unfunded. The investments identified in this asset category reflect priorities identified in the
Parks Strategic Plan.
However, the provision of specific parks and recreation facilities are determined by a different
set of standards applied by the Parks Department based on the standards in the 2018 Parks
Strategic Plan.
future park needs
Capacity projects are those park projects that add new capacity to the park system, while non-
capacity projects do not add capacity to the park system. A parks impact fee will be collected from
new growth to provide for parks and facilities needed to support this additional growth. In addition,
voters approved a $10 million park bond in 2013 and a portion of that bond was used for projects
that add capacity to the City’s park system. The City’s biennial Capital Improvement Plan will
incorporate park and facility needs as needed by the community.
(Ord 2894XXXX effective date: 12/25/2019XX/XX/2020) page CF-9Table CF-4: Parks and Recreation Capital Projects in 2020-2025 Capital Improvement Plan
*Note: List includes infill and capacity projects.
finance
Public identified funding sources for the 2020-2015 parks service capital planning period are
included in the 2020-2025 Capital Improvement Plan and the 2020 Issaquah Municipal Budget.
These documents are incorporated here by reference. The 2020-2025 CIP identifies $62.2 million
worth of Parks and Recreation-related capital investments, of which $41.7 million of outyear
investments (i.e. 2022 through 2025) are currently unfunded. The investments identified in this asset
category reflect priorities identified in the Parks Strategic Plan, which Council adopted in 2018.
(Ord 2894XXXX effective date: 12/25/2019XX/XX/2020) page CF-10Table CF-5: Parks Service 20-Year Capital Improvement Plan: Infill and Capacity Projects
A. Infill 1 Projects That Include Capacity Total Cost Timing
PK 006 Blackberry Park Improvements $ 1,085,081 2021
PK 008 Central Park Bike Skills Park 328,149 2020-2025
PK 018 Dog Park 70,554 2023
PK 021 Rainier Trail 8,124,027 2022 - 2026
PK 031 Hillside Park Project 1,648,931 2020-2026
PK 036 Central Park Pad #2 3,668,654 2022-2024
PK 037 Central Park Pad #3 3,475,229 2020-2022
PK 039 Placemaking (Site Amenities) 1,308,845 2022-25
PK 041 Veterans Memorial Field / Depot Park /
Pedestrian Park 13,806,094 2020-After 2025
PK 042 Tibbetts Valley Park 19,989,140 2020-After 2025
PK 043 Pickering Barn Park 8,897,700 2020-After 2025
PK 045 Creek Corridor 5,235,282 2022-After 2025
TL 007 2nd Avenue & Rainier Trailhead 1,674,100 2024-2025
PK 048 Issaquah School District Field
Improvement Partnership 4,406,000 After 2025
PK 049 Lake Sammamish State Park Field
Improvement Partnership 4,406,000 After 2025
Total $ 78,123,786
1 Most infill projects also provide limited capacity for growth, and those that meet that criteria are
listed in this table with a total cost of $78,123,786. These projects’ eligibility for impact fee funding is
approximately 26.16%, for a total eligible cost of $21,580,787 (See 2019-2020 parks impact fee study,
Ord 2902)
B. Capacity 1 Increasing Projects Total Cost Timing
PK 012 Valley Trail and Creekside Sensitive Land $
Acquisitions 16,264,603 2020-After 2025
PK 032 Hillside Acquisition 4,068,386 2020-After 2025
PK 014 Gateway Park Improvements 1,724,478 2020-2022
TL 005 East Sunset Trailhead 3,020,900 2024-2025
TL 008 Central Park to Valley Trail 1,674,100 2024-2025
TL 009 Tibbetts Creek Trail 1,113,000 2024-2025
TL 010 Forest Rim Trailhead 1,081,300 After 2025
TL 011 Laughing Jacobs Trail 2,703,280 After 2025
TL 013 Squak Mountain to Valley/Downtown Trail 1,013,730 After 2025
TL 014 Talus to Tibbetts Valley Trail 1,622,000 After 2025
TL 012 Mall Street Trail 2,703,820 After 2025
TL 015 I-90 Crossing - Lake Tradition to Central Park 20,274,600 After 2025
TL 016 I-90 Crossing Newport to Lake Sammamish
State Park 20,274,600 After 2025
TL 017 Park Hill North Issaquah Trail 2,703,280 After 2025
TL 019 Mountains to Sound Trail 1,013,730 After 2025
TL 018 Tibbetts Valley Park to Squak Trail 2,703,280 After 2025
PK 050 Sound Transit Station Urban Plaza 4,406,000 After 2025
PK 053 East Lake Park 11,749,300 After 2025
(Ord 2894XXXX effective date: 12/25/2019XX/XX/2020) page CF-11B. Capacity 1 Increasing Projects Total Cost Timing
PK 007 Central Issaquah Urban Parks Total 27,032,800 After 2025
PK 054 West Highlands Park 2,937,300 After 2025
FC 009 Community Center Phase 2 35,500,000 After 2025
FC 017 Aquatic Center 21,000,000 After 2025
PK 010 Confluence Park 25,367,765 After 2025
PK 040 Front Street Park 6,152,200 After 2025
PK 051 Squak Valley Park North 2,937,300 After 2025
Total: $221,041,752
1 All Capacity Projects are eligible for impact fee funding
Further investment will be required in the future to accommodate population growth. Future
revenues will include park impact fees, bonds, grants, REET funds (Real Estate Excise Tax) and
other sources. Capacity projects are determined through the City’s Budget and the Capital
Improvement Plan.
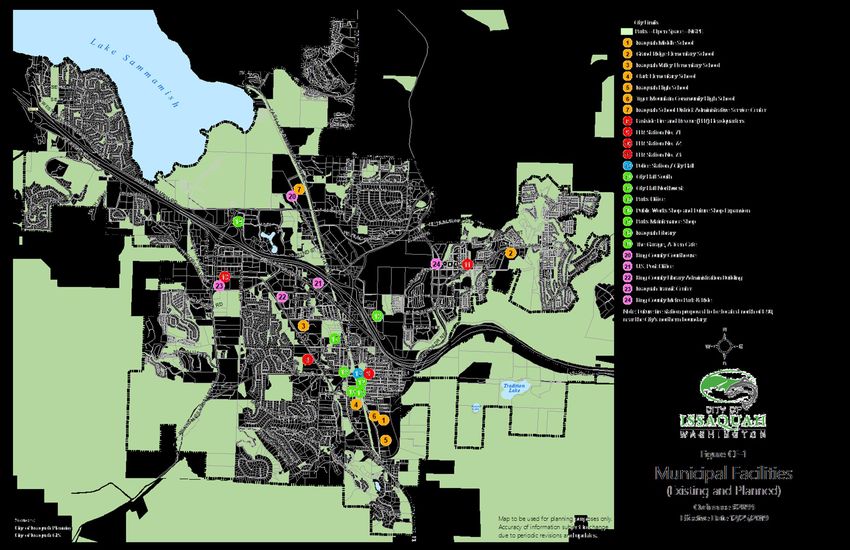
municipal facilities
discussion
City Hall administrative activities are currently accommodated in three separate buildings. City Hall
South, located along Sunset Way in Olde Town, is the City’s primary gathering place for many
public meetings and hosts the City’s Municipal Court. The second facility, City Hall Northwest, is
located near Lake Sammamish State Park and includes the Development Services, Public Works
Engineering, Economic Development, and Human Resources Departments. The newest facility is
the Police/Jail building that also includes City administrative offices. The City’s long term goal is to
locate most of the City government offices in the downtown area.
The City’s Parks Maintenance shops are located on a 2.3 acre site in a residential neighborhood near
Issaquah Creek south of Confluence Park. This parks maintenance shop is a semi-industrial,
operational facility necessary to accommodate vehicle and equipment maintenance, materials
storage, and workshops. This facility is eventually planned to be incorporated into Confluence Park
and the maintenance functions shifted elsewhere.
In 1993, the City purchased 9.1 acres of land north of I-90 as a future maintenance site. This facility
became operational in 2003 and hosts the City’s Public Works Operations Department, which
maintains the city’s infrastructure including roadways and water and sewer systems.
municipal facilities level of service
Currently, general government functions are performed in multiple buildings throughout the City.
These “city hall” functions have been in multiple temporary locations for decades. These facilities
have aged and are nearing the point of significant capital reinvestment. In addition, the current
facilities were not designed to perform as City’s primary location for customer service or service
delivery.
future municipal facilities needs
Space needs for City Hall and City Shops will be affected by several variables, including the housing
and job growth within the existing city limits resulting in the need for additional City staff. City
(Ord 2894XXXX effective date: 12/25/2019XX/XX/2020) page CF-12services are not located with efficiency, adjacencies, public access or security in mind. Over the past
decades, space allocation and community needs have also changed; the current configurations have
been unable to meet those needs effectively. Future ability to meet organizational growth,
concurrent with population increases, is also uncertain.
finance
Municipal Facilities capital projects for the 2020-2025 planning period are identified in the adopted
2020 Issaquah Municipal Budget and in the 2020-2025 Capital Improvement Plan and are
incorporated here by reference.
Table CF-6: Municipal Facilities Capital Projects in 2020-2025 Capital Improvement Plan
Project List 2020 2021 2022 2023 2024 2025 Future Years
Consolidated City $4,398,900 $39,702,500
Offices
Total Annual Costs $4,398,900 $39,702,500
Total Costs $44,101,400
Including Future
Years
Source: 2020-2025 Capital Improvement Plan
schools
discussion
Proposed improvements and capital expenditures are determined by the Issaquah School District
No. 411, which has prepared a separate Capital Facilities Plan. School facilities locations are
illustrated in the Issaquah School District’s Capital Facilities Plan District Site Location Map.
schools level of service
The City neither sets nor controls the level of service standards for area schools. The City of
Issaquah is wholly within the boundaries of the Issaquah School District. The Issaquah School
District is charged with ensuring there is adequate facility space and equipment to accommodate
existing and projected student populations. The City coordinates land use planning with the
school district to ensure there is adequate capacity in place or planned. The level of service is
described in the “Issaquah School District No. 411, Capital Facilities Plan” (as annually amended
by the School District).
future needs
Future needs are discussed in the “Issaquah School District No. 411, Capital Facilities Plan” (as
annually amended by the School District).
(Ord 2894XXXX effective date: 12/25/2019XX/XX/2020) page CF-13transportation
discussion
The description of the existing transportation system, deficiencies and future needs are identified in
the Transportation Element of this Comprehensive Plan.
level of service
Based on the 2017 Concurrency Model Update, the City’s Transportation Level of Service for
intersections has improved since the previous update to only 5 intersections operating at LOS E or
F (See Table CF-1: Level of Service Associated with Collection of Impact Fees).
future needs
Table CF-7: Existing Transportation Facilities with Available Capacity
Existing Assets with Available Capacity Traffic Impact Fee
Recently completed projects:
• East Lake Sammamish Road $7,800,000
Widening
• SE 62nd Street $42,000,000
Total Project Costs $49,800,000
Less grant funding ($21,500,000)
Less outstanding debt 0
Net City Cost $28,300,000
Available capacity 95%
Eligible cost $26,885,000
Source: Ord 2877 Traffic Impact Fee and Bicycle/Pedestrian Mitigation
Fee Update (2019)
(Ord 2894XXXX effective date: 12/25/2019XX/XX/2020) page CF-14Table CF-8: Transportation and Bicycle and Pedestrian Capital Projects in 2020-2025 Capital Improvement Plan
Bicycle and
Pedestrian
Total Future Potential City- Eligibility Traffic Impact Mitigation Fee
Transportation Projects Category Project Cost Funded Cost Basis Percentage Fee Cost Basis Cost Basis
Included in potential impact fee cost basis
TR 004 12th Ave/SR900/17th Ave Street $ 6,089,567 $ 4,589,567 100.00% $ 4,589,567 $ -
TR 033 SE Black Nugget Rd - Retaining Wall Repair Street 2,585,200 2,585,200 0.00% - -
TR 016 NW Gilman Blvd Improvements Street 386,400 386,400 35.25% 136,223 -
TR 022 NW Newport Way - SR-900 to SE 54th St Street 49,400,000 46,400,000 35.25% 17,415,686 -
TR 023 Newport Way - Maple to Sunset Street 39,400,000 34,000,000 35.25% 13,890,243 -
TR 011 Complete Streets Program Street 3,437,500 3,437,500 0.00% - -
TR 014 Front St & I-90 Interchange Reconfiguration Street 52,054,000 2,554,000 35.25% 2,554,000 -
TR 030 Overlay Program Street 11,860,000 11,860,000 0.00% - -
TR 038 Three Trails Crossing Improvements Ped/Bike 2,794,811 2,794,811 35.25% - 985,295
TR 040 E Sunset Way Ped/Bike 11,781,731 11,781,731 0.00% - -
TR 008 221st Pl SE from SE 62nd St to SE 56th St Street 7,518,688 7,518,688 0.00% - -
TR 001 2nd Ave SE Street 876,915 175,375 0.00% - -
TR 041 Front St Streetscape Street 6,295,750 6,295,750 0.00% - -
TR 013 Front & Gilman Intersection Ped/Bike 3,652,299 3,652,299 35.25% - 1,287,597
TR 003 11th/12th Ave NW I-90 Crossing Street 84,318,750 48,872,012 100.00% 48,872,012 -
TR 043 Tibbetts Valley Park Frontage Ped/Bike 786,975 314,790 35.25% - 277,444
TR 035 SR 900 - NW Sammamish Rd Widening Street 65,059,583 55,059,583 100.00% 55,059,583 -
TR 036 SR 900/I-90 Eastbound Ramps Street 1,205,805 1,205,805 35.25% 425,100 -
TR 017 Issaquah - Pine Lake Rd Street 12,798,864 5,119,546 35.25% 4,512,166 -
TR 025 NW Juniper St Ped/Bike 2,405,819 2,405,819 35.25% - 848,158
TR 027 NW Sammamish Rd Non-Motorized Crossing Ped/Bike 11,296,320 11,296,320 100.00% - 11,296,320
TR 032 SE 51st St Street 1,440,901 1,440,901 35.25% 507,981 -
TR 021 NE Dogwood St Road Widening Street 1,771,222 1,771,222 0.00% - -
TR 029 Olde Town Parking Structure Street 10,155,750 10,155,750 0.00% - -
TR 037 SR 900 Widening Street 8,021,311 8,021,311 35.25% 2,827,867 -
TR 019 Maple St/Commons Improvements Street 5,390,000 5,390,000 35.25% 1,900,213 -
TR 018 ITS Camera System Upgrade Street 176,062 176,062 0.00% - -
TR 024 NW Holly St Ped/Bike 8,281,294 8,281,294 35.25% - 2,919,523
TR 026 NW Mall St Ped/Bike 5,730,677 5,730,677 100.00% - 5,730,677
(Ord 2894XXXX effective date: 12/25/2019XX/XX/2020) page CF-15Bicycle and
Pedestrian
Total Future Potential City- Eligibility Traffic Impact Mitigation Fee
Transportation Projects Category Project Cost Funded Cost Basis Percentage Fee Cost Basis Cost Basis
TR 026 NW Mall St Street 11,461,354 11,461,354 100.00% 11,461,354 -
TR 034 SE Black Nugget Rd Widening Street 1,344,892 1,344,892 35.25% 474,134 -
TR 028 NW Sammamish Rd Street 11,242,500 11,242,500 35.25% 3,963,479 -
TR 012 Front & Sunset Intersection Street 1,021,720 1,021,720 35.25% 360,202 -
TR 002 10th Ave NW Non-Motorized Crossing I-90 Ped/Bike 7,152,012 7,152,012 100.00% - 7,152,012
TR 010 Central Park Ln Traffic Signal Street 1,405,313 1,405,313 35.25% 495,435 -
TR 031 Providence Point Intersection Street 6,934,943 6,934,943 0.00% - -
TR 015 Front St & NW Dogwood St Street 2,810,000 2,810,000 35.25% 990,649 -
TR 005 13th Ave NW Improvements Street 4,609,425 4,609,425 100.00% 4,609,425 -
TR 006 15th Ave NW Improvements Street 5,171,550 5,171,550 100.00% 5,171,550 -
Total $ 470,125,903 $ 356,426,122 $ 180,216,869 $ 30,497,024
Source: Ord 2877 Traffic Impact Fee and Bicycle/Pedestrian Mitigation Fee Update (2019)
(Ord 2894XXXX effective date: 12/25/2019XX/XX/2020) page CF-16finance
The 2020-2025 Capital Improvement Program identifies $69.4 million worth of transportation-
related capital needs, of which $400 thousand of outyear investments (i.e. 2022 through 2025) are
currently unfunded. Because of the large amount of transportation-related capital needs and the
limitations on revenues to support such investments, the 2020-2025 CIP recommends leveraging
enhanced transportation-related revenue options available to the City through the Transportation
Benefit District (TBD).
FUNDING OF CAPITAL FACILITIES
discussion
The Capital Improvement Plan is up-dated biennially and identifies all the future capital projects the
City plans to undertake given adequate revenues. The City prioritizes the projects in the CIP for the
next six years based on need and projected finances available. The approved CIP is adopted by
reference in the Capital Facilities Element of the Comprehensive Plan.
The CIP is linked to the City’s annual budget through the Capital Facilities Element in that the
adopted budget is reflected as the CIP’s first year capital improvement expenditures to ensure the
most accurate capital financing information. An important distinction between the budget and CIP
is that the one-year budget is the legally adopted annual operating budget, whereas the longer-term
CIP does not necessarily commit the City to a particular expenditure for a particular year as finances
are reviewed on an ongoing basis and updated accordingly in the annual budget process. Thus, the
CIP allows flexibility in scheduling projects based on need or funding opportunities.
revenues
The City uses a number of funding mechanisms to pay for its capital facilities’ needs. Funding
for capital projects comes from a variety of sources including grants, bonds, property and sales
taxes, impact fees, and contributions. Some of these funds are earmarked for specific projects
while other projects are funded by the General Fund. The General Fund revenues are used not
only for part of the capital facilities expenditures, but also for the operation and maintenance of
the City. Utility fees are the primary source of revenue for water, sewer, and storm drainage
capital improvements and operating costs; however, additional non-city sources of funds will be
needed to fund many projects. The non-city sources would include grants, financing with
bonds, impact fees, County, State or Federal funds, and the continued use of Utility or Road
Local Improvement District (ULID & RLID) and developer extension agreements.
expenditures
The CIP, as incorporated by reference into the Capital Facilities Element, covers only the cost of
capital facilities. With the development of these facilities there will be other operating,
maintenance and staff costs that will continue to accrue annually over the life of the facility.
(Ord 2894XXXX effective date: 12/25/2019XX/XX/2020) page CF-17GOALS AND POLICIES
provide facilities and services
CF Goal A. Provide adequate public services and facilities which address existing
deficiencies and future needs through prudent use of fiscal resources, levels of service,
realistic timelines, resource management, and sustainable development.
CF Policy A1 The Capital Improvement Plan should be consistent with the Comprehensive
Plan.
CF Policy A2 The Capital Improvement Plan should contain an inventory of existing capital
facilities and their locations and capacities, a forecast of future needs, and the
proposed location and capacities of new or expanded capital facilities.
CF Policy A3 The Capital Improvement Plan should contain projected funding capacities
and identify sources of funding for proposed capital facilities.
CF Policy A4 The Capital Improvement Plan should identify existing deficiencies and the
means to correct those deficiencies.
level of service
CF Goal B. Level of Service Standards. Level of service standards shall be used to evaluate
adequate public facilities and services and projected needs based upon the future
population estimates in Table L-5 Population and Household Projection of the Land Use
Element.
CF Policy B1 The existing Level of Service for water supply shall provide reliable water
service for domestic use, fire flow protection, and emergencies.
CF Policy B2 Stormwater management Level of Service standards are based on the
requirements of the King County Surface Water Design Manual, as adopted by
the City of Issaquah.
CF Policy B3 The Level of Service for sewer facilities includes using 100% of the
Department of Ecology criteria for Sewer Works Design; providing gravity
system service where feasible; and ensuring new systems can safely pass
wastewater flow as determined by the Sewer System Plan.
CF Policy B4 The City will work with the Sammamish Plateau Water and Sewer District and
other water and sewer jurisdictions to ensure adequate service is provided for
properties served by those suppliers.
CF Policy B5 Collection services for garbage, recycling, and food waste compost, shall be
available to all properties within the City.
(Ord 2894XXXX effective date: 12/25/2019XX/XX/2020) page CF-18CF Policy B6 The Level of Service for fire protection shall be the ratio of capacity to
demand. Demand is defined as the amount of time spent by staff responding
to incidents, and availability as all the time not spent responding to incidents.
The minimum acceptable availability percentage for the City is 90%. When
availability goes below 90%, the service provision goes below an acceptable
level.
CF Policy B7 The Level of Service for police protection is based on calls per service,
including those associated with criminal investigations.
CF Policy B8 The Parks, Recreation, Trails and Open Space Level of Service Standard is
based on the City’s existing inventory and proposed project list found in the
Capital Improvement Program.
CF Policy B9 The Level of Service for transportation is:
The intersection level of service (LOS) standard in Issaquah shall be LOS D, as
defined by the latest edition of the Highway Capacity Manual. For
Transportation Concurrency purposes, five (5) concurrency intersections may
operate at LOS E or F at any point in time; as long as the weighted average (by
traffic volume) Citywide LOS standard for all concurrency intersections is
maintained at LOS D. All other concurrency intersections must operate at LOS
D or better. The following five (5) intersections may operate at LOS E or F:
1. NW Sammamish Road/12th Avenue NW/17th Avenue NW/SE 56th Street
2. SR 900/I-90 Eastbound Ramps
3. Sunset Way/Front Street
4. SE Issaquah Fall City Road/Issaquah Pine Lake Road SE/Highlands Drive
NE
5. SE Issaquah Fall City Road/SE Black Nugget Road
CF Policy B10 The Level of Service for public schools is established in the “Issaquah School
District No. 411, 2019 2020 Capital Facilities Plan.” The Issaquah School
District No. 411 2019 Capital Facilities Plan, dated May 2228, 2019 2020 is
incorporated herein by reference, provided the school impact fee amounts set
forth in the Plan are subject to separate approval by the Issaquah City Council.
CF Goal C. Manage land use change and develop capital facilities and services to direct and
control land use patterns, intensities and efficient service provision.
CF Policy C1 Allow development only when and where all public facilities and essential
public services are adequate and such development can adequately be served
without reducing levels of service elsewhere.
CF Policy C2 Development must provide facilities and/or services at its own expense in
order to develop concurrency with service provision if adopted level of service
for facilities and/or services are currently unavailable and public funds are not
committed to provide such facilities.
(Ord 2894XXXX effective date: 12/25/2019XX/XX/2020) page CF-19CF Policy C3 Provide public facilities and services at the adopted level of service standards
needed to serve said development prior to the issuance of the Certificate of
Occupancy. If facilities and services are not provided, a Certificate of
Occupancy shall not be granted.
CF Policy C4 Future development shall bear a fair share, as defined, of facility improvement
cost necessitated by the development to achieve and maintain adopted level of
service standards and efficient service provision.
CF Policy C5 "Concurrent with development" shall mean that transportation facilities or
system improvements are currently existing, or financially committed for
completion within six years of the issuance of the Certificate of Occupancy
RCW 36.70A.070(6)(b). For developments or projects that do not have a
Certificate of Occupancy, a similar measure will be established through a
Concurrency Management System.
CF Goal D. All projects in the Capital Improvement Plan shall be consistent with the LU
Policy I2, “Municipal operations will be dedicated to enhancing the community’s water and
air quality, protection of critical areas and water resources, and provision of efficient public
services to maximize public safety.”
CF Policy D1 Capital projects should, to the extent feasible, conform to the development and
design standards applicable at the location of the facility, such as Appendix 2
Design Standards of Chapter 18.07 IMC, Olde Town Design Standards, or the
Central Issaquah Development and Design Standards.
CF Policy D2 Capital projects should meet the localized needs of projected growth patterns
as established in the Land Use Element.
CF Policy D3 Capital projects should minimize impact on the surrounding uses and natural
and cultural resources.
CF Policy D4 Capital projects should be consistent with the policies for the creation and
maintenance of utility facilities and public services in the Utilities and Public
Services Element.
CF Policy D5 Capital projects should be consistent with the requirements for plans of state
agencies.
CF Goal E. Finance the needed capital facilities in an economic, equitable and efficient
manner.
CF Policy E1 All City departments shall coordinate long range financial planning activities to
conserve fiscal resources available to implement the Capital Improvement
Plan, including the Transportation Improvement Plan.
CF Policy E2 Use the Six Year Capital Improvement Plan to prioritize the financing of
capital facilities within projected funding capacities and update it annually prior
(Ord 2894XXXX effective date: 12/25/2019XX/XX/2020) page CF-20to the City's budget process. High priority of funding shall be given to those
projects most consistent with the City's Comprehensive Plan goals.
CF Policy E3 Evaluate capital projects that are not included in the Capital Improvement Plan
and are potentially consistent with the Comprehensive Plan prior to the
project's inclusion into the City’s budget.
CF Policy E4 Distribute the burden for financing capital facilities among the primary
beneficiaries of the facility, including the present and future users where
feasible.
CF Policy E5 Use funding appropriate to the project, and consider including the use of
general revenues to fund projects which provide general benefit to the entire
community such as a new police facility or human services campus; long-term
borrowing for capital facilities which benefit the City for more than one
generation; special assessment, revenue, or other self-supporting bonds instead
of general obligation bonds; and grants and other private funds where possible.
CF Policy E6 Any revenue source that cannot be used for the highest priority will be used
beginning with the highest priority for which the revenue can legally be
expended. The City will determine the priority of public facility capital
improvements in a manner consistent with City Council Resolution 2013-13
(Comprehensive Financial and Budget Policies).
CF Policy E7 If funding opportunities for capital facilities are insufficient to meet existing
needs for the provision of urban services, reassess the Land Use Element’s
forecasted growth and adopted levels of service.
CF Policy E8 Continue collecting impact fees in accordance with the GMA and the Land
Use Code as part of the financing for public facilities. Such financing should
provide for a balance between impact fees and other sources of public funds.
Impact fees should be reviewed on an annual basis.
CF Policy E9 Collect impact fees only for system improvements which are reasonably related
to and will benefit the new development in accordance with GMA; the fees
shall not exceed a proportionate share of the costs of system improvements
reasonably related to the new development.
CF Policy E10 Continue to assess and collect those mitigation fees described in the Land Use
Code for public services and facilities not covered by impact fees.
CF Policy E11 Continue working with the Issaquah School District to collect and assess
school impact fees, and streamline those procedures and protocols governing
the fee program.
(Ord 2894XXXX effective date: 12/25/2019XX/XX/2020) page CF-21sustainability
CF Goal F. Incorporate sustainable products and practices as an integral part of all City
capital facilities projects and services to ensure Issaquah’s ability to meet future needs.
CF Policy F1 Encourage infill, redevelopment, and PAA development to design, develop,
construct and maintain projects in a resource efficient and sustainable manner,
which minimizes impacts to and improves the quality of the environment,
community and economy.
CF Policy F2 Capital facilities should achieve a LEED Silver or similar level of certification
in accordance with the City’s Sustainable Building and Infrastructure Policy
(Resolution No. 2004-11).
implementation
CF Goal G. Measure the effectiveness and success of the Comprehensive Plan in achieving
community visions, goals and policies.
discussion
Achieving the visions of the Issaquah community for how our City should look, feel and
function is dependent on implementation of the goals and policies adopted in this document.
While there are not sufficient resources to accomplish all of the implementation strategies
simultaneously, the City can make progress to carry out the Comprehensive Plan by identifying
priorities and necessary resources. The City has established a list of Implementation Strategies
(Appendix B) that are needed to accomplish the Community vision within the Comprehensive
Plan, and although not complete, the list is intended to be used as a tool for prioritizing City
resources, including budget and staff time. Additionally, the City cannot accomplish all the
implementation strategies alone. As part of a much larger and growing metropolitan area, issues
such as growth rates, housing supply and demand, and transportation systems require
cooperation and partnerships with the public and private sectors as well as local, state and
federal agencies.
CF Policy G1 Ensure Comprehensive Plan goals and policies are accompanied by related and
required implementing actions, including but not limited to those listed in the
Implementation Strategy (Appendix B).
(Ord 2894XXXX effective date: 12/25/2019XX/XX/2020) page CF-22(Ord 2894XXXX effective date: 12/25/2019XX/XX/2020) page CF-23
(Ord 2894XXXX effective date: 12/25/2019XX/XX/2020) page CF-24
You can also read