SCIENCE ARTS AND COMMERCE - INTERNATIONAL JOURNAL OF
←
→
Page content transcription
If your browser does not render page correctly, please read the page content below
International Journal of Science Arts and Commerce                              ISSN: 0249-5368

                INTERNATIONAL JOURNAL OF
       SCIENCE ARTS AND COMMERCE
  INFLUENCE OF SERVICE QUALITY ON CUSTOMER
          RETENTION IN THE TANZANIA
        TELECOMMUNICATION INDUSTRY.
   A CASE OF THE VODACOM TANZANIA LIMITED
                   COMPANY

                                            George Kanire
                            Kampala International University in Tanzania.

                                       Dr. Emmanuel Tonya
                                   The Open University of Tanzania
                                     Dr. Alberto Gabriel Ndekwa
                                     Ruaha Cathoric University.

ABSTRACT
This study aimed at analyzing the influence of service quality on customer retention in the
telecommunication industry in Tanzania. Specifically, the study determines the influence of
Service quality on customer retention in the Tanzania telecommunication industry. The study
used an explanatory research design to search for a causal relationship between the selected
variables in this study. The study used a questionnaire instrument to gather quantitative data.
The quantitative data collected from the respondents ware used to test the study hypothesis and
the model developed. A simple random sampling technique was used to draw a sample of 400
persons from Vodacom customers in Dar-es-salaam. The data collected were analyzed using
structural equation modeling (SEM). The study revealed that service quality has a positive and
significant influence on customer retention. The study concludes by recommending that, the
company improve its customer retention campaigns by rendering improved service quality. To
achieve that, the company should ensure the services can guarantee tangibility, assurance,
responsiveness, and reliability.

Key words: Customer Relationship Marketing Service Quality, customer retention.

www.ijsac.net                                                                          Page 244
International Journal of Science Arts and Commerce Vol. 5 No 11, November -2020 INTRODUCTION The world has taken cognizance of service quality as one of the best and contemporary customer relationship marketing strategies for telecommunication companies to satisfy needs and retain customers (Bolton&Tarasi(2007). Al-Hersh, Aburoub&Saaty (2014) point out that, the adoption of the service quality approach in the telecommunication industry has triggered an improved relationship between business and their customers. This provides an opportunity for companies to increase the sales volume, generating revenue, and increased shares in the market. Jayanthaa&Geethab (2018) added that improved service quality is used by the Sri Lankan telecommunication firms to promote their sales volumes. According toSenguo, Xixiang&Kilango (2017) argued that service quality is playing an integral part in building mutual benefits and relationships between a business and its customers. On the other hand, the service quality approach stands as a key component in promoting and maintain a long-lasting relationship in the commercial sector. Similarly, Chindo (2013) observed that in the context of the Nigerian telecommunication sector; the majority of companies carrying a service quality approach as part of the customer relationship marketing campaigns. The implementations of customer relationship marketing campaigns are used by business companies to maintain a good relationship and retaining customers. The companies in the telecommunication sector fully adopted customer relationship marketing as it serves as a key contributor for companies to enjoy both economic benefits and growth of the nation’s GDP (Ogbechi, Okafor &Orukotan,2018). In Tanzania as in other countries, the telecommunication industry reduces the costs of doing business and increases productivity by deploying effective campaigns to offer quality products and services (SigitParawansa,2018). Companies use customer relationship marketing to create customer trust, commitment, and build a long-lasting relationship through quality and attractive package to retain customers (Sife, Kiondo&Lyimo-Macha, 2010). Due to increased competition in retaining customers in the telecommunication sector, the companies exhibit a high competition to offer quality services. As argued by Tinashe &Eustina (2016) as a result of the rapid growth in competition and changing consumer landscape; businesses in the telecommunication sector have witnessed a strategic move using offensive marketing aimed at offering quality services to retain customers. For instance, in the US telecommunications network, companies such as Verizon Communications Inc, AT&T Inc, and Softbank Group Corp invested heavily in customer relationship marketing to create long term relationship with customers (Powell, Mihan&Weinert, 2014). Likewise, the telecommunication networks in the UK, such as Vodafone, T-mobile, and Virgin mobile adopted customer trust schemes by improving the company image and trust for retaining customers and consequently selling more of their products (Rahimi, 2014). In the context of Asia, the study by Djajanto, Nimran&Kumadji (2014) identified that telecom firms are implementing customer-centric initiatives to retain customers through reliable services. Concerning the African telecommunication market, Dubihlela& Molise-Khosa (2014) advocate www.ijsac.net Page 245
International Journal of Science Arts and Commerce                                  ISSN: 0249-5368

that call center initiatives in telecommunication are increasingly adopted to ensure that there are
quality and reliability on service provision for improved customer retention. Also,
Mkono&Kapinga (2014) confirmed that the majority of telecommunication firms in Tanzania,
including Vodacom Tanzania, are increasingly offering competitive service packages to
customers. For instance, Vodacom Tanzania initiated and improved mobile payment, internet
services, and call tariffs to maintain the quality of the services offered. The efforts focused on
relationship marketing to improve the quality of the services as well as creating a win-win
situation, from which both customers and Vodacom could uplift and maintain a good relationship
with customers (Lancaster, 2017). On the other hand, the government of Tanzania initiated the
ICT policy in 2016 as part of its effort to support the initiatives carried out by telecommunication
firms. The government ICT policy intends to support the telecommunication sector in offering
quality services and maintain a good relationship between customers and telecommunication
firms (URT, 2016).

Despite the contribution from studies and benefits proven by telecommunication companies that
service quality can affect customer retention (Senguo, Xixiang& Kilango,2017), but there is a
need for further studies to resolve the customer retention in Tanzania telecommunication
industry. Magasi (2015) indicates that the companies including Vodacom have done several
initiatives on service quality, trust, and relationship commitment for companies to retain
customers. The initiatives capitalized on relationship marketing campaigns intending to maintain
customer retention and good relationship. Vodacom is one of the telecommunication companies
in Tanzania affected by customer retention problems. Besides the initiatives, Vodacom PLC
expected to maintain its sales volume and market share, but in turn, the company exhibited a
customer retention problem. The company shares dropped from 36.7% to 32% in 2015, the
problem is also challenging the business operation and the plan to foster the social-economic
development of the country in general (Vodacom Tanzania PLC, 2019). Ofori-Dwumfuo,
Owusu-Ansah & Nartey (2013) added that the Ghanaian telecommunication companies are also
facing challenges related to the customer retention problem. It was further explained that if a
customer retention problem is not resolved, the companies are likely to face a serious drop in
market shares, sales volume, and revenue.

However, little known in the literature on how the SERVQUAL model through its scale
including assurance, reliability, empathy, tangibility, and responsiveness can influence customer
retention without the mediating effecting. The model the five elements as the major constructs,
also the model mentioning loyalty as a mediating effect between service quality and customer
retention. Given this inconsistency in the findings and inadequate explanation from the model to
analyze the direct influence of customer relationship marketing on customer retention;therefore
the current study measures the influence of service quality without the mediating factor.
Thus, this study intends to find out how service quality constructs can influence customer
retention in the Tanzania telecommunication industry.

www.ijsac.net                                                                              Page 246
International Journal of Science Arts and Commerce                       Vol. 5 No 11, November -2020

Specifically, the objective of this study is to determine the influence of service quality on
customer retention in Vodacom Tanzania Limited.

METHODOLOGY
This study considers the elements from theservice quality modelsuch as empathy, tangibility,
reliability, assurance, and responsiveness as major factors affecting customer retentionin the
Tanzania telecommunication industry. A structured questionnaire was designed consisting of 5
constructs from which different statements were made. Also, a 5-point Likert scale was used to
rate the responses from the participants. Thereafter, data from the respondents were cleaned and
invalid responses were also removed. The study involved 400 participants as a sample taken
from a populationof 1,224,000 active users of the Vodacom network in Dar-es-salaam(Vodacom
Tanzania PLC, 2018). All items used as the measurement in the context of this study were
borrowed from prior studies and modified to ensure construct validity. The items of empathy,
tangibility, reliability, assurance, and responsivenesswere adopted from Nsiah & Mensah (2014).
The items of customer retention were adopted and modified from Hossain, Chowdhury &Jahan
(2017). The quantitative data gathered using the survey questionnaire was entered into IBM
SPSS version 20; in this regard the software-assisted the study to conduct descriptive and
inferential analysis. Leech et al. (2005) asserted that frequencies and percentages are useful tools
to explain both profile and characteristics of phenomena. In this case, frequency and percentage
were used by this study in analyzing as well as explaining the profile and characteristics of the
customers such as location. Moreover, structural equation modeling (SEM) was used to test
hypotheses and analyze the coefficient path. Similarly, the preliminaries were done through
exploratory factor analysis (EFA) and later the confirmatory factor analysis (CFA). The process
assisted the study to attain the model fit indices some variables were removed and final variables
were 7 under all constructs. The outcomes from the usable sample were analyzed, and the
research model was examined through the assistance of Amos 24 software.

RESULTS AND DISCUSSION

Respondents’ Distribution by Location
The study sample comprised respondents from three Municipalities namely Ilala, Temeke, and
Kinondoni as summarized in Table 3.1. The findings show that the majority of the respondents
involved in this study ie 38.8% were located in Ilala, 26.5% in Temeke, and 34.7% in Kinondoni.
It is understandable, why the majority of Vodacom beneficiaries were in Ilala. The reason being
that majority of Vodacom business facilities are concentrated in Ilala as a center for government
and economic activities.

Table 3.1 Respondents’ Distribution by Location

www.ijsac.net                                                                               Page 247
International Journal of Science Arts and Commerce                                   ISSN: 0249-5368

Location                         Frequencies         Percentages
Ilala                                152               38.8
Temeke                               104               26.5
Kinondoni                            136               34.7
Total                                392              100.0

Model Validation
This section is composed of two parts: model validation and analysis of path coefficient as
described below. The Model validation process intended to express how the study associated
data collected with the variables used to develop the conceptual framework without data support.
This section checked to confirm, whether the constructs aligned with the stated measures or
indicator variables. On the analysis of the path coefficient, the study examined the hypotheses
and their coefficients and scores obtained. The hypotheses were tested to determine the direction,
strength, and level of significance through the path coefficients.

Exploratory and the Confirmatory factor analysis

Model validation aimed to check and verify if the proposed factor structures are consistent with
the actual data collected from the field. Model validation was necessary because, at the
beginning of the study, the researcher developed the conceptual framework without supporting
data. It was necessary to check if the constructs were aligned with their underlining measures or
indicator variables. To ensure that the constructs designed were aligned with their indicators, the
researcher used both the exploratory factor analysis and the confirmatory factor analysis as
described below.

Exploratory Factor Analysis
To ensure that the constructs were aligned with their indicator variables before the actual data
analysis, it was necessary to carry out exploratory factor analysis. This is because, at the start of
any study, the researcher mixes empirical and theoretical measures of a construct from different
settings without data. Scholars such as Henson & Roberts (2006) argue that in a situation where
there is a mixing of constructs from different theories and empirical literature, a poor model fit
will always result. To address this in the current study, exploratory factor analysis was used to
identify a set of unobserved factors that reconstruct the complexity of the observed data in an
essential form.

 Exploratory factor analysis with varimax rotation was conducted to assess the underlying
structure for the forty (40) items in the survey questionnaire. In selecting factors to retain, four
criteria were adopted namely, Eigenvalues, scree test (i.e., screen plot), the conceptual theoretical
assumption, and factors that have at least three items. The use of a combination of criteria is
recommended by Yong & Pearce (2013) to help to offsite the weakness of using one criterion.
Given this situation, four factors were produced based on the coded questionnaire attached
inAppendix I with 70% of the cumulative variance as attached in Appendix I. The four-factor

www.ijsac.net                                                                               Page 248
International Journal of Science Arts and Commerce                       Vol. 5 No 11, November -2020

had the Eigenvalues >1, all above the break/cut off point on-screen graph, and had at least two
items aligned as in the conceptual framework. This means that all the retained factors meet
Kaiser’s criterion.
After discovering that the four factors had met the criteria and qualified to be retained, further
analysis of measured variables was done to see if the indicators fit in their underlying factors. To
assess the suitability of each measured variable to their underlying structure, the following
criteria as recommended by Yong & Pearce (2013) were adopted for retaining/dropping an
item/indicator as follows:

First, all items loaded into their associated factors were retained and those loaded into more than
one factor were dropped. Secondly, if more than two items were loaded in one factor, all items
were retained and if less than three items were loaded in one factor, all were dropped. Third, all
items with a KMO p-value greater than 0.5 were retained and those with less than 0.5 were
dropped. Fourth, all items with loading ranging from 0.4 to 0.8 were retained and those with
loading less than 0.4 or above 0.8 were dropped. Yong & Pearce (2013) suggested these criteria
to be adopted for retaining the items or dropping the items to improve the model. As far as this
study is concerned, Table 4.6 presents a selected output of SPSS items that were dropped.

Table 4.2 Selected exploratory factor analysis output of Items dropped

FACTOR                                               ITEM REMOVED
SQ: Service Quality                                  SQ5
CR: Customer retention                               CR1 and CR5

In-Service Quality (SQ): item SQ5was eliminated because they had weak loadings on their
theoretical model and hence affected its fitting. CR1: CR1 and CR5 had a negligible contribution
because it was loaded alone in a single factor which failed to support theoretical assumptions.
Given this perspective, the items that did not fit well with the factor solution were dropped from
the analysis as described in Table 3.3 and those which fitted very well were retained as described
in Table 4.3:

Table 3.3 Exploratory Factor Analysis Rotated Component Matrix

                               components
                                      1                  2

   SQ1          .915

   SQ3          .913

   SQ4          .902

www.ijsac.net                                                                               Page 249
International Journal of Science Arts and Commerce ISSN: 0249-5368 SQ2 .894 CR3 .916 CR2 .889 CR4 .888 Having established the study framework from the exploratory factor analysis, the next step was to perform a confirmatory factor analysis as described in detail in the following section: A Confirmatory Factor Analysis The exploratory factor analysis failed to assess the loadings of the measures, error variances, and covariance. In the current study, it was necessary to carry out confirmatory factor analysis for theoretical constructs through assessing the loadings of the measures, error variances, and covariance (Hooper et al., 2008). At this stage, the aim was to confirm and harmonize a belief about how the original variables are organized in a particular way using CFA. The study carried out a confirmatory factor analysis, a measurement model was developed to test for measurement errors and the correlation between the latent variables (Yong & Pearce, 2013). In this section, a model of the composite structure was used as presented in the conceptual framework. Model Fitness Evaluation in a Confirmatory Factor Analysis The following criteria were used to guide the model refinement process and so achieve a better fit as recommended by Schermelleh-Engel, et al. (2003) that a Standardized regression weight (S.R.W) value should be above 0.5 and Modification indexes (MI) that reveal high covariance between measurement errors accompanied by high regression weights between these errors’ construct and cross-loading items were recommended for deletion. Measurement Model for Baseline Model In the current study, to reach a baseline measurement model that fits both components, the four individual measurement models which were developed earlier were combined and a CFA was run with the maximum likelihood estimate in IBM Amos 20 to determine its fitness. After the initial run, the results showed a bad model fit with CMIN/DF = 5.263, GFI = 0.811, AGFI = 0.762, CFI = 0.702 and RMSEA = 0. 109. Based on Hoe (2008) recommendation which requires a model to achieve the following minimum requirements CFI (> 0.90 indicates good fit), RMSEA (< 0.08 indicates acceptable fit), and commonly used χ2 statistic (χ2/ df ratio of 3 or less) to be considered fit. To improve the model, some items that were affecting the significance of the model’s fitness were removed as recommended by Hooper, et al. (2008) explains how to remove the items that demonstrate low loading, and those items standardized regression weights (S.R.W) values less than 0.5. The items of service quality (SQ) were not removed from the analysis because they were fitting. Customer Trust (CT): CT6 and CT7 were eliminated from the analysis because www.ijsac.net Page 250
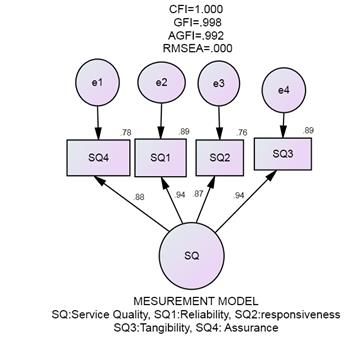
International Journal of Science Arts and Commerce                        Vol. 5 No 11, November -2020

they had weak loadings on the theoretical model and hence affected its fitting. At this point,
elimination was made at the item level, and items that were removed because their effect was not
only weakening the model, but they also indicated weak statistical power.
Measurement Model for Service Quality
Initially, CFI was run using IBM Amos 20 to test and confirm for Service Quality measurement
model base on the following observed variable namely SQ1, SQ2, SQ3, and SQ4. The model
output as illustrated in figure 4.3 indicating that the model fit well based on Hoe(2008)
commonly applied fit indices which require a model to achieve the following minimum
requirement, CFI (> 0.90 indicates good fit), RMSEA (< 0.08 indicates acceptable fit), and
commonly used χ2 statistic (χ2/ df ratio of 3 or less) to be considered fit.

Figure 3.1: Measurement Model for Service Quality

4.4.3 Influence of Service Quality on Customer retention
The third postulated relationship in this study hypothesized a positive and strongly significant
relationship between service quality and customer retention as stated below.
Null hypothesis:H0: service quality has a positive significant influence on Customer retention
For testing this hypothesis, descriptive statistic analysis was run first to profile the influence of
service quality on predicting customer retention as illustrated in Table 3.4 below.

www.ijsac.net                                                                                Page 251
International Journal of Science Arts and Commerce                                  ISSN: 0249-5368

Table 3.4: Descriptive Statistics

                      N        Minimum                        Maximum        Mean
SQ3                   392      1                              5              3.88
SQ1                   392      1                              5              3.87
SQ4                   392      1                              5              3.81
SQ2                   392      1                              5              3.81
Valid             N
                      392
(listwise)

Table 3.4 shows the results of the analysis. Among the four attributes of service quality in Table
3.4, tangibility had a high impact on customer retention in telecommunication followed by
reliability, assurance, and responsiveness. This means that tangibility yields a high mean value of
3.88 with a mean of 3.88 close to 4. The greater the mean the higher the impact or the more the
mean value closer to five, has more impact.

Further analysis was done using SEM to determine whether service quality has a significant
influence on customer retention as illustrated in Table 3.4.

Table 3.5: Service Quality Path Coefficient

                   Estimate    S.E.    C.R.     P Label     S.R.W REMARKS
CR
International Journal of Science Arts and Commerce Vol. 5 No 11, November -2020 Apart from the standardized coefficient, further analysis was done using critical ratio and p-value to determining the significant influence of service quality on customer retention. In this study, findings yielded critical values (C.R = 4.943 which is >1.96) and a significance level of p = 0.000. The results concur with Greenland, et al (2016) who argued that a relationship that has yield a critical ratio greater than 1.96 and a p-value less than 0.05 is considered significant. This means that the null hypothesis (Ha)was accepted as it has a critical ratio of 5.648 which indicates the service quality has a significant influence on customer retention. On the other hand, the alternative hypothesis (Hb) was rejected. The current study has similar results to the findings presented by Agyei &Kilika (2013), which indicated a strongly significant influence of service quality on customer retention. Prior studies includingRanaweera& Neely (2003) and Kihara&Ngugi (2014)confirming that service quality has a positive and significant influence on customer retention. For example, Ranaweera and Neely's (2003) perceptions of service quality have a direct linear relationship with customer retention as compared to low-cost offers. On the other hand, Kihara& Ngugi (2014) found and confirmed that quality service has a significant influence on customer retention in the telecommunication industry. It means that quality service is a pushing factor towards customer retention in the telecommunication industry. Therefore, this study implies that customers with high rated perception towards quality service have a high intention to purchase the pertinent product repetitively. Moreover, the study by Venetis&Ghauri (2014) found results that are in line with this study. The study indicates that quality service can contribute to the long-term relationship which leads to customer retention. Similarly, quality service variables such as tangibility, assurance, responsiveness, and reliability were found to have a significant influence on customer retention. Furthermore, Bleryet al. (2010) explain that price and trends of quality service had a direct effect on customer retention in the Greece mobile telecommunication industry. Other studies were found to be inconsistent with the current study. Notably, Kapai&Moronge (2015) revealed that quality service factors like customer care and price (tariff structure) are negatively correlated with customer retention. Contrary to the study by Molapo&Mukwanda (2011) who argued that quality service offers affordable service and provision of customer support services have shown a significant influence on customer retention. Its findings concur with the results found by this study, where both price perceptions and customer indifference were not significantly affected by service quality on retention. It means the perceived quality service improvement does not depend on how customers perceive the price and eventually the service quality will strengthen customer retention.Sedighimanesh et al (2017) revealed that often customers are looking for quality regardless of how much price they pay. From this www.ijsac.net Page 253
International Journal of Science Arts and Commerce                                  ISSN: 0249-5368

understanding, it is obvious that the customers mainly focus on quality service improvement to
build their loyalty. The improvement made by telecommunication companies targeting customer
satisfaction is what leads to repeat purchases and eventually customer retention.

Similarly,Zangmo, Liampreecha&Chemsripong (2015) tested constructs such as reliability,
assurance, and empathy quality service values were tested and it was revealed that the factors
were positive and significantly influenced customer retention. These studies came out with the
same conclusion. On their part, Idrees &Xinping (2017) used reliability, responsiveness,
assurance, empathy, and tangibles as salient determinants on customer retention. This study is in
agreement with other scholars who found that quality service has a positive and significant
influence on customer retention. The findings support the argument made on the quality service
model. The study by Nsiah & Mensah (2014) added that quality service has a positive impact on
overall customer retention. The research proves that empathy and responsiveness play the most
important roles in customer retention levels followed by tangibility, assurance, and reliability.
The research findings also indicate that offering high-quality service increases customer
retention, which in turn leads to a high level of customer commitment to repurchase products
from the business.

The findings from this study are also in contrast with the argument made by Sari &Mugiono
(2018) who shows that quality service does not influence customer retention. Studies including
the one done by Kapai&Moronge (2015) found that quality service does not directly influence
customer retention. However, customers can be retained when quality service is reflected
through attractive prices offered by the service provider. Kapai&Moronge (2015) added that
Airtel in Kenya managed to retain its customers by offering quality service.

Furthermore, this study is supported by the argument made by Rehman, Shareef &Ishaque,
(2012) who disclosed that quality service creates the willingness to trust the services offered and
build a strong relationship that calls for customers to stay on. Similarly, these results are in
agreement with Prasad (2013) who indicated that there was a significant relationship between
quality service and customer retention. In this study the constructs such reliability, assurance,
and empathy. These service quality attributes were tested and revealed that they have a positive
relationship and a significant influence on customer retention.

Conclusively; the tangibility, assurance, responsiveness, and reliability indicate that the services
have a strong significant influence on customer retention. Based on the findings this study
concludes that not all service quality attributes offered by telecom companies are used to retain
customers, some are not rewarding. This can be due to the contextual difference in which a
telecommunication company operates. This tends to explain the characteristics of the unique
services which are rewarding in retaining customers of a telecommunication company.

www.ijsac.net                                                                              Page 254
International Journal of Science Arts and Commerce                       Vol. 5 No 11, November -2020

Nevertheless, this study has some limitations which offer opportunities for future research. The
first limitation of this research paper is that it is concerned with only factors of service quality
that affect customer retention. But,several factors can influence customer retention. Therefore,
future studies should focus on multiple settings in addressing customer retention phenomena.

REFERENCE

Agyei, P.M. & Kilika, J.M. (2013). The relationship between service quality and customer
            loyalty in Kenya mobile telecommunication services industry, European Journal of
            Business and Management, 5(23).
Al-Hersh, A.M., Aburoub, A.S. &Saaty, A.S. ( 2014). The Impact of Customer Relationship
            Marketing on Customer Satisfaction of the Arab Bank Services, International
            Journal of Academic Research in Business and Social Science, 4(5).
Blery, E., Batistatos, N., Papastratou, E., Perifanos, I., Remoundaki, G., and Retsina, M. (2009).
            Service quality and customer retention in mobile telephony, Journal of Targeting,
            Measurement, and Analysis for Marketing, 17(1), 27 – 37.
Bolton, R,N.&Tarasi, C.O .(2007).Managing Customer Relationships, Researchgate.
Chin, W.W. (1998). Thepartialleastsquaresapproachforstructuralequationmodeling. In G.A.
       Marcoulides (Ed.), Modern methods for business research. Mahwah, N.J. Lawrence
       Erlbaum Associates.
Chindo, S. (2013). Assessing the Impact of GSM Sub-Telecommunication Sector on the
            Teledensity Rate and Economic Growth in Nigeria: Time Series Analysis,
            International Journal of Business and Social Science, 4 (3).
Djajanto, L, Nimran, U. & Kumadji, S. (2014). The Effect of Self-Service Technology, Service
            Quality, and Relationship Marketing on Customer Satisfaction and Loyalty. IOSR
            Journal of Business and Management, 16(1).
Dubihlela, J. & Molise-Khosa, P. (2014). Impact of e-CRM Implementation on Customer
            Loyalty, Customer Retention, and Customer Profitability for Hoteliers along the Vaal
            Meander of South Africa. Mediterranean Journal of Social Sciences, 5(16)
Greenland, S., Senn, S.J., Rothman, K.J., Carlin, J.B., Poole, C., Goodman, S.N. & Altman, D.G.
       (2016). Statistical tests, P values, confidence intervals, and power: a guide to
       misinterpretations, European Journal of Epidemiology, 31(1),337–350.
Henson, R. K. & Roberts, J. K. (2006). Use of Exploratory Factor Analysis in Published
       Research: Common Errors and Some Comment on Improved Practice. Educational and
       Psychological Measurement, (66)3.
Hoe, S. L. (2008).Issues and Procedures In Adopting Structural Equation Modeling Technique.
       Journal of Applied Quantitative Method, 3 (8), 79-83.
Hooper, D., Coughlan, J. & Mullen, M. R. (2008). Structural Equation Modelling: Guidelines for
            Determining Model Fit. The Electronic Journal of Business Research Methods, 6(1).

www.ijsac.net                                                                               Page 255
International Journal of Science Arts and Commerce ISSN: 0249-5368
Hossain, A., Chowdhury, R. & Jahan, N. (2017). Customer Retention and Telecommunications
Services in Bangladesh,International Journal of Asian Social Science, 7(11), 921-
930.
Hossain, A; Chowdhury, R. &Jahan, N.(2017).Customer retention and Telecommunications
services in Bangladesh,International Journal of Asian Social Science, 7(11).
Idrees, Z. &Xinping, X. (2017).Impact of Banking Relationship Characteristic on Service
Quality Dimensions and Customer Retention,International Journal of Academic
Research in Economics and Management Sciences,6 (1),2226-3624.
Jayanthaa, D. &Geethab, T. (2018). Determinants of Customer Retention with Special Reference
to Mobile Telecommunication Industry in Sri Lanka, International Conference on
Management and Economics, 3 (1), 331-340.
Kapai, R. &Moronge, M. (2015). Determinants of customer retention in the mobile
telecommunication industry in Kenya: a case of airtel Kenya. Strategic Journal of
business and change management, 2(2).
Kihara, A.S.N. &Ngugi, G.K. (2014). Factors influencing customer loyalty in the
Telecommunication industry in Kenya, International Journal of Social Sciences and
Entrepreneurship Special, 2(1).
Lancaster, H. (2017). Tanzania telecoms, Mobile, Broadband and Digital media – statistics and
analyses, a buddecomm report
Leech, N. L., Barrett, K. C. & Morgan, G. A. (2005). SPSS for Intermediate Statistics: Use and
interpretation. (2nded). Mahwah, New Jersey London: Lawrence Erlbaum
Associates, Publishers
Magasi, C. (2015). Customer Relationship Marketing and its Influence on Customer Retention:
A Case of Commercial Banking Industry in Tanzania, Third Middle East Conference
on Global Business, Economics, Finance, and Banking.
Mkono, N. & Kapinga, K.W. ( 2014). Telecommunication companies in Tanzania. Retrieved
from http//www.mkono.com/pdf/ICLG_Tanzania. Accessed on 25/03/2018.
Molapo, M.E. & Mukwanda, G. ( 2011). The Impact of Customer Retention Strategies in the
South African Cellular Industry: The Case of the Eastern Free State, International
Journal of Business, Humanities and Technology, (1)2.
Nsiah, R.&Asantewaah, A.M. (2014). The Effect of Service Quality on Customer Retention in
the Banking Industry in Ghana: A Case Study of Asokore Rural Bank Limited, SSRN
Electronic Journal.
Ofori-Dwumfuo, G.O., Owusu-Ansah, S. &Nartey,D. (2013). Achievement of Strategic ICT
Business objective through customer retention in Ghanaian telecommunication
Company, Current research Journal of Social Sciences 5(6).
Ogbechi, A.D., Okafor, L.I. &Orukotan, C.I. (2018). Effect of relationship marketing on
customer retention and loyalty in the money deposit bank industry, African Journals
Online, 12(2).
www.ijsac.net Page 256International Journal of Science Arts and Commerce Vol. 5 No 11, November -2020
Parasuraman, A., Berry, L. & Zeithaml, V. (2000). Delivering Quality Service, Simon, and
Schuster.
Parasuraman, A., Zeithaml, V.A., & Berry, L.L. (1985). A Conceptual Model Of Service Quality
And Its Implications For Future Research. Journal of Marketing, 49(1), 41–50.
Parasuraman, A., Zeithaml, V.A.,& Berry, L.L. (1988). SERVQUAL: A Multi-Item Scale For
Measuring Consumer Perceptions Of Service Quality. Journal of Retailing, 64(1), 12–40.
Powell, B., Mihan, S. & Weinert, T. (2014). Back to Basics for Communications Service
Providers. Available from: https://www.cognizant.com/InsightsWhitepapers/Back-to-
Basics-for-Communications-Service-Providers.pdf, accessed on 14/April,2018.
Prasad, N. (2013). A Study on the Role of Service Quality on Customer Retention in Banks,
MSRUAS.
Rahimi, R. (2014). Organizational culture perspective and implementing determinants of (CRM)
in the hotel industry: the case of a chain hotel in the UK, Doctoral Dissertation
Summary, European Journal of Tourism Research, (8)1.
Ranaweera, C. & Neely, A . (2003). Some moderating effects on the service quality-customer
retention link International. Journal of Operations & Production Management, (23)2.
Schermelleh-Engel, K., Moosbrugger, H. & Muller H. (2003). Evaluating the fit of structural
equation models: tests of significance and goodness-of-fit models. Methods of
Psychological Research Online, 8(1).
Science 2(14).
Sedighimanesh, M., Sedighmanesh, A. &Ashghaei, N. (2017). The Impact Of Self-Service
Technology On Customer Satisfaction Of Online Stores, International Journal of
Scientific & Technology Research 6(7).
Senguo, R.A., Xixiang,S.&Kilango,N.C. (2017).Marketing Communication Based on Customer
Satisfaction and Loyalty : Zantel Tanzania, International Journal of Innovation,
Management and Technology, 8 ( 4).
Sife, A.S, Kiondo, E. & Lyimo-Macha, J.G. (2010). Contribution of Mobile Phones to Rural
Livelihoods and Poverty Reduction in Morogoro Region, Tanzania, EJISDC, 42 (3).
pp 1-15.
SigitParawansa, D. (2018) .Effect of commitment and customers’ satisfaction on the relationship
between service quality and customer retention in rural banks in Makassar,
Indonesia, Journal of Management Development, 37(1), 53-64.
Studies Journal, 5 (11).
The United Republic of Tanzania. (2016). The Tanzania ICT policy, United Republic Tanzania.
Tinashe, C.D. &Eustina, C. (2016). The impact of Customer Retention Strategies on Customer
Loyalty and Satisfaction in Zimbabwean Commercial Banks (2014-2015), Case
Studies Journal, 5 (11).
Venetis, K.A. &Ghauri, P.N. (2014). Service Quality and Customer Retention: Building Long-
Term Relationships, European Journal of Marketing, 38(12), 1577-1598.
www.ijsac.net Page 257International Journal of Science Arts and Commerce ISSN: 0249-5368
Vodacom Tanzania PLC. (2017). Vodacom Tanzania PLC prospectus: amendments to the
prospectus, CMSA.
Vodacom Tanzania PLC. (2018). Vodacom customer care report, Vodacom Tanzania PLC.
Vodacom Tanzania PLC. (2019). Vodacom Tanzania’s Annual Report 2019, Vodacom Tanzania
Public Limited Company, available from www.vodacom reports.co.za, accessed on
14/March,2020.
Yong, A. G. & Pearce, S. (2013). A beginner’s guide to factor analysis: Focusing on exploratory
factor analysis. Tutorials in Quantitative Methods for Psychology, (9)2.
Zangmo, M., Liampreecha, W. & Chemsripong, S. (2015). The Impact of Service Quality in the
Airline industry in Bhutan, International Business Management, 9(6), 1281-1284.
Appendix I: Summary of Variance
Total Variance Explained
Component Initial Eigenvalues Extraction Sums of Squared Rotation Sums of Squared Loadings
Loadings
Total % of Cumulative Total % of Cumulative Total % of Cumulative
Variance % Variance % Variance %
1 5.816 36.348 36.348 5.816 36.348 36.348 3.622 22.635 22.635
2 3.091 19.322 55.669 3.091 19.322 55.669 3.609 22.559 45.194
3 2.127 13.296 68.965 2.127 13.296 68.965 2.717 16.984 62.178
4 1.545 9.657 78.622 1.545 9.657 78.622 2.631 16.444 78.622
5 1.067 6.670 85.292
6 .507 3.171 88.463
7 .447 2.793 91.256
8 .282 1.763 93.019
9 .236 1.472 94.491
10 .205 1.280 95.772
11 .175 1.093 96.865
12 .162 1.012 97.876
13 .118 .738 98.614
14 .101 .630 99.244
www.ijsac.net Page 258International Journal of Science Arts and Commerce Vol. 5 No 11, November -2020 15 .070 .437 99.682 16 .051 .318 100.000 Extraction Method: Principal Component Analysis. www.ijsac.net Page 259
You can also read