The abundance and diversity of bird species in Logged Ehor Forest Reserve Edo state, Nigeria
←
→
Page content transcription
If your browser does not render page correctly, please read the page content below
Scientific Reports in Life Sciences 2021, 2(1): 13-28
                                DOI: http://dx.doi.org/10.22034/srls.2020.520831.1008                                            Research Article

The abundance and diversity of bird species in Logged Ehor Forest
Reserve Edo state, Nigeria

Okosodo Ehi Francis
Department of Leisure and Tourism, Federal Polytechnic Ilaro, Ogun State
*
  Corresponding email: francis .okosodo@federalpolyilaro .edu .ng

Received: 12 December 2020 / Revised: 20 January 2021 / Accepted: 30 January 2021 / Published online: 4 Februry 2021.
How to cite: Okosodo F.F. (2021). The abundance and diversity of bird species in Logged Ehor Forest Reserve Edo state, Nigeria2(1), 13-28. DOI: DOI:
http://dx.doi.org/10.22034/srls.2020.520831.1008

Abstract
The abundance and diversity of bird species were studied in Ehor Forest Reserve Edo state, Nigeria. The
study area was divided into three compartments based on their different land-use types. The line transects
method was used to collect bird species diversity and abundance in the study area. In all of 60 transect
lines were randomly placed, measuring 1000 m. Each transect was divided into 200 m sections, with each
block having 20 transects randomly placed. The site size determined the number of transect lines. Data
were collected for six months (Dry and Wet seasons) in 20018. The quadrant method was used to
determine plant species composition. This method involves a total enumeration count (TEC) of all trees
above 1m in height and a Basal area of not less than 10cm from 25×25m2 quadrant sample plot, which
was randomly selected through balloting from each sampling compartments. Thirty-five (31) bird
species were recorded in the Farmland, Forty-five (45) bird species in the Fallow Area, and sixty-seven
(67) species encountered in the Undisturbed forest area. In all, a total of 143 bird species belonging to 43
families and 18 orders were recorded in the three study sites; the Order Passeriformes had the highest
frequency (51 %) of the total number of birds recorded, while the dominant families were Cuculidae and
Pycnonotidae, comprising (7.4 %) of the total species One endangered bird species, African Grey Parrot
and 13 species cuculidae were encountered in the study area. A total of 117 tree species were enumerated
in the study area, Ficus exasperata had the highest DBH, while Ceiba pentandra has the highest mean
height. Alchornea oppositifolia has the highest frequency of occurrence in the study area.

Keywords: Agricultural intensification, Avian species, Habitat fragmentation, Home range
Francis, 2021 Scientific Reports in Life Sciences 2(1): 13-28
Introduction
Nigeria is endowed with a variety of flora and fauna species, including charismatic mammals such as
Cross River Gorilla (Gorilla gorilla diehli) (Oates et al. 2008b), the West African chimpanzee (Pan
troglodytes verus (Humle et al. 2008), the African bush elephant Loxodonta Africana) (Blanc 2008),
white-bellied pangolin (Phataginus tricuspis) (Waterman et al. 2014), and beautiful avian species such as
crowned eagle (Stephanoaetus coronatus) (BirdLife International 2012a) and Ibadan malimbe (Malimbus
ibadanensis) (BirdLife International 2012b). However, biodiversity research and conservation efforts
made during the last fifty years have mostly focused on the fauna that in habait southeastern regions
further east of Lagos, north, south, or in the Niger Delta near the Cameroon border (Luiselli et al. 2015).
This is partly because human population densities are lower, and forests are denser in these regions. For
this reason, our knowledge of the fauna of south-western Nigeria west of Lagos is deficient (Koyenikan
2004).
Birds are among the best monitors of environmental changes and have been used to evaluate the
environment throughout history as biomonitors and; the changes in their population, behavior patterns
and reproductive ability have most often been used to examine the long-term effects of habitat
fragmentation. Hence they are good indicators of the ecological status of any given ecosystem (Oates
2008a). Forests attract a large number of avifauna because of the habitat suitability for most of them. This
mainly includes the birds associated with the vegetation, and for most, trees' existence is vital to their life
cycle. Birds show different levels of interest in various stands depending on the age of the stands.
The bird species composition is positively related to the forest‟s vegetation structure. The diversity of
birds and the native species is positively correlated with the vegetation's increasing structural complexity.
Also, a seasonal change in species diversity of birds occurs in forests due to their foraging behavior
(Oates 2008d). The present study was undertaken to assess the distribution and diversity of avifauna
species abundance and diversity in Akure Forest reserve south-western Nigeria. These limited studies in
Nigeria confirm that much more research needs to be carried out on tropical farmland biodiversity, and
these have great potential to contribute to maintaining the populations of common and rare bird species
through the well-informed management of agricultural development in Nigeria. The study areas are
hotspots for birds in Africa as recorded by International Birdlife Fact. Hence, this research work will
provide baseline information that will be of immense importance to other researchers in the management
of birds
Materials and methods
Study Area
14Francis, 2021 Scientific Reports in Life Sciences 2(1): 13-28
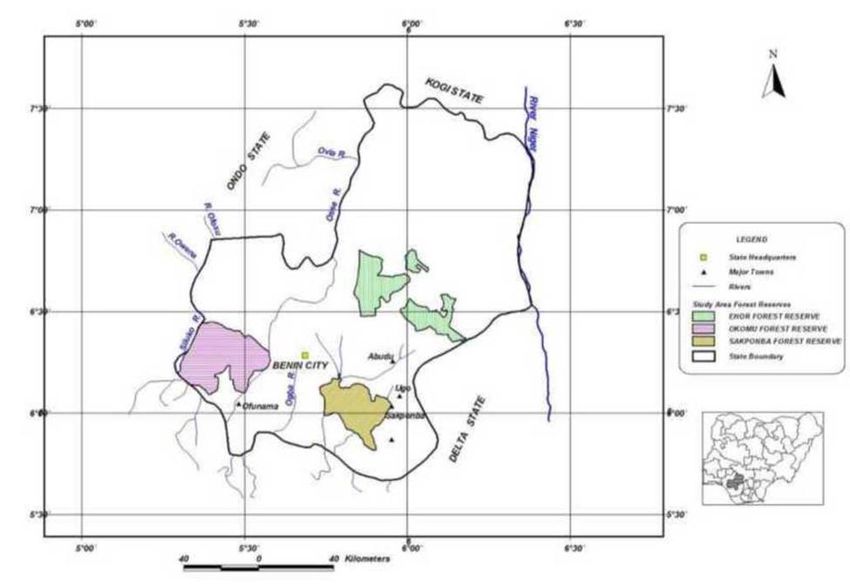
This study was carried out in Ehor forest reserve Edo state It covers an area of 69.93 km2. The three land
uses selected for the study were present within this reserve. Ehor Forest Reserve is managed by the
Department of Forestry, Edo State, Nigeria. The study site is situated on latitude 7°18’N and longitude
5°02’E. The three land uses were adjacent to each other. The climate is humid tropical with seasonal
variation. The mean annual rainfall is about 4000 mm with double maxima in July and September and a
short, relatively dry period in August. December through to February constitutes the major dry season
while January and February are the driest months, with each having less than 30 mm rainfall (Ajiboye
2012). . The relative humidity at 15 hours Greenwich Mean Time (GMT) is highest in the maxima
months of July and September (81%) and lowest in February (44%). Temperature ranges from about 20.6
°C to 33.5 °C. The monthly mean temperature is about 27 °C, a condition that is conducive to the
development of tropical rainforests (Ajiboye 2012). Soils are predominantly ferruginous tropical, typical
of the variety found in intensively weathered areas of basement complex formations in the rainforest zone
of south-western Nigeria. The soils are well-drained, mature, red, stony, and gravely in the upper parts of
the sequence. The texture of topsoil in the reserves is mainly sandy loam (Oksanen et al. 2013). The
area's natural vegetation is tropical rainforest characterized by emergent with International Journal of
Development and Sustainability multiple canopies and lianas. Some of the most commonly found trees in
the area include Melicia excelsa, Afzelia bipindensis, Antiaris africana, Brachystegia nigerica, Lophira
alata, Lovoa trichiliodes, Terminalia ivorensis, Terminalia superba, and Triplochiton scleroxylon.
However, the area's natural vegetation except for the areas devoted to forest reserve has now been
reduced to secondary regrowth forest thickets and fallow regrowth at varying stages of development or
replaced by perennial and annual crops (Ogunsesan et al. 2012).
15Francis, 2021 Scientific Reports in Life Sciences 2(1): 13-28
Figure 1: Map of the Study area (source: Aigbe et al. 2017)
Data Collection
The study area was divided into three compartments, which include the undisturbed forest area, Farmland
and Secondary forest, for the purpose of this study. According to (Sutherland 2009), the line transects
method was used to collect data on bird species diversity and abundance in the study area. In all of 60
transect lines were randomly placed, measuring 1000 m. Each transect was divided into 200 m sections
with each block having 20 transects randomly placed. The program GPS 2011 Utility (GPSU 2012) was
used to locate the starting and ending points of transects. Transect lines were walked three times a week
for three months in both seasons (May, July, and September for the wet season and November, January,
and March for dry season) of the year. The survey was conducted between 0.600hours and 10.00hours
and 1600 hours to 1800 hours; the survey was not conducted beyond 10.00hours in the morning to reduce
daylight effect. Transects were walked at an average speed of one kilometer per hour, depending on the
terrain and the number of bird species recorded. All birds viewed on the ground or in the vegetation, as
well as birds that are flying ahead, were identified and the number in the group recorded. Birds of the
same species within 10m of each other were counted in the same group. A pair of binoculars with a
magnification 7х 50 was used in the identification of bird species. Distance estimates were obtained by
using a digital range finder. The side of the transect that the bird was recorded was also noted to
16Francis, 2021 Scientific Reports in Life Sciences 2(1): 13-28
calculate the distance, for groups made up separately recorded individuals which may have been on
different sides of the transect. If birds were in a tight group or recordings were to be made, the distance to
the centre of the group was taken. Physical features of birds sighted but could not be identified
immediately were taken and field guide book of West African birds (Burrow and Demey 2011) was used
to identify the bird species and bird calls was used to confirmed the presence of nocturnal bird species
within the study sites. Data was collected for six months three months in the dry season (November,
February and March) and three months in the wet season (June, August, and September) in 2014 From
the data collected, avian species diversity was calculated using Shannon diversity index, (Usher 1991)
which is given as:
Hi = - Σ Pi In Pi
Where: Hi = diversity index
Pi = is the proportion of the ith species in the sample
InPi = is the natural logarithm of the species proportion.
Species Relative Population Density
The relative population density of bird species at various sites and seasons were determined as outlined
by Bibby et al. (1992) as follows:
D = n1 + n2Loge[n1 + n2]
πr2m n2
where: D = density
r = radius of the first zone
n1 = number of birds counted within zone
n2 = number of birds counted beyond zone and m = number of replicate counts in such area.
Habitat analysis
The quadrant method (Ogunjiemitie et al. 2005) was used to determine plant species composition. This
method involves a total enumeration count (TEC) of all trees above 1m in height and Basal area of not
less than 10cm from 25×25m2 quadrant sample plot, which was randomly selected through balloting from
each sampling compartments. Three out of the 16 quadrants were randomly selected through balloting in
each of the 5 sampling compartments giving 15 plots of a dimension of 25×25m2. The following data was
collected within each sampling quadrant. They include, the mean height of 22m and above was
considered Tall Emergent Tree, 11m to 21m Middle layer and 1m to 10m Understorey. The tree species
classification into different strata layers was carried using (Longman and Jennik 1987).
i Total enumeration of all trees above 1m height and basal area ≥10cm.
ii Total enumerations of all the tree species (s) and family to which they belong.
iii The diameter of all the plants above 1m in height ≥10cm.
Statistical Analysis
The field survey data were entered into Excel (version 15) spreadsheet prior to both descriptive (tables,
frequency, and percentage frequency, graph, pie, and bar charts) and analytical statistics. Variables. Test
17Francis, 2021 Scientific Reports in Life Sciences 2(1): 13-28
of homogeneity for the effect of logging and farming on the bird diversity was carried out using PAST
Model.
Results
The result obtained from the research study indicates that the study area supports the diversity and
abundance of birdlife. A total of 143 bird species belonging to 43 families and 18 orders were recorded in
the study area. The Unlogged compartment has 47% of bird species, which is the highest in the study
area, the logged compartment has 31%, and the Farmland has 22% bird species, which is the lowest in
the study area (Figure 2). A total of 1131 individual bird species were recorded in the study area, and
Farmland has the highest individual bird species (496) while Unlogged compartment has the lowest 274
individual bird species in the study area (Figure 3). The family composition result indicates that
cuculidae has the highest number of bird species, klass cuckoo, and Dusky Long-Tailed and Jacobin
Cuckoo have the highest frequency of occurrence during the study (Figure 4). The result of the diversity
index indicates that it was higher in the unlogged compartment (4.406) than the rest other two
compartments than the compartments Logged (3.341) and Farmland 2.962) Table 1. A total of 117 tree
species were enumerated in the study area, Ficus exasperata had the highest DBH, while Ceiba
pentandra has the highest mean height. Alchornea oppositifolia has the highest frequency of occurrence
in the study area (Table 2). The land use impact on the bird species in linear regression is shown in
Figure 6. The forest layers obtained show that the understory has the number of tree species (60), the
middle layer 37 tree species, and Tall emergent layer 11 Figure 7. The result of bird species' habitat
specialization in the study area indicates that understory has 64 bird species, wetland 11, Grassland 14,
Middle layer 37, and tall emergent 17 bird species Figure 8. A checklist of the bird species in the study
area is shown in Table 3
22% Unlooged
47%
Logged
31%
Farmland
Figure 2: Percentage of bird Species in each Compartment
18Francis, 2021 Scientific Reports in Life Sciences 2(1): 13-28
269
227
185 176
Individual bird speciesl
150
124
Dry Season
Wet Season
Unlogged Logged Area Farmland
Area
Compartments
Figure 3: Individual Bird Species in Each Compartment
12
12
10 9 9
8
8 7
Numbers
6 6 6
6 5 5 5
4 4
4 3 3 3 3 3 3 3 3
2 2 2 2 2 2 2 2 2 2
2 1 1 1 1 1 1 1 1
0
Family Composition
Figure 4: Family composition in the study area
Table 1: Diversity index of bird species in the study area
Diversity Index Unlogged Lower Upper Logged Lower Upper Farmlands Lower Upper
Taxa_S 92 90 92 46 44 46 22 21 22
Individuals 272 272 272 175 175 175 49 49 49
Dominance_D 0.01349 0.01422 0.01698 0.02609 0.02753 0.03491 0.05789 0.05539 0.08205
Shannon_H 4.406 4.278 4.371 3.732 3.558 3.694 2.962 2.775 2.985
Evenness_e^H/S 0.8905 0.7901 0.8634 0.9075 0.7753 0.8785 0.8787 0.7505 0.9008
Brillouin 3.934 3.826 3.906 3.341 3.192 3.309 2.436 2.286 2.455
Margalef 16.23 15.88 16.23 8.713 8.326 8.713 5.396 5.139 5.396
19Francis, 2021 Scientific Reports in Life Sciences 2(1): 13-28
Equitability_J 0.9744 0.9478 0.9675 0.9747 0.9334 0.966 0.9582 0.9065 0.966
Fisher_alpha 48.9 46.99 48.9 20.33 18.9 20.33 15.35 13.92 15.35
Berger-Parker 0.02574 0.02574 0.04779 0.04571 0.04571 0.08571 0.102 0.08163 0.1837
17
15
N
u
m 10 10
b
e 8
r
s 5
4 4 4
3 3 3 3
2 2 2 2 2 2
1 1 1 1 1 1 1 1 1 1 1 1 1 1 1
Plant Species Composition
Figure 5: Plant species composition in the study area
Table 2: Checklist of Plant species in the study area
DBH Mean height
Name of Tree species Family Frequency
(cm) (m)
Afrolicania elaeosperma Rosaceae 21 12 1
Alchornea cordifolia Euphorbiaceae 22 14 8
Alchornea oppositifolia Euphorbiaceae 23 16 11
Alstonia congensis Anacardiaceae 24 14 4
Anacardium occidentale Annonaceae 12 21 2
Anonidium friesianum Loganiaceae 13 21 3
20Francis, 2021 Scientific Reports in Life Sciences 2(1): 13-28
Anthocleista congonesis Loganiaceae 23 18 4
Anthocleista nobilis Loganiaceae 34 19 3
Anthocleista vogelii Loganiaceae 23 21 4
Anthonotha macrophylla Euphorbiaceae 45 22 5
Anthostema aubryanum Moraceae 22 13 6
Artocarpus communis Avicennaceae 32 17 7
Avicennia germinans Meliaceae 21 15 5
Azadirachta indica Balanitaceae 24 17 4
Balanites wilsoniana Passifloraceae 23 15 7
Barteria nigritiana Fabaceae 34 16 4
Bauhinia monandra Fabaceae 30 23 3
Beilschmiedia mannii Lauraceae 34 16 4
Beilschmiedia gaboonensis Lauraceae 29 21 2
Beilschmiedia talbotiae Sapindaceae 26 29 1
Blighia sapida Bombacaceae 23 14 2
Bombax buonopozense Euphorbiaceae 24 13 4
Bridelia micrantha Calophyllaceae 23 12 2
Calophyllum inophyllum Samydaceae 23 15 3
Casearia barteri Casuarinaceae 23 29 2
Casuarina equisetifolia Bombacaceae 34 14 2
Ceiba pentandra Rutaceae 334 36 1
Chrysobalanus atacorensis Rutaceae 22 12 2
Chrysobalanus ellipticus Chrysophylloideae 34 11 3
Chrysophyllum albidum Rutaceae 19 10 1
Citrus sinensis Annonaceae 31 8 3
Cleistopholis patens Arecaceae 13 9 2
Cocos nucifer Sterculiaceae 14 8 1
Cola gigantea Sterculiaceae 280 39 32
Cola nitida Boraginaceae 17 8 3
Cordia abyssinica Boraginaceae 12 9 2
Ctenolophon englerianus Ctenolophonaceae 11 8 1
Ctenolophon englerianus Ctenolophonaceae 14 10 2
Ctenolophon englerianus Lecythidaceae 21 11 4
Crateranthus talbotii Fabaceae 12 9 1
Continuted table 2: Checklist of plant species in the study area
DBH Mean
Name of Tree species Family Frequency
(cm) Height(m)
Delonix regia Fabaceae 23 31 3
Dialium guineensis Fabaceae 34 12 4
Dissomeria crenata Euphorbiaceae 33 12 1
Drypetes principum Arecaceae 32 33 2
Elaeis guineensis Fabaceae 36 21 1
Erythrina senegalensis Myrtaceae 39 31 2
21Francis, 2021 Scientific Reports in Life Sciences 2(1): 13-28
Eugenia malaccensis Moraceae 40 22 3
Ficus congoensis Moraceae 34 11 3
Ficus exasperata Moraceae 336 35 3
Ficus sycomorus Moraceae 22 11 4
Funtumia elastic Tiliaceae 34 17 3
Grewia coriacea Malvaceae 29 35 2
Holarrhena floribunda Euphorbiaceae 28 12 4
Hura crepitans Rosaceae 18 11 2
Hymenocardia heudelotii Samydaceae 17 13 1
Homalium molle Samydaceae 21 14 1
Homalium africanum Flacourtiacea 21 11 1
Icacina trichantha Bignonaceae 21 12 2
Jacaranda mimosifolia Bignonaceae 21 12 2
Keayodendron bridelioides Phyllanthaceae 37 21 2
Lagerstroemia speciosa Lythraceae 28 11 3
Laguncularia racemosa Flacourtiaceae 22 12 1
Lindackeria dentata Euphorbiaceae 26 13 4
Macaranga barteri Euphorbiaceae 29 14 2
Macaranga heudelotii Euphorbiaceae 30 13 1
Maesobotrya barteri Anacardiaceae 23 13 2
Mangifera indica Moraceae 27 31 1
Milicia excelsa Fabaceae 81 34 2
Millettia thonningii Rubiaceae 33 27 3
Morinda lucida Moraceae 35 16 1
Musanga cecropioides Moraceae 37 33 2
Myrianthus preussi Moraceae 38 35 1
Myrianthus arboreus Lecythidaceae 31 13 2
Napoleona vogelii Euphorbiaceae 34 12 1
Neoboutonia velutina Annonaceae 30 23 3
Neostenanthera myristicifolia Sterculiaceae 36 16 1
Nesogordonia papaverifera Bignonaceae 41 15 2
Newbouldia laevis Bignonaceae 44 27 2
Ochna multiflora Ochnaceae 31 22 1
Ouratea calantha Rosaceae 34 15 2
Continuted table 2: Checklist of plant species in the study area
DBH Mean
Name of Tree species Family Frequency
(cm) Height(m)
Parinari congensis Rosaceae 31 17 1
Parinari robusta Fabaceae 24 13 2
Peltophorum pterocarpum Fabaceae 21 15 1
Pentadesma butyracea Lauraceae 23 12 2
Persea americana Arecaceae 22 11 1
Phoenix reclinata Arecaceae 21 14 3
22Francis, 2021 Scientific Reports in Life Sciences 2(1): 13-28
Phyllanthus pbysocarpus Fabaceae 26 14 3
Piptostigma pilosum Oliv Fabaceae 10 9 3
Pithecelobium dulce Fabaceae 12 9 2
Plagiostyles africana Myrtaceae 7 10 1
Psidium guajava L Annonaceae 6 4 2
Polyalthia oliveri Arecaceae 13 11 3
Raphia hookeri Apocynaceae 11 9 3
Rauvolfia vomitora Arecaceae 10 8 2
Roystonea oleraceae Arecaceae 21 9 1
Sacoglottis gabonensis Flacourtiaceae 14 9 3
Scottellia mimfiensis Fabaceae 16 8 2
Senna alata Fabaceae 12 7 2
Senna fistula Passifloraceae 25 11 3
Smeathmannia pubescens Fabaceae 12 7 3
Senna siamea Euphorbiaceae 16 9 1
Spondianthus preussii Anacardiaceae 27 12 2
Spondias mombin Sterculiaceae 29 11 2
Sterculia tragacantha Guttiferae 23 12 3
Symphonia globulifera Myrtaceae 24 10 2
Syzygium rowlandii Bignonaceae 25 11 1
Tabebuia rosea Moraceae 34 12 2
Treculia africana Euphorbiaceae 27 11 1
Triumfetta cordifolia Euphorbiaceae 23 10 2
Uapaca esculenta Euphorbiaceae 29 12 7
Uapaca heudelotii Euphorbiaceae 29 12 2
Uapaca paludosa Euphorbiaceae 27 15 3
Uapaca vanhouttei Euphorbiaceae 28 15 17
Urena lobate Annonaceae 28 21 2
Uvariastrum insculptum Annonaceae 27 16 1
Xylopia rubescens Annonaceae 24 8 4
Xylopia stauditii Annonaceae 29 11 2
23Francis, 2021 Scientific Reports in Life Sciences 2(1): 13-28
18
16
14
B 12
10
8
6
4
2
0
0 2 4 6 8 10 12 14 16 18
A
Figure 6: Bird species diversity in the study area (generalized linear model)
60
37
Numbers
11
Tall Emergent Middle Layer Understorey
Forest Layers
Figure 7: Forest layers in the Study Area
24Francis, 2021 Scientific Reports in Life Sciences 2(1): 13-28
Numbers
64
Numbers
31
17 14 11
Habitat Specialization
Figure 8: Habitat Specialization of Bird Species in the Study Area
Discussion
Our study showed that species diversity and richness of bird species in the study area were adversely
affected by forest modification and land use. The result obtained bird species recorded in the undisturbed
forest was higher than the rest two compartments, Fallow Area and the Farmland. The observed change
in the species richness of several bird groups along the habitat gradient is remarkable because influences
farms and deforestation in the study were large compared to the undisturbed area. This is consistent with
(Petit and Petit 2003) that understory dwelling rather than canopy or edge-dwelling habit, specialized
foraging strategies, and restricted geographic range could be responsible for this observation. Waltert et
al. (2004) identified general characteristics of forest species sensitive to deforestation and land use, in
addition, they suggested that resident birds, in contrast to nonbreeding visitors, mainly prefer forest
habitats. Lindell et al. (2004) reported that resident forest species are often behaviorally inhibited from
entering the open agricultural land, functioning as a barrier for dispersal. The Fallow compartment has
fewer bird species than the undisturbed forest, which is consistent Turner et al. (1997) that secondary
forest have a less complex vegetation structure and a lower species richness of larger trees compared to
the near-primary forest (Turner et al. 1997), which in turn could lead to reduced variability in foraging
substrates.
Indeed, the tree diameter distribution and mean high of tree species in the study sites showed that larger
trees of certain size classes were reduced in the secondary forest sites than a primary forest, and the
architecture of secondary forests was possibly more homogeneous than near-primary forest. The relative
abundance of avian species in the study area was higher in the Farmland than in the rest study sites. This
agrees with Kormar (2006) previous work, which also reported a high abundance of bird species in
cultivated areas, which could be due to food availability. This is also consistent with the result obtained
by Best et al.(1990) that the extent of change in bird species composition and abundance depends on the
specificity of each bird species habitat requirement; in other words, the species tolerance to changes to its
environment. Species with the restricted habitat changes pattern are more vulnerable to changes in land-
use practices than those occupying a wider variety of environments. From the result of diversity bird
25Francis, 2021 Scientific Reports in Life Sciences 2(1): 13-28
species, it was higher in the Unlogged Area (4.406) than the rest other two compartments logged Area
(3.906) and Farmland (2.962). This result is supported by the previous work where (Kangah- Kesse et al.,
(2008), who surveyed bird diversity in Abiriw sacred grove in Eastern Ghana and used the Shannon
diversity index, recorded a value of 4.46 for the woods near the primary forest and 3.36 for the
surrounding cultivated areas. The Undisturbed Area is a primary forest with three strata layers, bird
species that utilize tall emergence trees such the (Black and White Casqued Hornbill and Great Blue
Turaco) were encountered and bird species that utilize understory such as the (Little Greenbul, Common
Bulbul, White-Tailed Aletheetc.) were also sighted. This is consistent with MacArthur and MacArthur
(2001), who reported that diversity increases with the vegetation number. Pearson (2001) reported that
tropical wet evergreen forest supports more rare bird species than other habitats. Manu (2000) reported
that birds select vegetation variables according to how an individual habitat affects access to food, mates
or its vulnerability to predators. This is also in agreement with the report that altering habitats and
changing population structure affects the avian population. The result also revealed the Shannon diversity
index values, showing that there was no significant difference in bird species diversity between Farmland
and Fallow Area; this is expected presumably because of the edge effect in farmland area. Previous
studies support this; edge effects are described to be remarkably diverse, ranging from changes in species
abundance (Manu, et al. 2007). Bird species are important indicators of environmental quality and
ecological functionality. In this study, we provided data on the response of bird species to certain
structural attributes of a natural forest, such as the presence of mature and heterogeneous forest stands
(high level of DBH). This study shows that the Undisturbed Forest Area near the primary forest is the
best habitats for the birds as far as the numbers and diversity are concerned. As the most severe loss of
the biodiversity value occurs in the transformation of original landscapes to croplands due to human
interference (Keith et al. 1992). Reduction in habitats quality is thought to be the main underlying causes
of the declines in most farmland bird species (Newton 2004)
In the farmlands, we have few trees and less (DBH) resulting in the decline of bird species abundance
and richness. This is supported by previous work of Donald et al. (2006) reported that the conversion of
greater areas of land to farming has reduced habitat heterogeneity and led to reductions in species
richness and declines in bird species which were once common forest species.
Conclusion
Bird species diversity was higher in the Undisturbed forest Area than the Fallow area and Farmland
within the study area, which suggests that land-use change between the three blocks was responsible for
this. Large settlement camps are springing up in the study area, and these people are involved in
logging, majorly cutting down commercial timber species such as Ceiba pentandra, Alstonia congensis
Cola gigantea, Daniella ogea; farming intensification is ongoing in the area, and compartments have
been cleaved for the cultivation of cocoa and plantain farms. Government official allocates blocks to
timber loggers without proper monitoring, and poaching is ongoing too. Deforestation and settlements by
the local people should be discouraged. The sustainable harvest of tree species in this area should be
managed appropriately to support avian habitats. Land conversion for agricultural purposes is very high
in this region since most of the communities are agrarian. However, this may increase extinction risk for
many threatened and endangered birds in the area, such as African Grey parrot, Black Casqued Hornbill,,
26Francis, 2021 Scientific Reports in Life Sciences 2(1): 13-28
Great Blue Turaco and Crested Guinea fowl. The management of these areas should design programs to
discourage bush burning, livestock grazing, deforestation, and illegal farming in the forest area.
As a result of urban settlement catching up with the study area from all directions, it is like an Island in
trouble. This is why the management of this Ehor forest reserve should seek assistance from other
conservation agencies that should come up with technical assistance that will further impact the
management of the forest block within the study area.
Acknowledgments
The authors are very grateful to the Staff and Management of Edo State Ministry of Agriculture and
Natural Resources and especially the Director of Forestry Department for their support during the study.
References
Best L.B., Whitmore R.C., Booth G.M. 1990. Use of cornfields by birds during the breeding season: the
importance of edge habitat. American Midland Naturalist 123: 84-99.
Borrow N., Demey R. 20012. A guide to the birds of western Africa. New Jersey, United States:
Princeton University Press.
Donald P.F., Sanderson F.J., Burfield I.J., van Bommel F.P.J. 2006. Further evidence of Continent-wide
impacts of agricultural intensification on European farmland birds, 1990-2000. Agriculture Ecosystems
& Environment 116: 189-196.
Fuller R.J., Gregory R.D., Gibbons D.W., Marchant J.H., Wilson J.D., Baillie S.R., Carter N. 1996.
Population declines and range contractions among lowland farm birds in Britain. Conservation Biology
9: 1425-1441.
GPSU. 1998-2005. GPS Utility Version 4.20.0
Harris R. J., Reed J.M. 2002. Behavioural barriers to non-migratory movements of birds. Annales
Zoologici Fennici 39:275–290.
Ikemeh. 2009. Status Survey of the Idanre Forest Reserve: A February 2009 Survey. Report to the A.G.
Leventis Foundation, Liechtenstein, the Nigerian Conservation Foundation, Lagos, and the Ondo State
Government, Nigeria.
Ibiyomi M.O. 2010. Abundance and distribution of Black and White Colobus monkey in Old Oyo
National Park, Unpublished PGD Thesis in The Department of Ecotourism and Wildlife Management,
The Federal University of Technology, Akure (FUTA), Nigeria.
Isichei. 1995. Omo Biosphere Reserve, Current Status, Utilization of Biological Resources and
Sustainable Management (Nigeria). Working Papers of the South-South Cooperation Programme on
Environmentally Sound Socio-Economic Development in the Humid Tropics. UNESCO, Paris.
Kangah-Kesse D. K. Attuquayefio E. H. Owusu., Gbogbo, F. 2008. Bird species diversity and abundance
in the abiriw sacred grove in the Eastern region of Ghana. West African Journal of Applied Ecology 11:
41–50.
Keay R.W.J. 1989. Trees of Nigeria. A review version of Nigerian trees (1960, 1964) by R. WJ Keay, C.
F. A Onochie and D. P Strandfield: Claridon Press Oxford University press
27Francis, 2021 Scientific Reports in Life Sciences 2(1): 13-28
Komar O. 2006. Ecology and conservation of birds in coffee plantations: a., critical review. Bird
Conservation International 16:1-23
Koyenikan I.O. 2004. Impact of human activities on the primates of Okomu National
Park, Edo State, Nigeria. (Unpublished master’s thesis). Federal University of Technology, Akure,
Nigeria.
Luiselli L., Amori G., Akani G. C., Eniang, E. A. 2015. Ecological diversity, community structure and
conservation of Niger Delta mammals. Biodiversity and Conservation, 24(11): 2809-2830.
Lugo A. E. 1988. Estimating reductions in the diversity of tropical forest species. Pages 58–70 in E. O.
Wilson, editor. Biodiversity. National Academy of Sciences Press, Wash- ington, D.C., USA.
MacArthur R. H. and MacArthur J. W. 1999. On bird species diversity. Ecology 42, 594 - 598.
Manu S.A. 2000 Effects of habitat fragmentation on the distribution of forest birds in south western
Nigeria with particular reference to the Ibadan Malimbes and other Malimbes, PhD thesis. University of
Oxford.
Manu S., Peach W., Cresswell W. 2007. The effects of edge, fragments West Africa. Ibis 149:287-297.
Newton I. 2004. The recent declines of farmland bird populations in Britain: an appraisal of causal
factors and conservation actions. Ibis 146: 579-600
Oates J.F., Gippoliti S., Groves C.P. 2008. Cercocebus torquatus. The IUCN Red List of Threatened
Species. Version 2015.2. . Downloaded on 08 August 2015.
Ogunjemite BG, Afolayan T.A., Agbelusi E.A. 2005. Habitat Structure of Chimpanzee Community in
Ise Forest Reserve, Ekiti State, South-western Nigeria, African Journal of Ecology 43, 396 -399.
Sutherland W.J. 2009. From Individual Behavior to Population Ecology. Oxford: Oxford University
Press
Thiollay J.M. 1995. The role of traditional agroforests in the conservation of rain forest bird diversity in
Sumatra. Conservation Biology 9:335–353
Turner I. M., Wong Y. K., Chew P. T., bin Ibrahim A. 1997. Tree species richness in primary and old
secondary tropical forest in Singapore. Biodiversity and Conservation 6:537–543.
Waltert M., Mardiastuti A., Mu¨hlenberg M. 2004. Ef- fects of land use on bird species richness in
Sulawesi, In- donesia. Conservation Biology 18:1339–1346. White, F. 1983. The vegetation of Africa.
Paris: UNESCO.
Were. 2001. Nigerian Lowland Ecoregion, Wild World Report, www.worldwildlife.org
Saj T., Sicotte P. 2013. Colobus vellerosus, White-thighed colobus (Geoffroy's Pied colobus, Ursine
Colobus). In Kingdon J., Happold D., Butynski T., Hoffmann M., Happold M., Kalina J., (Eds.),
Mammals of Africa. Vol. II Primates (pp. 109-111). London: Bloomsbury Publishing.
Ajiboye A. 2012. Assessment of Aesthetic Valeus of Old Oyo National Park. American ournal of
Tourism Management 1(3): 69-77.
Alarape A. 2002. Culture and Conservation in and around Old Oyo National Park. PhD Thesis,
University of Ibadan.
Baker L. R., Tanimola A. A., Olubode O. Oates J.F., Gippoliti, S., Groves C.P. 2008d. Procolobus verus.
In: IUCN 2013. IUCN Red List of Threatened Species. Version 2013.2. www.iucnredlist.org. Accessed
January 28, 2014.
28Francis, 2021 Scientific Reports in Life Sciences 2(1): 13-28
Oates J.F., Gippoliti S., Groves C.P. 2008e. Cercocebus torquatus. The IUCN Red List of Threatened
Species. Version 2015.2. . Downloaded on 08 August 2015.
Ogunjemite B.G., Afolayan T.A., Agbelusi E.A. 2005. Habitat Structure of Chimpanzee Community in
Ise Forest Reserve, Ekiti State, South-western Nigeria. African Journal of Ecology 43: 396 -399.
Ogunsesan D., Oyedepo J., Oates J., Adeofun C. O., Ikemeh R., Bergl R. 2012. GIS-Supported Survey of
Low-Land Rain Forests in South-Western Nigeria. COLERM Proceedings 1: 141-154.
Oksanen J., Blanchet F.G., Kindt R., Legendre P., Minchin P. R., O’Hara R. Gavin L., Simpson Solymos
P., Henry M., Stevens H., Wagner H. 2013. Package vegan R Packag ver, 254, 20-8.
29You can also read


