PAPAKURA LOCAL BOARD ECONOMIC OVERVIEW - AUCKLAND ECONOMIC OVERVIEWS - Knowledge Auckland
←
→
Page content transcription
If your browser does not render page correctly, please read the page content below
MARCH 2020
AUCKLAND ECONOMIC OVERVIEWS

PAPAKURA
──
LOCAL BOARD ECONOMIC
OVERVIEW

aucklandnz.com/business

                              a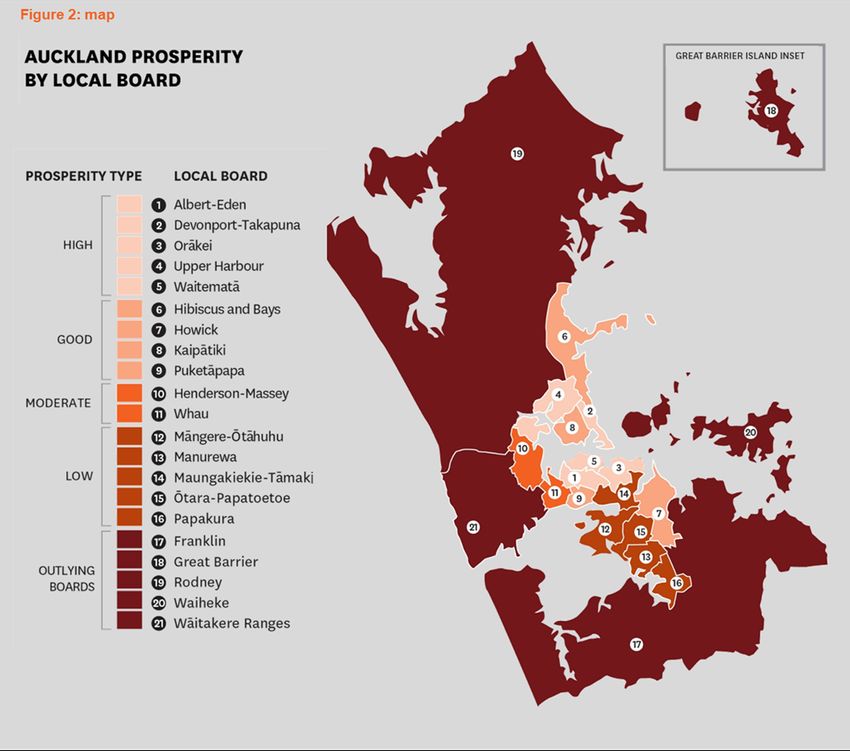
2   | Papakura Local Economic Overview 2019

2   | Document Title – even page header
                                              Contents

                                                1          Introduction

                                                2          People and Households

                                                3          Skills

                                                4          Local Economy

                                                5          Employment Zones

                                                6          Development trends

                                                7          Economic Development Opportunities

                                                8          Glossary

                                          aucklandnz.com/business
3
Introduction 3 | Document Title – even page header
What is local economic development
ATEED’s goal is to support the creation of quality jobs for all Aucklanders and while
Auckland’s economy has grown in recent years, the benefits of that growth are not
distributed evenly.
Local economic development brings together a range of players to build up the economic
capacity of a local area and improve its economic future and quality of life for individuals,
families and communities.
Auckland’s economic development
Auckland has a diverse economy. While central Auckland is dominated by financial,
insurance and other professional services, parts of south and west Auckland have
strengths in a range of manufacturing industries.
In other areas, tourism is a key driver and provides a lot of local employment while there
are also areas that are primarily residential where residents commute to the city centre or
one of the industrial precincts for employment. The Auckland region also has a
significant primary sector in the large rural areas to the north and south of the region.
The Auckland Growth Monitor1 and Auckland Index2 tell the story behind Auckland’s
recent economic growth.
While annual GDP growth of 4.3 per cent per year over the last five years is encouraging,
we want our economy to be more heavily weighted towards industries that create better
quality jobs and generate export earnings. To support this goal ATEED has a role in
promoting the adoption of new technologies and innovation across the economy and at
the same time attracting investment and supporting sectors such as screen, the visitor
economy and international education that bring in revenues from overseas.
Although there is still a need to attract and retain larger employers to the city, helping
local economies to grow requires an enhanced focus on existing small businesses which
make up 97 per cent of all Auckland businesses. Businesses can be supported by raising
their capability, encouraging business networking, connecting them to talent and
facilitating access to export markets. ATEED help provide access to a range of business
support programmes for established businesses that are looking for help in order to grow.
There is also a need to continue to support entrepreneurship and business start-ups,
particularly in less prosperous parts of the region.
In 2018 ATEED produced the Auckland Prosperity Index3, which highlighted how different
parts of the region have felt the benefits of Auckland’s continued economic growth. This
has shaped the approach we have been asked to take in the region, focusing on those
activities and industry sectors that will have the greatest impact on increasing investment
in quality jobs – particularly where Auckland’s south and west can benefit.
1 https://www.aucklandnz.com/business-and-investment/economy-and-sectors/auckland-growth-monitor
2 The Auckland Index can be found at aucklandnz.com/auckland-index
3 https://www.aucklandnz.com/business-and-investment/economy-and-sectors/market-news-and-
trends/growing-prosperity-for-all-aucklanders
aucklandnz.com4 | Papakura Local Economic Overview 2019
4 The role of local boards
| Document Title – even page header
At the local level ATEED works with local boards to support several areas of work:
• Growing local businesses through a range of initiatives to support start-ups and
small and medium sized enterprises across the region
• Place based initiatives either working with Auckland’s regeneration agency Panuku
Development Auckland in its ‘Transform and Unlock’ areas as well as with smaller
locally driven place-based initiatives
• Business environmental sustainability initiatives and the promotion of waste-
minimisation and circular economy opportunities
• Providing economic intelligence: enhancing the evidence base and advice provided
by ATEED at a local level. To provide a better understanding of the drivers of
prosperity in a local area. While also providing the justification for the projects and
initiatives delivered by the team.
Local boards have a mandate to advocate for and fund a range of activities on behalf of
their local communities. The local boards of Auckland Council want thriving town centres
and access to employment opportunities in their communities and when opportunities lie
elsewhere, transport solutions so residents can easily access those opportunities. Local
boards are in a unique position to understand their local economy, work with the local
business community and advocate or catalyse activities for local economic development.
Through their advocacy role as well as through their empowering communities and locally
driven initiatives budgets Local boards can play a role in a range of ways. They can
support:
• ‘Places’ by supporting the town centres and business associations that provide
much of their local employment or working with Panuku Development Auckland
and ATEED to regenerate their town centres and attract investment and jobs
• ‘People’ through support for community organisations that work with people
distant from the labour market, they can support skills development for young
people through a range of programmes like the Young Enterprise Scheme
• The business community programmes like the PopUp Business School that fill
gaps where mainstream services don’t meet community need
• The sustainability of their local economies by helping promote business
environmental sustainability and waste minimisation.
What is the Papakura local economic development overview?
This economic development overview of the Papakura Local Board area looks at:
• a range of indicators on Papakura’s economy
• the drivers, trends and linkages that influence the local economy
• major private and public initiatives that will impact on the economy in Papakura
• opportunities and issues to growing business and jobs in Papakura
The economic development overview can be the first stage in guiding local boards as to
what the key issues are in their area and where the local board should focus its efforts
when considering the outcomes it would like to include in the 2020 Local Board Plan.Papakura Local Board
Economic Overview 2019
Summary
Papakura is a relatively less prosperous local board area with high levels of employment in occupations such
as manufacturing, health and retail. The area has seen recent rapid growth creating further employment
opportunities. It is important that local people are supported to access the opportunities this growth brings.
Population growth Population
Population growth has been higher than the regional average over the 2013-2018 Census growth 2013-2018
period. The area predominantly has a New Zealand European population with sizeable Indian
26.3%
and Māori communities.
Papakura
Unemployment rate
Unemployment has been relatively high compared to the regional average over the last 11.0%
five years.
Auckland
Significant employers Jobs in Knowledge
Education, construction and healthcare are the main employment sectors. Wholesale trade, Intensive Industries
professional services and accommodation & food are also significant employers. Together
these six sectors provide almost 40 per cent of local employment. 18.0%
Papakura
Local employment opportunities
Over the five years 2013-2018, the fastest growing industries by GDP in the local board area 39.0%
were wholesale trade, administrative & support services and transport postal & warehousing.
Auckland
School leavers
Education attainment moving on to degree
Educational attainment is average; however, a much lower proportion of school leavers move level study (2018)
on to degree level study upon leaving high school.
26.3%
Residential developments Papakura
The Unitary Plan, along with the Auckland Plan, provides the policy framework by which
development is enabled and assessed. Under this framework the area likely to see residential
42.0%
developments with Papakura town a development area identified in the Auckland Plan.
Auckland
LOCAL BOARD ASPIRATIONS
In its current Local Board Plan the Papakura Local Board seeks to ensure that Papakura has a strong local economy
and that Papakura town centre itself is vibrant and prosperous. The local board’s vision is for more people with higher
education achievements to gain well-paid employment and working locally.
KEY OPPORTUNITIES
Opportunity for a strong local economy. Papakura has a diverse local economy with some large, well-known companies
located in the area. The growing population will attract more businesses to the area. It is important to ensure that
residents, especially the area’s young people, have the skills to find employment in the new jobs that will be created.
KEY CHALLENGES
Papakura residents perform below average in terms of education and skills acquisition. Papakura also has a rapidly
growing population yet local employment opportuntiies are limited and many have to commute elsewhere for work.
Meeting the increased demand for local employment opportunties and ensuring access to other nearby employment
zones will be a key challenge.
aucklandnz.com6 | Papakura Local Economic Overview 2019
6
People and Households
| Document Title – even page header
Papakura is one of Auckland’s least populous local board areas
with a population of 57,636 that is forecast to increase to
80,600 by 2038. Papkura was Auckland’s fastest growing local
board area between the 2013 and 2018 Censuses.
The Auckland Prosperity Index report showed Papakura school leavers have low
educational attainment. The area has a diverse industrial mix but jobs tend to require low
to medium skills. This limits household income levels. The area also has a low ratio of
jobs to residents meaning most people have to commute elsewhere for employment.
Papakura Auckland / Share of
Auckland
Population (2018) 57,636 3.7%
Population growth (2013-2018) 26.3% 11.0%
Median Age (2018) 32.1 34.8
Labour force (2018) 30,800 876,100
Labour force participation (2018) 70% 71%
Home ownership (2018) 45% 45%
Population
The Papakura Local Board area has experienced rapid population growth in recent years
with new housing developments driving population growth.
POPULATION GROWTH (2013-2018) MEDIAN AGE (CENSUS 2018)
34.8
26.3% 32.1
years years
11.0%
Papakura Auckland Auckland Papakura
Between the 2013 and 2018 censuses population growth was 26.3 per cent compared
to 11 per cent regionally. This made Papakura the fastest growing local board area in the7
region. Medium population projections4 suggest that7 Papakura could
| Document Title –be home
even to 80,600
page header
residents by 2038, an increase of 23,000 residents.
Papakura has a lower median age than the region, and its working age population is
slightly smaller than the regional average. There are proportionately more young people
in Papakura compared to the region.
AGE STRUCTURE (CENSUS 2018)
Under 15 24% Source: Census
years 20% 2018
23%
15-29 years
23%
43%
30-64 years
45%
65 years 11%
and over 12%
Papakura Auckland
Ethnicity
Papakura’s population is predominantly of European ethnicity (49 per cent). Māori make
up 27 per cent of the population which is more than double the proportion across the
region. There are also significant Indian and Samoan populations.
ETHNIC MAKE-UP (CENSUS 2018)
Other ethnicity 1%
1%
Middle Eastern/Latin American/African 2%
2%
Asian 23%
28%
Pacific Peoples 17%
16%
Maori 27%
12%
European 49%
54%
0% 10% 20% 30% 40% 50% 60%
Papakura Auckland
4
Source: Statistics New Zealand
aucklandnz.com8 | Papakura Local Economic Overview 2019
8 Papakura
| Document Title – even page header has a large proportion of residents born overseas (31 per cent) and 20 per cent
of people born overseas had been in New Zealand less than five years.
Languages
With a diverse population there are a wide range of languages in use in Papakura, with
93 per cent of residents able to speak English the same percentage as Auckland as a
whole.
Labour Force
The labour force participation rate is a measure of an economy's active workforce. A high
participation rate indicates more people in the area are actively engaged in the economy.
The size of the labour force is critical to an area’s ability to produce goods and services.
70%
The labour force participation rate in Papakura is 70 per cent, just below the Auckland
rate (71 per cent).
LABOUR FORCE PARTICIPATION RATE OVER TIME
The labour force 80
participation rate in 71.0%
Papakura was 70 per 70
cent in June 2019, lower
69.6%
than the Auckland rate 60
(71 per cent)
50
40
30
20
Dec-14 Jun-15 Dec-15 Jun-16 Dec-16 Jun-17 Dec-17 Jun-18 Dec-18 Jun-19
Papakura Auckland
The unemployment rate in the 2018 Census5 was 5.3 per cent in the Papakura Local
Board area, higher than the Auckland region unemployment rate of 4.1 per cent.
5 Note the Census based unemployment rate differs from the rate reported by the Household Labour Force
Survey as data collection methods differ and the Census rate is self-reported at the time of completion of the
Census form.9
UNEMPLOYMENT RATE (CENSUS 2018) 9 | Document Title – even page header
5.3%
4.1%
Papakura Auckland
Unemployment measured by the Household Labour Force Survey in Papakura has
remained above the Auckland average over the last five years although the gap has
closed considerably.
UNEMPLOYMENT RATE OVER TIME (HOUSEHOLD LABOUR FORCE SURVEY)
14.0
12.0
10.0
8.0
6.0
4.0
2.0
0.0
Dec-14 Jun-15 Dec-15 Jun-16 Dec-16 Jun-17 Dec-17 Jun-18 Dec-18 Jun-19
Papakura Auckland
Income
Analysis of individual income levels in 2018 shows that there was a lower proportion (15
per cent) of persons earning a high income (over $70,000 per year) in Papakura
compared to the region (20 per cent).
aucklandnz.com10 | Papakura Local Economic Overview 2019
10 INDIVIDUAL
| Document Title – even page header INCOMES (CENSUS 2018)
21%
19% 20%
16% 16% 16%
14% 14% 15% 15%
12%
11%
5% 5%
$5,000 or $5,001 – $10,001 – $20,001 – $30,001 – $50,001 – $70,001 or
less $10,000 $20,000 $30,000 $50,000 $70,000 more
Papakura Auckland
In 2018, 10 per cent of households in Papakura derived self-employment or business
income, above the rate across all Auckland households (14 per cent).
HOME OWNERSHIP (CENSUS 2018)
55% 55%
38%
34%
11%
6%
Hold in a family trust Own or partly own Do not own and do not hold
in a family trust
Papakura Auckland
Home ownership in Papakura is slightly lower than the regional average; in 2018, 44 per
cent of households owned the dwelling they lived in, compared to 45 per cent across
Auckland.11
Skills 11 | Document Title – even page header
Papakura has a less well qualified labour force with a lower
proportion of residents educated to degree level or higher.
Fewer school leavers from Papakura leave with NCEA Level 2 or
NCEA Level 3 and fewer tend to progress from school in to
tertiary education.
Qualifications
A skilled workforce drives a strong and resilient local economy and is critical for
Auckland’s future competitiveness.
The New Zealand Qualifications Framework (NZQF) has ten levels which are based on
complexity, with Level 1 the least complex and Level 10 the most complex. All
qualifications on the NZQF are assigned one of the ten levels and fit into a qualification
type: a certificate (Levels 1-4), diploma (Levels 5-6) or degree (Levels 7-10). Secondary
school qualifications of National Certificates of Educational Achievement (NCEA) are
gained at Levels 1-3.
Achieving a school level qualification significantly improves a school leaver’s employment
prospects and people with higher level qualifications are less likely to experience
unemployment. The unemployment rate fell substantially in 2017 for people with higher-
level qualifications. The rate was 2.4 per cent in 2017 for those with a bachelor’s degree
or postgraduate qualification, down from 2.9 per cent in 2016. For people with no
qualification, the unemployment rate was more than three times larger, at 8.4 per cent.
The unemployment rate for people with a Level 4 to 6 diploma or certificate did not alter
greatly from 2016 to 2017. It was 3.5 per cent in 2017. 6
RESIDENTS’ HIGHEST QUALIFICATIONS (CENSUS 2018)
42%
36%
31%
22%
20%
15%
10% 10%
No Qualification Certificate Level 1-4 Diploma Level 4-6 Bachelor's Degree or
Higher
Papakura Auckland
6https://www.educationcounts.govt.nz/statistics/indicators/main/education-and-learning
outcomes/unemployment_rates_by_highest_qualification
aucklandnz.com12 | Papakura Local Economic Overview 2019
12 In 2018,
| Document Title – even page header 20 per cent of adult residents in Papakura had gained a bachelor’s degree or
higher, a higher proportion than the Auckland region (31 per cent). Twenty-two per cent
of residents had no educational qualifications compared with 15 per cent across the
region7.
NCEA is the national school-leaver qualification and is used as the benchmark for
entrance selection by universities and polytechnics. In 2018, 20 per cent of school
leavers in Papakura did not achieve the standard for NCEA Level 1 compared to 9 per
cent regionally.
In 2018, 32 per cent of school leavers in Papakura did not achieve NCEA Level 2, which
provides the foundation skills required for employment. This is more than the Auckland
average where 16 per cent of school leavers did not achieve NCEA Level 2 or higher.
NCEA – STUDENTS ATTAINING NCEA (2018)
LEVEL 1 LEVEL 2
83.4%
90.6%
79.8% 67.5%
Papakura Auckland Papakura Auckland
NCEA 1 ATTAINMENT BY ETHNICITY (2018)
Percentage achieving NCEA Level 1 Level 2
European 86.8% 76.1%
Māori 65.0% 48.7%
Pacific 68.5% 73.0%
Asian 91.5% 86.8%
Middle East, Latin American, African 100% 90.9%
Other - 80.0%
Total Local Board 79.8% 67.5%
Total Auckland 90.6% 83.4%
NCEA Level 3 is regarded as the minimum level required for university entry. Forty-one
per cent of Papakura school leavers achieved this, lower than the Auckland average of 63
per cent.
7 Highest qualification is derived for people aged 15 years and over13
DESTINATION OF SCHOOL LEAVERS IN THEIR FIRST YEAR
13 | AFTER LEAVING
Document Title – even page header
Certificates & Not enrolled
Bachelor’s Certificates
diplomas in tertiary Total Leavers
and above Levels 1-2
levels 3-7 education
Papakura 26.3% 24.8% 7.1% 41.8% 674
Auckland 42.0% 20.9% 3.1% 34.1% 20,421
SCHOOL LEAVERS MOVING ON TO DEGREE LEVEL STUDY (2018)
42.0%
26.3%
Papakura Auckland
Twenty-six per cent of Papakura school leavers moved on to degree level study within a
year of leaving school, much lower than the Auckland average of 42 per cent. A higher
proportion moved into certificate and diploma level study, but overall fewer (58 per cent)
enrolled in some form of tertiary education than the regional average (66 per cent).
aucklandnz.com14 | Papakura Local Economic Overview 2019
14
Local Economy
| Document Title – even page header
Papakura has a small local economy driven by manufactuirng
and construction and retail also provides many local
employment opportunities. Manufacturing and construction
have contributed the greatest number of new jobs to the area in
the last five years. Papakura has very few jobs in knowledge
intensive industries.
Growth and employment trends
In 2018, GDP in Papakura experienced growth of 4.7 per cent, higher than the growth
rate in Auckland (3.9 per cent). In the five years to 2018 the Papakura economy grew at
an average annual rate of 4.3 per cent, above the 4.2 per cent in the Auckland region.
Employment in Papakura increased by an average of 4.3 per cent per annum in the five
years from 2013-2018, above the Auckland rate of 3.4 per cent. Over the last five years
Papakura job numbers increased the most in manufacturing (+1099 jobs), construction
(+714) and health (+300) sectors.
AVERAGE ANNUAL GDP AND EMPLOYMENT GROWTH (2013-2018) (source Infometrics)
4.3% 4.2% 4.3%
3.4%
$1,625 m $91,665 m 19,992 886,187
jobs
Papakura Auckland Papakura Auckland
Over the five years 2013-2018, the fastest growing industries by GDP in Papakura were
wholesale trade, administrative and support services and transport postal and
warehousing.
FASTEST GROWING INDUSTRIES BY GDP (ANZSIC LEVEL 1) (source Infometrics)
Industry Average p.a. change
Administrative & Support Services 10.4%
Professional, Scientific & Technical Services 8.1%
Transport, Postal & Warehousing 7.3%
Arts & Recreation Services 7.2%
Construction 6.9%
Accommodation & Food Services 6.5%15
Industry mix 15 | Document Title – even page header
Papakura’s future economic performance depends on its combination of a sufficiently
diversified industrial base and clusters of sectors that have the potential to achieve high
rates of productivity and export growth. The main sector with a strong presence in the
Papakura economy are manufacturing, construction and retail.
BROAD INDUSTRY MIX BY GDP (ANZSIC LEVEL 1) (source Infometrics)
Manufacturing 26.8%
9.5%
Construction 13.1%
5.5%
Retail Trade 8.7%
5.2%
Rental, Hiring and Real Estate Services 7.5%
7.9%
Wholesale Trade 7.1%
7.4%
Transport, Postal and Warehousing 6.1%
5.3%
Health Care and Social Assistance 5.7%
5.4%
Professional, Scientific and Technical Services 5.6%
10.1%
Public Administration and Safety 5.2%
2.9%
Education and Training 5.1%
3.9%
Papakura Auckland
• Manufacturing contributed 27 per cent of Papakura’ GDP and provided
22 per cent of the area’s employment.
• Construction contributed 13 per cent of Papakura’ GDP and provided 15
per cent of the area’s employment.
• Retail contributed nine per cent of Papakura’ GDP and provided 12 per
cent of the area’s employment.
• Rental, hiring & real estate contributed eight per cent of Papakura’s GDP
but only provided two per cent of the area’s employment.
aucklandnz.com16 | Papakura Local Economic Overview 2019
16 TOP
| Document Title – even page header INDUSTRIES BY EMPLOYMENT AND GDP (ANZSIC LEVEL 1) (source Infometrics)
GDP Employment
26.8%
Manufacturing
21.5%
13.1%
Construction
15.0%
8.7%
Retail Trade
11.6%
Rental, Hiring and Real Estate 7.5%
Services 2.1%
7.1%
Wholesale Trade
5.3%
6.1%
Transport, Postal and Warehousing
5.4%
Education, construction services and health are the key employment sectors in Papakura.
TOP 10 INDUSTRIES BY EMPLOYMENT– 54 SECTOR CLASSIFICATION (source Infometrics)
Rank Industry Jobs % of Papakura Total
1 Education & Training 1512 7.6%
2 Construction Services 1505 7.5%
3 Health Care & Social Assistance 1422 7.1%
4 Other Store & Non-Store Retailing 1189 5.9%
5 Professional, Scientific & Tech Services 1057 5.3%
6 Wholesale Trade 1055 5.3%
7 Accommodation & Food Services 1041 5.2%
8 Road Transport 945 4.7%
9 Heavy & Civil Engineering Construction 887 4.4%
10 Central Gov Admin, Defence & Safety 859 4.3%
Total top 10 industries 11,472 57.3%
All other industries 8,502 42.7%
Total employment 19,992 Source: Infometrics
Within education, thirty-seven per cent of jobs are in primary education while site
preparation and electrical services are the main types of employment construction sector.
Aged care and also childcare are the two main employment sub-sectors within the
healthcare sector.
Manufacturing and construction have seen the greatest employment growth over the last
five years along with health.17
NEW JOBS BY SECTOR – 54 SECTOR CLASSIFICATION
17 (2013 Title (source
- 2018)
| Document Infometrics)
– even page header
Sector New Jobs
Heavy & Civil Engineering Construction 350
Fabricated Metal Product Manufacturing 263
Health Care & Social Assistance 261
Central Gov Admin, Defence & Safety 257
Road Transport 234
Knowledge-intensive industries
Knowledge intensive industries8 represent an increasing share of the New Zealand
economy's output and employment and may be a source of future productivity growth.
Eighteen per cent of jobs in Papakura are in knowledge intensive industries which is
lower than the regional average of 39 per cent.
JOBS IN KNOWLEDGE INTENSIVE INDUSTRIES (source Infometrics)
Papakura Auckland
18% 39%
Jobs in KI Industries Jobs in non-KI Industries Jobs in KI Industries Jobs in non-KI Industries
Comparative Advantage
A number of sectors are more strongly represented in Papakura than they are in the
region as a whole.
INDUSTRIES CONCENTRATED IN LOCAL BOARD AREA (source Infometrics)
Rank Industry Location GDP
Quotient $M Employees
1 Beverage & Tobacco Product Manufacturing 6.1 81.7 298
2 Non-Metallic Mineral Product Manufacturing 5.6 41.4 308
3 Wood Product Manufacturing 4.1 37.6 443
4 Fabricated Metal Product Manufacturing 3.9 63.2 656
5 Heavy & Civil Engineering Construction 3.6 99.7 887
6 Fruit, Cereal & Other Food Product Manufacturing 3.3 45.6 573
8Knowledge-intensive industries are industries that satisfy two basic criteria: At least 25 per cent of the
workforce must be qualified to degree level and at least 30 per cent of the workforce must be employed in
professional, managerial, as well as scientific and technical occupations.
aucklandnz.com18 | Papakura Local Economic Overview 2019
18 Many
| Document Title – even page header of these are manufacturing sectors such as beverages, mineral products, wood and
metal manufacturing.
ATEED Sectors of Focus
Auckland has developed a core of specialist manufacturing industries and a talented,
globally focused service sector.
These industries and sectors are grouped into advanced industries, tradeable industries
and enabling industries. Together they drive growth and create employment in Auckland
and are of particular interest to ATEED with regards support that can be provided to help
their growth.
Food and beverage and advanced materials are two of the sectors of focus for ATEED
that are well represented in Papakura.
EMPLOYMENT IN ATEED FOCUS SECTOR (2018)
+/- on Papakura
Share of Sector to Total Auckland Papakura
sector
Advanced Materials Related 1.7% 2.8% 70%
Commercial services 21.2% 7.3% -66%
Construction and engineering 11.2% 15.9% 42%
Education 7.6% 7.6% 0%
Food and Beverage 3.5% 9.2% 162%
Screen and creative 6.0% 1.0% -84%
Technology 7.6% 4.8% -37%
Tourism 6.2% 4.8% -22%
Transport and Logistics 2.9% 4.3% 47%
High Skilled Jobs (2018) Occupations 9
Higher skilled jobs offer people an improved standard of living and are a critical
36% component in attracting workers to an area. Statistics NZ allocates occupations to skill
27%
levels based on the range and complexity of tasks performed in a particular job. The skill
level does not relate to the qualifications obtained by an individual, but to the range and
complexity of the tasks they do at work. There is a lower proportion of highly skilled jobs
Papakura Auckland
in Papakura (27 per cent) than there is across Auckland.
9 The 2018 Census provides details of the occupations of residents of the local board area whereas Infometrics
data provides details of occupations within businesses located in the local board area.19
OCCUPATIONS OF PAPAKURA RESIDENTS LIVING IN 19
PAPAKURA (CENSUS
| Document 2018)
Title – even page header
Papakura Auckland
Professionals 18%
26%
Managers 15%
18%
Technicians and Trades Workers 13%
11%
Community and Personal Service Workers 9%
9%
Clerical and Administrative Workers 13%
12%
Sales Workers 11%
10%
Labourers 11%
8%
Machinery Operators and Drivers 11%
6%
Managers and professional occupations were the most popular occupational categories for
Papakura residents in 2018. However, compared to the region, there are a much lower
proportion of workers in professional occupations in Papakura.
Of the jobs in Papakura based businesses, professionals are the largest occupational
group (18 per cent), lower than the Auckland average (26 per cent). There is a larger
proportion of technicians and trades people as well as sales workers than the regional
average.
OCCUPATIONS IN PAPAKURA BASED BUSINESSES BUSINESSES (source: Infometrics)
Papakura Auckland
Professionals 18%
26%
Managers 17%
18%
Technicians and trades workers 16%
13%
Community, personal service workers 10%
9%
Clerical and administrative workers 9%
12%
Sales workers 12%
10%
Labourers 10%
9%
Machinery operators and drivers 9%
5%
aucklandnz.com20 | Papakura Local Economic Overview 2019
20 Specialist
| Document Title – even page header managers10 are the largest occupational group in Papakura, followed by
education professional, sales workers and automotive and engineering trades.
TOP 10 OCCUPATIONS BY EMPLOYMENT IN PAPAKURA (2018) (source Infometrics)
% of total jobs
Rank Occupations Jobs
in Papakura
1 Specialist Managers 1814 9.1%
2 Education Professionals 1239 6.2%
3 Sales Assistants & Salespersons 1175 5.9%
4 Automotive & Engineering Trades Workers 856 4.3%
5 Road & Rail Drivers 829 4.1%
6 Other Labourers 764 3.8%
7 Construction Trades Workers 753 3.8%
8 Chief Execs, General Managers, Legislators 744 3.7%
9 Business, HR & Marketing Professionals 697 3.5%
10 Hospitality, Retail & Service Managers 670 3.3%
Sub-total Top 10 occupations 9,541 47.7.%
Note, includes
Total jobs 19,992
self-employed
Many occupations saw growth from 2013-2018, particularly for specialist managers and
trades in the automotive and construction sectors. Personal services and carers and
aides also grew as occupations.
FASTEST GROWING OCCUPATIONS 2013-2018 (source Infometrics)
Occupation New Jobs
Specialist Managers 245
Automotive & Engineering Trades Workers 175
Construction Trades Workers 141
Road & Rail Drivers 132
Other Labourers 128
Carers & Aides 123
Design, Engineering, Science Professionals 110
Factory Process Workers 105
Business size11
In 2018 there were 4,353 businesses in Papakura employing an average of 4.6
employees each, just above the Auckland average 4.5 employees.
10 Specialist managers include managers in advertising, construction, ICT, business administration and
education.
11 Large businesses are defined as entities with 20 or more employees21
BUSINESS SIZE - NUMBER OF EMPLOYEES (2018) 21 | Document Title(source Infometrics)
– even page header
80%
70%
70% 64%
60%
50%
40%
30%
21%
18%
20%
10% 6% 5% 4% 4% 3% 2% 1% 1% 1% 1%
0%
0 1 to 5 6 to 9 10 to 19 20 to 49 50 to 99 100 and
over
Papakura Auckland
The number of businesses grew 1.6 per cent a year on average over the last decade, a
slower average growth rate than the Auckland average of 1.9 per cent.
Future of Work in Papakura
In 2019 ATEED commissioned work12 to examine the likely future skills needs of the
Auckland economy as changing population demographics, emerging technologies and the
growth of new industries changes the nature of employment and the skills needed.
The Papakura Local Board area is located in the south of the Auckland region close to
important employment precincts in south Auckland, while residents can also access
employment opportunities in the central city area.
Future Employment Growth
Population growth and changing consumer demand will influence growth in particular
sectors. The Auckland Future Skills report indicates that Auckland can expect to see
growth across most industries with notable growth in construction, professional services,
health care, food service and education. Construction in particular is expected to grow by
approximately 56,000 jobs over the next 10 years.
Education is an important employment sector in Papakura with eight per cent of jobs in
the area. Health care and social assistance is also important and provides seven per
cent of the area’s jobs. Construction is a key employer in almost all local board areas and
represents 15 per cent of employment in the Papakura Local Board area. Growth in
these sectors is likely to positively impact on the Papakura work force.
Professional services jobs include accounting, legal, architectural, engineering and
management consulting services are forecast to grow 28 per cent (31,000 jobs) over the
next ten years and much of this growth is likely to be in the central city where these jobs
are strongly concentrated.
12 Auckland Future Skills, Martin Jenkins (May 2019)
aucklandnz.com22 | Papakura Local Economic Overview 2019
22 As
| Document Title – even page header an outlying local board area, Papakura also has a few jobs in these sectors which
account for around five per cent of local employment. Forecast growth in these sectors
is likely to include limited growth in Papakura. Papakura residents also have reasonable
access to the central city to access the growing number of professional service jobs there.
For Papakura Local Board employment in Auckland’s south is an important source of
household jobs and income. Over 40 per cent of Papakura residents work in the
employment zones of the south. In the South Auckland labour market construction
stands out as the industry of greatest projected with an expected gain of close to 15,000
jobs over the next ten years. This is a significantly larger increase than in any other
industry for south Auckland and therefore an important sector that will create new jobs
for residents.
INDUSTRIAL FORECAST FOR SOUTH AUCKLAND 2018-2019
Industry Employment 2018 Employment 2029 Change
Construction 24,482 39,348 14,866
Transport, Postal and Warehousing 24,326 29,303 4,976
Professional, Scientific and Technical Services 17,614 22,385 4,772
Administrative and Support Services 15,252 19,545 4,293
Education and Training 15,252 19,281 4,029
Accommodation and Food Services 13,221 16,922 3,701
Public Administration and Safety 11,247 14,930 3,683
Health Care and Social Assistance 19,922 23,358 3,436
Manufacturing 33,944 36,660 2,716
Source: Infometrics
Other industries forecast to grow in south Auckland include:
• Transport, postal and warehousing – increase of 4,976, driven mainly by air and
space transport, road freight transport and freight forwarding services
• Professional, scientific and technical services – increase of 4,772 employed
• Administrative and support services – 4,293 increase in total employed
• Education and training – 4,029 increase in total employed, primarily preschool
and school education.
While Papakura may not see employment growth in relation to the growth in professional
services , forecast growth in construction, production and distribution managers and
education and health across Auckland’s south will provide employment opportunities.23
Employment Zones 23 | Document Title – even page header
Employment in Papakura is concentrated in a small number of
town centres such as Papakura Town Centre which is home to
retail and hospitality businesses alongside professional services
as well as large format retail in Takanini. Small but locally
significant industrial areas also exist at Papakura and Takanini.
Papakura is a varied local board area including town centres, suburban areas, semi-rural
areas as well as commercial and industrial zones. The local board area is towards the
southern edge of urban Auckland. There are 57,636 residents of Papakura which has a
labour force of 30,800. The local board area has a total of 19,992 jobs located within it.
Employment Zones
Employment in Papakura is concentrated in the main town centre of Papakura and also in
the adjacent area of Takanini which has a mix of industrial and commercial activities as
well as’ big box’ retail. The town of Papakura also has an industrial zone with a number
of food and beverage manufacturing jobs.
EMPLOYMENT IN PAPAKURA INDUSTRIAL AREA* (source Infometrics)
Industry Jobs
Fruit, Oil, Cereal and Other Food Product Manufacturing 541
Beverage and Tobacco Product Manufacturing 351
Wood Product Manufacturing 260
Non-Metallic Mineral Product Manufacturing 251
Construction Services 250
Road Transport 248
Total employment (all sectors) 2,720
* Based on business demographics for the SA2 area
EMPLOYMENT IN TAKANINI INDUSTRIAL AREA*
Industry Jobs
Road Transport 445
Wholesale Trade 415
Construction Services 318
Professional, Scientific and Technical Services 224
Other Store-Based Retailing and Non Store Retailing 164
Heavy and Civil Engineering Construction 164
Fabricated Metal Product Manufacturing 152
Total employment (all sectors) 2,921
* Based on business demographics for the SA2 area
aucklandnz.com24 | Papakura Local Economic Overview 2019
24 Town Centres13
| Document Title – even page header
The main town centre employment zones in the Papakura Local Board area are Papakura
town centre and Takanini.
Papakura has seen 25 per cent growth in spending between the period from June 2015
to June 2019 compared to 13 per cent regionally. The average transaction value in
Papakura was $44.18, above the Auckland average of $43.57.
PAPAKURA SPEND AND AVERAGE TRANSACTION VALUE (2015-2019)
Spending growth 2015-2019
(four quarter average) $50 M
25%
13% $40 M
Average transaction value
Papakura Auckland
$30 M Papakura: $ 44.18
Auckland: $43.57
$20 M
Jun-15 Dec-15 Jun-16 Dec-16 Jun-17 Dec-17 Jun-18 Dec-18 Jun-19
Papaukra Spend Auckland Spend Trend Line
Spending in Takanini has not grown in recent years, falling seven per cent between June
2015 and June 2019 compared to 13 per cent growth regionally. The average
transaction value in Takanini was $52.78, above the Auckland average of $43.57.
TAKANINI SPEND AND AVERAGE TRANSACTION VALUE (2015-2019)
$40 M
Average transaction value
Spending growth 2015-2019
(four quarter average) Takanini: $52.78
Auckland: $43.57
Takanini Auckland
13% $30 M
-7%
$20 M
Jun-15 Dec-15 Jun-16 Dec-16 Jun-17 Dec-17 Jun-18 Dec-18 Jun-19
Takanini Spend Auckland Spend Trend Line
13 Town centre spend data is provided by Marketview and is derived from credit and debit card transactions.
Area with higher levels of cash payments may have spending slightly under reported.25
Development Trends 25 | Document Title – even page header
Auckland has been undergoing a period of rapid growth
facilitated by the development of the Auckland Unitary Plan.
This is reflected in the level of residential development in the
Papakura Local Board area with Hingaia currently seeing
significant housing developments while Papakura town itself is
a development area identified in the Auckland plan.
The completion Southern Motorway upgrade (Manukau-Drury)
will improve road transport in South Auckland making it easier
to access and move through Papakura.
Context
Several mandatory plans and strategies are required by legislation to demonstrate
Auckland grows in a way that will meet the opportunities and challenges of the future.
The refreshed Auckland Plan (2018) sets the spatial vision for Auckland’s future
development through to 2050 to identify the type of city Auckland will become and how it
will accommodate its housing, economic, social and environmental needs. The Auckland
Plan identifies that Auckland may need another 313,000 dwellings and up to 263,000
extra jobs by 2050 requiring a plan for where and how people will live and how they will
access jobs, facilities and services.
Within the Auckland Plan is the Auckland Development Strategy which shows how
Auckland will physically grow and change over the next 30 years. It takes account of the
outcomes Auckland wants to achieve, as well as population growth projections and
planning rules in the Auckland Unitary Plan.
The Unitary Plan (2017) was developed to set the planning rules for:
• what can be built and where
• how to create a higher quality and more compact Auckland
• how to provide for rural activities
• how to maintain the marine environment.
The Development Strategy outlines key nodes and development areas where the bulk of
new development of housing, employment and civic services will be located and how that
can be connected by efficient transport links. Beyond the city centre the key nodes of
growth are in the south (Manukau), north (Albany) and northwest (Westgate). Rural
nodes in Pukekohe and Warkworth will service their surrounding rural communities and
will support significant business and residential growth.
Development areas are spread across the region. Expected growth is identified if it is
expected in any of the next three decades. In addition to areas identified for
development most other urban areas will experience some development and change.
aucklandnz.com26 | Papakura Local Economic Overview 2019
26 This
| Document Title – even page header could be in the form of subdivision, or the redevelopment of existing buildings/land
parcels at higher densities.
One development area is included in Papakura that is expected to see major growth in
the short and medium term.
Papakura has good connections by rail and road both north and south. Papakura train
station is the third busiest in Auckland with over 2,000 people using it every day. The
Auckland Unitary Plan provides scope for increased density with large areas zoned
Metropolitan Centre, Terrace Housing and Apartment Building and Mixed Use zoning.
Papakura is expected to add significant numbers of houses to the area over the next 30
years but limited contribution to additional employment.
Expected Dwelling Anticipated Employment
Development Area Phasing
Growth 2018-2048 Growth 2018-2048
Papakura 11-30 years 2,160 1240
Future urban areas
New communities will be established in future urban areas on the fringe of Auckland’s
existing urban area and in rural and coastal settlements primarily in the region’s north
and south. In future urban areas, the Future Urban Land Supply Strategy 2017
sequences when land will be live zoned, based on when infrastructure will be available. A
third of new development over the next 30 years is anticipated in these future urban
areas, the bulk of which will occur over the next decade14. Some of this land will be
required to meet increased demand for commercial, light and heavy industrial uses.
Papakura has a number of areas identified as Future Urban and mapped out in the
Future Urban Land Supply Strategy primarily at Hingaia where many houses have already
been built and Takanini.
Area Phasing Expected Dwelling Growth 2018-2048
Cosgrave Road 2023-2027 500
Takanini 2043-2047 4,500
New dwellings
There were 867 new dwellings consented in 2018, which was 11.1 per cent of the 7,824
issued in the Auckland region. The number of new dwellings consented has risen sharply
over the last 8 years.
14 Development Strategy27
NUMBER OF PRIVATE DWELLINGS (OCCUPIED & UNOCCUPIED)
2,526
27 | Document Title – even page header
Additional dwellings
18,243
15,717 There were 2,526
additional dwellings in
14,457 Papkura in the 2018
Census compared to
2013. This has helped
make the area the fastest
growing in the region.
2006 2013 2018
At the 2018 Census there were 1155 unoccupied dwellings and 288 under construction.
Between 2013 and 2018 censuses there were 2,526 additional dwellings in Papakura an
increase of 16.1 per cent compared to a 6.5 per cent increase across the region.
Future Development
Already well underway, the Southern motorway upgrade (Manukau-Drury) is intended to
improve road transport in South Auckland making it easier to access Papakura. The
project includes additional lanes in both directions, upgraded Takanini Interchange and a
4.5km shared use pedestrian / cycle path15.
Other significant developments in or near the local board area that could provide a source
of employment or improve access to jobs include Wesley new town, HNZ Māngere
Housing, Drury South Industrial, Ormiston Town Centre, Auckland Airport expansion and
Middlemore Hospital. These developments will generate construction employment
opportunities and subsequent jobs growth.
15 https://www.nzta.govt.nz/projects/southern-corridor-improvements
aucklandnz.com28 | Papakura Local Economic Overview 2019
28
Economic Development Opportunities
| Document Title – even page header
The Auckland Region aim: Develop an economy that delivers
opportunity and prosperity for all Aucklanders and New Zealand
In its current Local Board Plan the Papakura Local Board seeks to ensure that Papakura
has a strong local economy and that Papakura town centre itself is vibrant and
prosperous. The local board’s vision is more people with higher education achievements
gain well-paid employment and working locally.
ATEED are able to provide support to local boards or groups of local boards in a number
of ways, including:
Business environmental sustainability
• Promote sustainable business practices in key areas such as waste
minimisation. Identifying the needs of local business through needs assessments
and providing implementation options.
• Provide businesses access to sustainable business coaching and
sustainability seminars.
Places
• Work alongside Panuku Development Auckland in its Transform and Unlock
areas to help identify and realise economic development opportunities in those
areas.
• Support local boards with specific place-based initiatives to help revitalise areas
and build on their unique characteristics in order to promote enhanced economic
outcomes.
Enterprise
• Manage delivery of local business programmes that provide access to business
skills where mainstream services don’t meet community need (e.g. PopUp
Business School).
• Support youth enterprise initiatives (e.g. Young Enterprise Scheme).
Economic analysis and research
• Support local boards to understand strengths, opportunities and challenges in
their areas by providing analysis of available data.
• Commissioning work to understand particular issues or opportunity a local area
may have and how and identify appropriate actions.
Leveraging local opportunities
• Support local boards to consider how they may best support local businesses to
capitalise on opportunities that may arise as a result of major events or
development projects in the region.
The table below provides some thoughts as to where ATEED’s local delivery can help the
local board deliver against its objectives. Where related initiatives that are delivered by
other parts of the Auckland Council family these are noted.
ATEED has been directed by Council to focus its resources on economic development
initiatives in the less prosperous areas in West and South Auckland.29
ISSUES 29 | Document Title – even page header
Papakura residents perform below average in terms of education and skills acquisition.
Papakura also has a rapidly growing population yet local employment opportuntiies are
limited and many have to commute elsewhere for work. Meeting the increased demand
for local employment opportunties and ensuring access to other nearby employment
zones will be a key challenge.
ECONOMIC DEVELOPMENT OPPORTUNTIES
LED work stream Potential area of focus in Papakura Local Board area
Places Continue to support the work of the commercial centre project
group to drive forward the revitalisation of Papakura.
Enterprise Consider other enterprise support programmes that meet the
needs of the community that are currently not met by
mainstream regional programmes (such as PopUp Business
School).
Economic Update of Prosperity Index to keep the local board informed of
intelligence socio-economic picture in their area.
Leveraging local Leverage off investments being made in adjacent local boards to
opportunities improve resident’s access to employment and training
opportunities.
aucklandnz.com30 | Papakura Local Economic Overview 2019
30
Glossary
| Document Title – even page header
Australian and New Zealand This is the official industrial classification used by Statistics
Standard Industry Classification NZ. The classification system aims to reflect the structure
2006 (ANZSIC 2006) of Australian and New Zealand industries and enable
comparability with other countries’ statistics.
Business Areas Business areas reported are those Statistical Areas in the
Annual Business Demographics data with the largest
numbers of employees working in the area. In some cases,
the business areas cross local board boundaries.
Employment Head count of salary and wage earners sourced from
taxation data. Unless stated, does not include self-
employed.
GDP Gross Domestic Product is the total market value of goods
and services produced in the local board area, minus the
cost of goods and services used in the production process.
GDP for each local board was estimated by Infometrics Ltd
using 2010 prices.
Labour force participation The labour force is defined as all persons aged 15 years
and over who are looking for work, or are employed, either
full time, part time or casually.
Population The population for the local board area is the usual
resident population count from the 2018 Census of
Population and Dwellings. This figure may be lower than
previously published estimated 2018 population figures
from Statistics New Zealand.
Productivity The NZ Productivity Commission defines productivity as the
efficiency with which resources – such as labour and
capital – are converted into outputs of goods and services.
Unemployment rate The unemployment rate is the number of people aged 15
years and over who did not have a paid job, were available
for work, and were actively seeking work, as a percentage
of the labour force.GET IN TOUCH
──
John Norman
ATEED ECONOMIC DEVELOPMENT
E john.norman@aucklandnz.com
aucklandnz.com/business
aucklandnz.comYou can also read