Beach Profile Assessment and Erosion Rate Estimation of Monsoonal Coastline Area in Pahang, Malaysia
←
→
Page content transcription
If your browser does not render page correctly, please read the page content below
IOP Conference Series: Earth and Environmental Science

PAPER • OPEN ACCESS

Beach Profile Assessment and Erosion Rate Estimation of Monsoonal
Coastline Area in Pahang, Malaysia
To cite this article: Nor Aizam Adnan et al 2021 IOP Conf. Ser.: Earth Environ. Sci. 799 012005

View the article online for updates and enhancements.

 This content was downloaded from IP address 46.4.80.155 on 23/08/2021 at 15:47

Sustainability and Resilience of Coastal Management (SRCM 2020) IOP Publishing
IOP Conf. Series: Earth and Environmental Science 799 (2021) 012005 doi:10.1088/1755-1315/799/1/012005

Beach Profile Assessment and Erosion Rate Estimation of
Monsoonal Coastline Area in Pahang, Malaysia

 Nor Aizam Adnan1, Haris Abdul Rahim1, Fazly Amri Mohd2, Khairul Nizam
 Abdul Maulud3
 1
 Center of Studies Surveying Science and Geomatics, Faculty of Architecture,
 Planning and Surveying, Universiti Teknologi MARA, Shah Alam, Selangor
 2
 Center of Studies Surveying Science and Geomatics, Faculty of Architecture,
 Planning and Surveying, Universiti Teknologi MARA, Arau, Perlis
 3
 Climate Change Institute, Universiti Kebangsaan Malaysia, Bangi, Selangor

 Email: harisrahim8@gmail.com

 Abstract. Malaysia has a long coastline stretching over 4,809 km where more than 1,300 km of
 beaches are experiencing erosion. Coastal erosion is defined as the permanent loss of land and
 habitats along the coastline resulting in changes to the coast. Thus, it is important to detect and
 monitor coastline changes especially in Pahang, Malaysia. This study used temporal data and
 high spatial resolution imagery of SPOT 5. It also explored remote sensing and GIS techniques
 to monitor coastline changes along 10 identified locations, from Cherating to Pekan of the
 Pahang coast. Ten significant coastline locations namely Pantai Cherating, Pantai Air Balok,
 Sungai Ular, Pantai Batu Hitam, Pantai Beserah, Swiss Garden Kuantan, Taman Gelora, Pantai
 Sepat, Pantai Cherok Palok, and Pantai Tanjung Agas were identified to be vulnerable to
 coastline erosion. Two temporal remote sensed date of SPOT 5 for the year of 2006 and 2014
 were used to quantify erosion or accretion rate using National Coastal Erosion Study (NCES)
 guidelines. The research found that eight area out of 196 or 39.7% locations were eroded and
 categorized into acceptable erosion category (K3), while 64 area or 32.7 % had significant
 erosion category (K2) where the coastline retreated more than one meter per year and the most
 critical eroded area was K1 at 54 or 27.6% sites. Cherating, Swiss Garden Resort, and Cherok
 Paloh were among the sites with the highest erosion rate between -5.692 and -6.919 m/yr.
 Meanwhile, the highest rate of accretion or sedimentation was indicated in Tanjung Agas at
 7.391 m/yr. A qualitative relationship between the erosion rate and slope percentage for the entire
 Kuantan coast that stretch from Pantai Cherating to Tanjung Agas, Pekan indicated that the
 coastal slope percentage, the beach width, and the beach material that deposited on the sites were
 interrelated and had significant impacts on the erosion rate on several particular zones of the
 Kuantan coastlines. The findings from monitoring coastline changes and identifying vulnerable
 erosion areas might be useful in the policy and decision making for sustainable coastal
 management.

 Content from this work may be used under the terms of the Creative Commons Attribution 3.0 licence. Any further distribution
 of this work must maintain attribution to the author(s) and the title of the work, journal citation and DOI.
Published under licence by IOP Publishing Ltd 1
Sustainability and Resilience of Coastal Management (SRCM 2020) IOP Publishing
IOP Conf. Series: Earth and Environmental Science 799 (2021) 012005 doi:10.1088/1755-1315/799/1/012005

1. Introduction
The coastal zone is defined as a narrow area of land adjacent to the coastline where the sea and the land
intersect. This area is a highly dynamic and complex environment characterized by a multitude of
processes and activities. The low-water line of a coastal state is the starting point of the baseline. Straight
baselines may be used when the coastline is deeply indented, has fringing islands or is highly unstable.
Baseline is important because it is fundamental to maritime claims. Baseline is the starting point for
claiming maritime zones. Every coastal state has jurisdiction over the oceans and seas, the limits of
which are defined by international conventions and national regulations must confirm to international
law. The severity of shoreline erosion was defined by several factors, including geomorphologic
properties and land use (Pile et al., 2017).
 Beaches are made up of eroded material that has been transported from elsewhere and deposited by
the sea. The open sandy beach is a natural sediment buffer for coastal systems. Erosion and accretion of
this buffer are correlated with high and low energy wave conditions. High energy waves erode sand
from the beach, while low energy waves supply sedimentary material. The smallest material is deposited
near the water and larger material is found nearer the cliffs at the back of the beach. Most waves break
near the coastline, so sediment near the water is more effectively broken down by attrition. The processes
outlined can present problems to unprotected coastal areas, such as the Kuala Terengganu lagoon. The
National Coastal Erosion identified that 29% of the Malaysian coastline was in various stages of
evacuation (Ghazali, 2006).
 The east coast of Peninsular Malaysia is exposed to higher current speeds compared to the west coast.
Pahang is one of the largest states which are located on the east coast of Peninsular Malaysia. Coastal
areas in Pahang offer many beautiful beaches with fascinating landscape and scenery, which capture the
attention of visitors and tourists. Cherating, Teluk Chempedak, Tanjung Lumpur, and Pantai Sepat are
the most attractive beaches in Pahang, which attract people for recreational activities (Mohd et al., 2918;
Mustafa et al, 2015). Pahang lays on the Eastern part of Peninsular Malaysia making it exposed to
maximum current speeds of winds during two seasonal monsoons. Pahang coastline was identified as
having been badly eroded with erosion rates ranging from -3 m/yr to -5m/yr and in some places it was
more than -5m/yr (Mohamad et al. 2014). This condition would make people move inland and find other
higher places that are suitable for agriculture and residential.
 Since the 2010s, several strategies have been adapted to prevent further erosion and protect the
eroded beaches in Pahang coast. These projects, consisting of the construction of a series of groins and
breakwater, have been implemented along the Kuantan Port and Pantai Batu Hitam, Kuantan. Kuantan
Port is one of the major maritime gateways to the east coast region of Peninsular Malaysia and
contributes to Pahang economy. Fishery and aquaculture products are also a main source of income
especially for the communities on the long coastline and large network of rivers of the state.
 Coastal areas are categorized by high concentrations of human settlements where population density
is usually three times the global mean. If the problem remains unsolved within five to ten years, the
beaches in the area might be fully eroded. Akhir and Jawchuen (2011) noted that during the Northeast
Monsoon season, the surface current runs southward along the east coast of Peninsular Malaysia. Strong
waves are prevalent during the northeast monsoon when the winds are onshore, while during the
southwest monsoon, the winds are offshore and low energy. Thus, this study utilized remote sensing
data on coastal extraction to quantify the rate of erosion and accretion along selected Kuantan coastline.
Association with coastal slope as estimated from active remote sensing data such as IFSAR and open-
source data such as Google Earth images were also included to understand the relationship between
erosion rate with beach morphology characteristics (i.e., beach width, sand types, beach slope).

2. Study Area and Methods

2.1. Study Area
The study area encompasses the coastal areas from Cherating to Pekan along the coast of Pahang state,
which is located in the east coast of Peninsular Malaysia facing the South China Sea. The coastal areas

 2
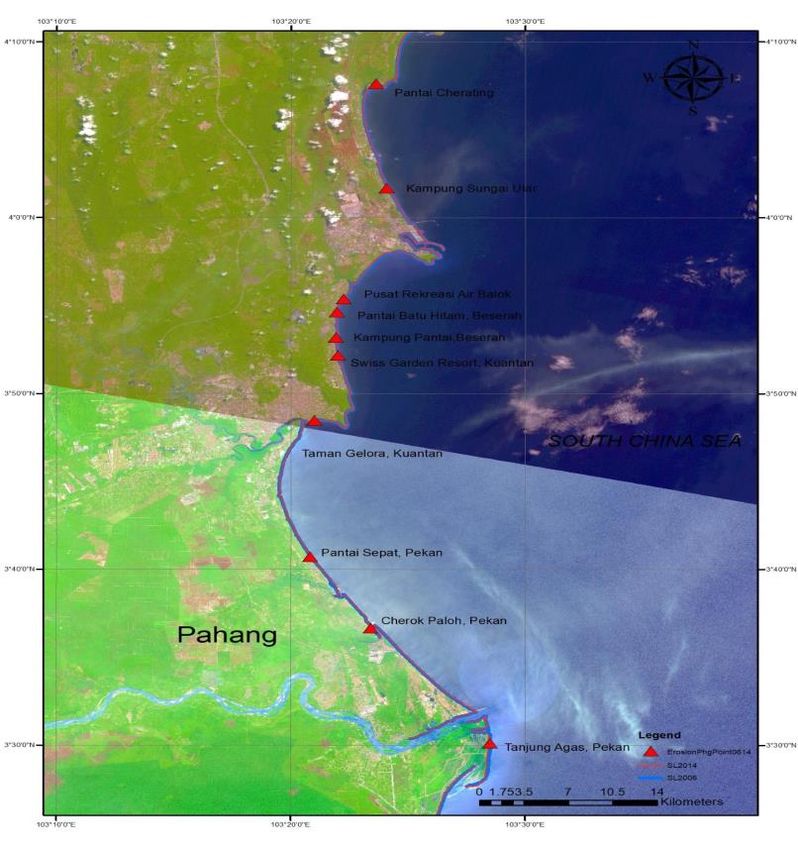
Sustainability and Resilience of Coastal Management (SRCM 2020) IOP Publishing
IOP Conf. Series: Earth and Environmental Science 799 (2021) 012005 doi:10.1088/1755-1315/799/1/012005

are low lying areas between the latitude 4° 07’ 38.39” and 3° 32’ 5.25” East and longitude 103° 23’
44.68” and 103° 27’ 41.08” North. Coastal erosion is always accompanied with a shoreward recession
of the coastline and the loss of land area which also largely depends on the nature of the waves. However,
the study area covers approximately 83.91 km of the coastal length from Cherating to Pekan where sand
materials make up the entire coastline. The geomorphology of coastal areas from Cherating to Pekan is
a sandy type. The climate of Pahang is characterized by the Northeast monsoon which prevails between
November and March. The annual temperature is between 25.6 °C and 27.8 °C (Malaysian
Meteorological Department 2016). This study identified ten zones based on ten locations from Cherating
to Pekan coastal areas namely Pantai Cherating, Kampung Sungai Ular, Pantai Rekreasi Air Balok,
Pantai Batu Hitam, Pantai Kampung Beserah, Swiss Garden Resort, Taman Gelora, Pantai Sepat,
Cherok Paloh and Tanjung Agas as shown in Figure 1.

 Figure 1. Study area of
 Kuantan, Pahang coastline from
 Pantai Cherating to Pekan,
 Pahang.
 (Google Earth, 2017)

2.2. Data Acquisition
The aim of this study is to determine beach profile and comparison with remotely sensed data while
analyzing the relationship towards erosion event that happened. However, a traditional method which is
beach profiling was still needed to perform to compare the results by checking the accuracy and
precision. Thus, traverse, levelling, and GPS observation needs were established for acquiring the
ground control points (GCPs). Three stages of data acquisition were done i.e., GPS observation,
traversing and levelling; satellite imageries; and beach profiling. Data used in this study was obtained
from different temporal resolutions covering the coastlines from Pantai Cherating to Tanjung Agas,
Pekan. Temporal resolution refers to the data acquisition between the changes occurring between 2006
and 2014. Table 1 shows the data acquisition from different department and universities performed for
this study.
 Table 2 presents data acquisition regarding data types, date and time of acquisition and spatial
resolution of SPOT data. In this study, the projection system used for image satellite is Geodetic Datum
of Malaysia (GDM) 2000. The acquisition date relied on the availability of satellite operation while

 3
Sustainability and Resilience of Coastal Management (SRCM 2020) IOP Publishing
IOP Conf. Series: Earth and Environmental Science 799 (2021) 012005 doi:10.1088/1755-1315/799/1/012005

capturing the images and at the same time, avoiding cloudy and bad weather conditions in this area.
Commonly, in remote sensing principle, the coastline can be extracted from a single band image, since
the reflectance of water is nearly equal to zero in the reflective infrared bands (Lillesand and Kiefer,
2004).

 Table 1. Data acquisition from respected agencies.
 Raw Data Acquisition Years Department/Institute/Agency
 SPOT-5 2006 and 2014 Department of Survey and Mapping Malaysia
 IFSAR 2010 (JUPEM) through Universiti Kebangsaan Malaysia
 (UKM)
 Elevation Profile (Google 2010 Open-source data extracted from Google Earth Pro
 Earth)
 GPS Survey (Slope) 2018 National Hydraulic Research Institute of Malaysia
 (NAHRIM)
 Site Visit 2018 Universiti Teknologi MARA (UiTM) supervision by
 Universiti Kebangsaan Malaysia (UKM)
 Geomorphology and 2007 Department of Irrigation and Drainage (DID)
 geological studies
 Malaysian Tidal Harmonic 2017 JUPEM and National Hydrographic Centre (NHC)
 constant

 Table 2. Satellite image specification (SPOT-5).
 Date of Tidal Height Event Time of Acquisition Spatial Resolution
 acquisition
 02/07/2006 2.5m High Tide 11.49 am 2.5 m
 22/08/2014 2.2 m High Tide 11.00 am 2.5 m
 20/07/2006 1.9 m Low Tide 11.49 am 2.5 m
 05/08/2014 1.8 m Low Tide 11.03 am 2.5 m

2.3. Methods
Figure 2 shows the flowchart of this research. The stages consist of identification of problem,
reconnaissance, planning and design, data acquisition, data processing, and result and analysis. GPS
observation was necessary because the GCP establishment can be done from traversing and levelling
(Labuz, 2016; Andrade et al., 2006). However, this research focused on the accuracy of different
methods for obtaining the GCP. Thus, GPS observation was conducted on every traverse station for
checking the accuracy between traverse data and GPS data. All that was required was a GPS receiver,
available in different models and at different accuracies. For this research, the GPS observation method
used was the MyRTKnet method. MyRTKnet method is a very fast method with only one or two seconds
of observation depending on the availability of satellite during the time of observation. The concept of
MyRTKnet is that the data captured during one observation is approximately 300 data. Afterwards, the
system calculates the mean and saves the mean data only.

 4
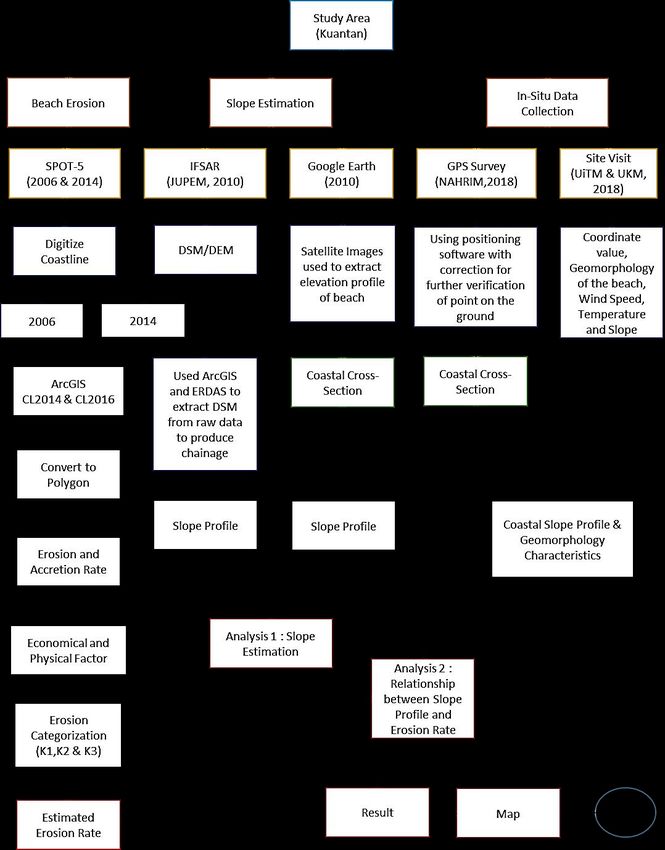
Sustainability and Resilience of Coastal Management (SRCM 2020) IOP Publishing
IOP Conf. Series: Earth and Environmental Science 799 (2021) 012005 doi:10.1088/1755-1315/799/1/012005

 Figure 2. Flowchart of Beach Profiling and Erosion Rate.

2.3.1. Physical and Economic Factor Determination for Erosion Rate Calculation. The physical
erosion rates of coastline analysed from historical satellite images were used as the physical parameters
in determining the erosion categorisation. It was noted that the erosion rates might vary along a stretch
of eroding coastline. The maximum retreat rate analysed was used for the purpose of erosion
categorisation. The scoring of physical parameter based on the physical erosion rates are given in Table
3. Physical erosion is considered “High” for annual erosion rates greater than 4 m/year and “Low” for
annual erosion rates less than 1 m/year. Erosion rates that ranged between 1 and 3.9 m/year are
considered as “Medium”.

 5
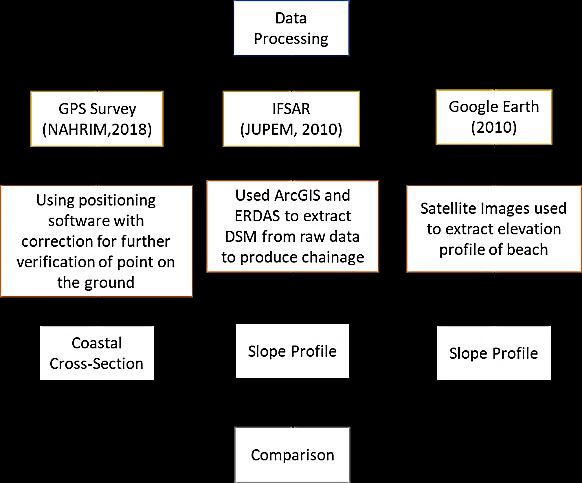
Sustainability and Resilience of Coastal Management (SRCM 2020) IOP Publishing
IOP Conf. Series: Earth and Environmental Science 799 (2021) 012005 doi:10.1088/1755-1315/799/1/012005

 Table 3. Scoring for physical parameter (NCES, 2015).
 Parameter Description Erosion Rate (m/year) Physical Erosion Score
 Low ≤0.99 Actual erosion rate (m/year)
 Medium 1.00 to 1.99 2 points
 Rate of coastline
 2.00 to 2.99 3 points
 retreat
 3.00 to 3.99 4 points
 High ≥4.00 5 points

 An economic parameter is based on the economic significance of the stretch of eroding coastline.
For the purpose of erosion categorization, the economic significance can be described by the following
components such as land use, building and establishment, public utilities and amenities that exist in the
area (NCES, 2015).

 (Eq 1)

2.3.2. Slope Derivation. The main concerns and results for this study are slope profiles for the beach
and the erosion rate tables with verification sensor-based remote data of IFSAR and Google Earth (high
spatial resolution). Figure 3 shows the data processing flow chart for the slope profiles that were
obtained from three different sources and techniques applied.

 Figure 3. Data Processing for Coastal Slope Derivation.

 Thus, the survey and satellite data extraction needed to be accurate and proven to support the
relationship of erosion phenomenon that occurred in Kuantan, Pahang. Therefore, the actual coastline
was mapped and the eroded and accredited area were determined, especially on coastal habitable land
where the baseline had been changing due to reclaiming activities. The formula (Eq.2) below was used
for the calculation of slope percentage for both IFSAR and Google Earth data.

 −
 (%) = × 100%

 6
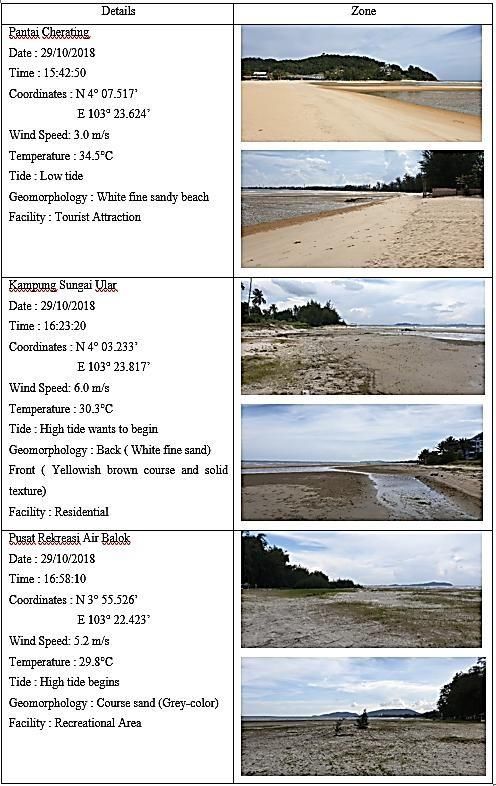
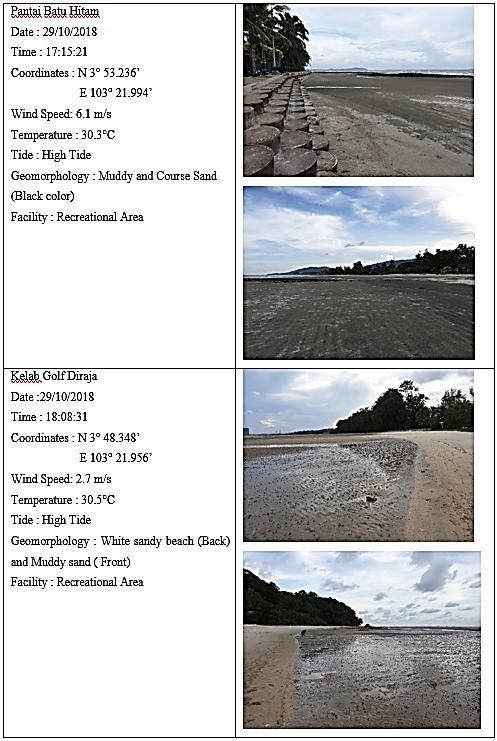
Sustainability and Resilience of Coastal Management (SRCM 2020) IOP Publishing
IOP Conf. Series: Earth and Environmental Science 799 (2021) 012005 doi:10.1088/1755-1315/799/1/012005

 (Eq.2)

3. Result and analysis
High-resolution satellite imagery of SPOT-5 obtained from the Malaysia Remote Sensing Agency for
the years of 2006 and 2014 were used to derive the coastline along Kuantan area. Accredited and eroded
polygon area were determined through ArcGIS spatial analysis processing so that further categorization
of erosion rate using the NCES categorization could be performed. The IFSAR measurement data that
were obtained from Malaysia’s Department of Surveying and Mapping (JUPEM) and National
Hydraulics Research Institute Malaysia (NAHRIM) were used for further erosion rate analysis, beach
slope profiling and to figure out the relationship between these two outputs. The IFSAR data were
compared to Google Earth and GPS survey to obtain the exact elevation of each selected beach slope
for profiling. Moreover, to validate the accuracy of estimated beach slope from the IFSAR and Google
Earth, physical site verification was conducted from 28 October 2018 until 30 October 2018 and
comparison to the NAHRIM slope data was done.

3.1. Physical Site Verification
Site visits for verification purposes were done from 28 October until 30 October 2018 and served as
verification data for estimation of accretion and erosion rate derived from satellite SPOT 5 data. The
data collected includes the coordinates (x, y) for each site, time, wind speed, temperature, types of tides,
geomorphology of the beach and the types of nearby facilities. All of the data collected were used for
the relationship quantification of coastal erosion and slope profile along the study area. Table 4 shows
the information gathered from the site visit of each location along Kuantan coastline.

 7
Sustainability and Resilience of Coastal Management (SRCM 2020) IOP Publishing
IOP Conf. Series: Earth and Environmental Science 799 (2021) 012005 doi:10.1088/1755-1315/799/1/012005

 Table 4. Site Verification along Kuantan coastline.

 8
Sustainability and Resilience of Coastal Management (SRCM 2020) IOP Publishing
IOP Conf. Series: Earth and Environmental Science 799 (2021) 012005 doi:10.1088/1755-1315/799/1/012005

 Some of the area were not accessible due to restrictions and that they were labeled as private
properties which limited accessibility to the sites for site verification. The geomorphology and types of
sands that existed served as an indicator of erosion with grain size and slope property (steep or slant).

3.2. Coastal Erosion and Accretion Analysis
Ten significant eroded spots were identified as shown in Figure 5, namely Pantai Cherating, Pantai Air
Balok, Swiss Garden Resort Kuantan, Kampung Sungai Ular, Pantai Batu Hitam Beserah, Kampung
Pantai Beserah, Taman Gelora, Pantai Sepat, Pantai Cherok Palok and Pantai Tanjung Agas. As shown
in Table 5, there are 78 area out of 196, which means 39.7% locations were eroded and being categorized
as K3 of acceptable erosion category (Table 3). The category was given based on the NCES 2015
guidelines which indicates that a total score of lower than or equal to 5 is considered as acceptable
category. About 64 area or 32.7 % was of significant erosion category (K2) where the coastline had
retreated more than 1 meter per year on a generally sparse populated area with some agricultural

 9
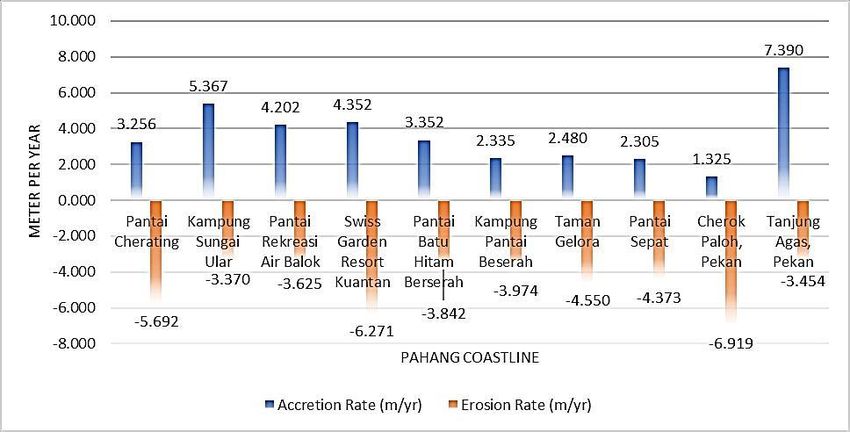
Sustainability and Resilience of Coastal Management (SRCM 2020) IOP Publishing
IOP Conf. Series: Earth and Environmental Science 799 (2021) 012005 doi:10.1088/1755-1315/799/1/012005

activities. A significant value means the threat of erosion on that spot is imminent and if it is left
untreated it can be worsened in upcoming years and preventive measures should be taken by the local
authorities. The most critical eroded area was K1 which consisted of 54 sites or 27.6 % of the sites with
fast retreating coastline in fairly dense human settlement and significant public infrastructure. These
critical areas are usually left by people and the soil is not suitable for vegetation. Beach nourishment or
construction of sea walls could save the residential area along the coastline. People would lose their
homes otherwise, and compensation would be high to be sustained by local authorities. There was a total
of up to 205.66 hectares of area that had been eroded along 103 kilometers stretching from Cherating to
Pekan indicating the needs for future preventive measures.

 Table 5. Summary of erosion categories in Kuantan, Pahang coastal area.
 Coastline Area Area Area Coastline
 Condition
 Length (m) (Hectare) (Acre) (Sq. Meter) Width (m)
 Total K3 (78) 15928.923 5.560 13.738 55596.979 Acceptable 746.431
 Total K2 (64) 42604.100 46.414 114.691 464136.652 Significant 1682.398
 Total K1 (54) 97815.691 205.659 508.194 2056586.006 Critical 2910.123

 Based on Table 5 and Figure 4, Cherating, Swiss Garden Resort and Cherok Paloh were among those
with the highest erosion rates, between -5.692 and -6.919 m/yr. Comparing beach profiles in this study,
no significant changes of accretion were found in two locations, Cherating and Balok. Meanwhile, the
highest rate of accretion value was indicated in Tanjung Agas at 7.391 m/year. Based on the location of
the coastline that was facing the South China Sea, this result is also supported by Mohd et al. (2018)
which stated that beach erosion occurring along the coastline of the east coast states of Peninsular
Malaysia is mainly due to large waves activity during the northeast monsoon seasons (Husain et al.,
1998, Ariffin et al., 2016).
 Other areas such as Kampung Sungai Ular, Pantai Rekreasi Air Balok, Pantai Batu Hitam Beserah
and Pantai Sepat had erosion rates ranging from -3.369 to 4.373 m/yr. The accretion rates at these four
locations were slightly increasing due to erosion at about 20% per year. Beach materials for the study
area were made of flat white sandy beach with minimum development in the surrounding area. Most
activities were agriculture and coastal residential with fisheries industry booming along the coastline.
Taman Gelora, which is situated near Pekan, also had a moderate erosion rate of -4.550 m/yr and
accretion rate of about 2.479 m/yr. Some mitigation structures were built along its shore, such as a
breakwater of about one kilometer in length.

 Figure 4. The rate of erosion and accretion at ten locations in the study area (m/yr).

 10
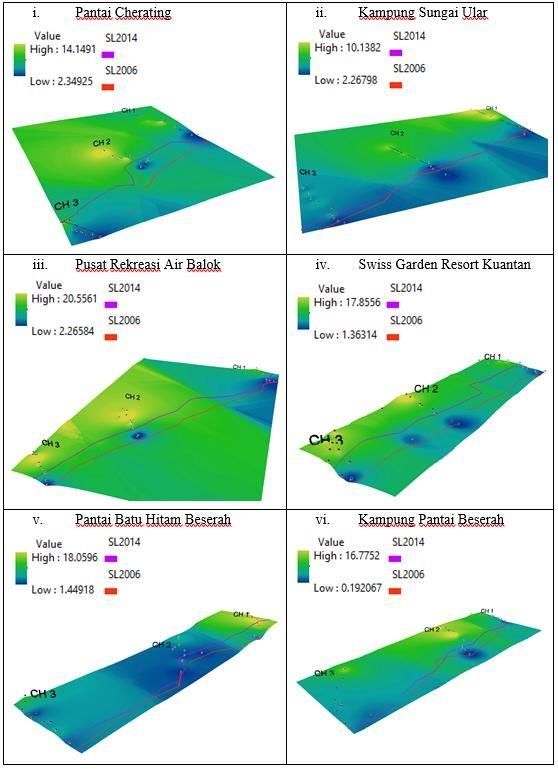
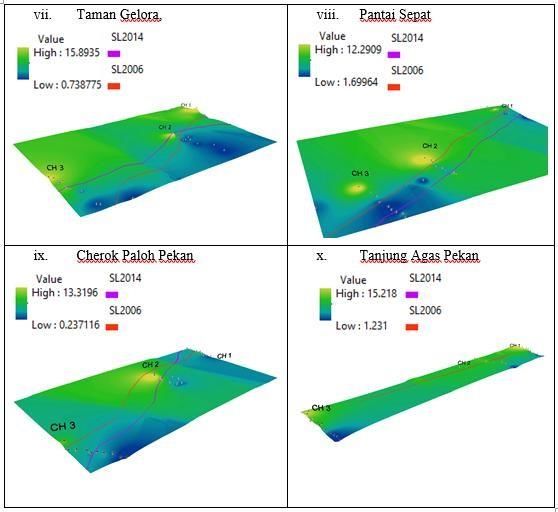
Sustainability and Resilience of Coastal Management (SRCM 2020) IOP Publishing
IOP Conf. Series: Earth and Environmental Science 799 (2021) 012005 doi:10.1088/1755-1315/799/1/012005

3.3. Beach Profile and Coastal Slope Derivation
The digital elevation model (DEM) created from an IFSAR system is essentially a first-surface DEM,
also known as digital surface model (DSM). The digital terrain model (DTM), representative of the
earth’s terrain, is obtained by editing the DSM using a semi-automated process during which all man-
made and vegetation features are removed. The distribution of beach profiles was along the ten locations
facing the South China Sea. The findings of in-situ measurements showed that the study area mainly
consisted of sandy beach, while the Cherating area had rocky shores and sandy beaches except at the
mouth of the river where the sandspit had been formed. Apart from that, Sungai Ular, Balok and Tanjung
Agas consisted of fine sand and medium sand.
 Figure 5 shows the topographic profile section of Pahang coast. From the ten area, Pantai Cherating
and Tanjung Agas had steeper slopes with values ranging between 1.5-3.6%. Meanwhile, Sungai Ular,
Pantai Balok, Pantai Sepat, and Cherok Paloh were represented by flatten and wider areas. These areas
are known for the most fascinating beaches in Pahang, which attract many tourists for recreational
activities. Meanwhile, Kampung Sungai Ular and Kampung Pantai Beserah had the least elevated beach
with elevation height ranging from 0.192 to 16.775 meters from the mean sea level. The most elevated
beach in Kuantan was Pusat Rekreasi Air Balok with a range of 2.265 and 20.556 meter. These data
were further verified with in-situ data by NAHRIM and site verification survey. The profile for Air
Balok beach consisted of small dunes along the vegetation line. Many bushes and sparse vegetation
along the shore and wide beaches were also spotted and they were very suitable for social activities.

 11
Sustainability and Resilience of Coastal Management (SRCM 2020) IOP Publishing
IOP Conf. Series: Earth and Environmental Science 799 (2021) 012005 doi:10.1088/1755-1315/799/1/012005

 Figure 5. The 3D Beach Profile of Study area using IFSAR data in Kuantan,Pahang coastal area.

 There are many ways to determine coastal slope, subjected to the specific region. In this study,
IFSAR data and Google Earth were utilized to derive elevation (Z value) and position (X and Y value)
for each point of the ten locations along the coastline. GPS survey conducted by NAHRIM was
considered as observed data and the accuracy was higher than the estimated slope from IFSAR and
Google Earth. Table 6 shows the slope estimation from IFSAR, Google Earth and NAHRIM,
represented as slope percentage value.

Table 6. Coastal slope percentage for ten eroded zones taken from IFSAR (2010), Google Earth (2010)
and NAHRIM (2018).
 Station Chainage Slope (%)
 IFSAR Google Earth NAHRIM
 (Estimated slope) (Estimated slope) (Observed slope)
 Pantai Cherating CH1: 4.818 4.237 4.504
 CH 2: 5.154 5.952 1.265
 CH 3: 5.348 10.460 3.103
 Kampung Sungai Ular CH1: 1.542 1.379 1.665
 CH 2: 3.973 5.072 2.641
 CH 3: 4.721 5.147 1.900
 Pantai Rekreasi Air Balok CH1: 2.211 2.242 2.374
 CH 2: 2.951 3.703 1.180
 CH 3: 3.951 4.048 1.135
 Swiss Garden Resort CH1: 6.332 6.482 3.165
 Kuantan CH 2: 6.914 6.723 6.400
 CH 3: 9.336 8.605 2.852
 Pantai Batu Hitam Berserah CH1: 3.234 3.824 3.464
 CH 2: 2.059 4.662 7.837
 CH 3: 6.982 9.174 4.496
 Kampung Pantai Beserah CH1: 3.023 5.780 5.181
 CH 2: 4.693 7.650 6.104
 CH 3: 10.259 3.363 4.320

 12
Sustainability and Resilience of Coastal Management (SRCM 2020) IOP Publishing
IOP Conf. Series: Earth and Environmental Science 799 (2021) 012005 doi:10.1088/1755-1315/799/1/012005

 Station Chainage Slope (%)
 IFSAR Google Earth NAHRIM
 (Estimated slope) (Estimated slope) (Observed slope)
 Taman Gelora CH1: 3.894 3.351 3.651
 CH 2: 8.261 4.070 15.236
 CH 3: 7.595 3.012 13.447
 Pantai Sepat CH1: 3.457 6.390 4.542
 CH 2: 3.987 6.202 5.067
 CH 3: 5.553 3.200 3.241
 Cherok Paloh, Pekan CH1: 2.910 3.478 9.212
 CH 2: 8.557 8.257 7.636
 CH 3: 11.441 10.626 5.660
 Tanjung Agas, Pekan CH1: 3.972 5.000 6.614
 CH 2: 7.522 5.502 7.776
 CH 3: 5.360 4.918 6.190

 Table 7 shows the quantification of difference between observed slope (NAHRIM) and estimated
slope (IFSAR and Google Earth). The equation below is used to determine the accuracy of the observed
value compared to the estimated value from satellite (IFSAR and Google Earth). The equation below is
used to calculate the difference as stated above.

 ( ) − ( )
 (%) = × 100
 ( )
 (Eq.3)

 Table 7. Cross Section of Beach Profile at Study Area from NAHRIM (2018).
 Observed Slope Estimated Slope d e f
 (a) (b) (c) (a-b) (a-c) (b-c)
 No Location
 NAHRIM IFSAR Google % Diff % Diff %Diff
 Earth
1 Pantai Cherating 4.504 4.818 4.237 -6.979 5.922 12.059
2 Kampung Sungai Ular 1.665 1.542 1.379 7.392 17.162 10.550
3 Pantai Rekreasi Air Balok 2.374 2.211 2.242 6.878 5.573 -1.402
4 Swiss Garden Resort 6.400 6.914 6.723 -8.040 -5.050 2.767
 Kuantan
5 Pantai Batu Hitam Berserah 3.464 3.234 3.824 6.642 -10.390 -18.244
6 Kampung Pantai Beserah 6.104 4.693 7.650 23.121 -25.324 -63.015
7 Taman Gelora 3.651 3.894 3.351 -6.649 8.223 13.945
8 Pantai Sepat 5.067 3.987 6.202 21.322 -22.391 -55.560
9 Cherok Paloh, Pekan 7.636 8.557 8.257 -12.064 -8.133 3.507
10 Tanjung Agas, Pekan 6.190 5.360 4.918 13.408 20.549 8.246

 Kampung Sungai Ular, Pantai Rekreasi Air Balok, and Swiss Garden Resort Kuantan indicated a
small % difference in slope, between -8.04% to 17.16%, compared to the other locations in the study
area. The wave that hits the shore loses its energy with not enough to cover a long and large surface area
of the beach.
 The highest difference was found in Kampung Pantai Beserah and Pantai Sepat with more than 20%
of slope difference between those data. Human activities such as mining, construction, and development
activities along the coast might have caused the higher erosion rate and coastal slope modification. In
addition, the difference in years of data acquisition period might have resulted in significantly different

 13
Sustainability and Resilience of Coastal Management (SRCM 2020) IOP Publishing
IOP Conf. Series: Earth and Environmental Science 799 (2021) 012005 doi:10.1088/1755-1315/799/1/012005

readings in those years (2010 and 2018). Based on Table 7, the difference in values of slope percentage
was slightly small with less than one percent of difference for each reading. It can be deduced that the
measurement using Google Earth can be used to determine the elevation height estimation apart from
the site data observation. The accuracy of data obtained from Google Earth was comparable and can be
used for further study.

3.4. Relationship Between Coastal Slope and Erosion Rate
A qualitative relationship between the erosion rate and slope percentage for the entire Kuantan coast
that stretches from Pantai Cherating to Tanjung Agas, Pekan was established. Table 8 shows the coastal
slope in percentage, the beach width and the beach material that was deposited on the sites. These three
factors are interrelated and have significant impacts on the erosion rate at several particular zones. The
first zone of Pantai Cherating has a short width of beach yet a steeper slope was observed compared to
Kampung Sungai Ular. From site observation, the shorter width of beach combined with the steep slope
might have resulted in higher erosion rate as the waves would hit more of the beach surface (Gracia,
2017). The energy from waves would directly wash the small surface area of the beach and carry away
the white fine sand thus making the zone eroded faster than Kampung Sungai Ular.
 The physical characteristics of the beach or geomorphology play an important role in analysing beach
erosion. Kampung Sungai Ular zone had lesser erosion per year as most of the beach was represented
by a flat beach with longer beach width. Kampung Sungai Ular also had a coarse and solid yellowish
sand beach in the front but white fine sand in the backshore area. This coarse sand present in the front
part of the beach made the waves dispersed more and the grains were heavy enough not to be carried
away when the waves had lost their energy. The waves would dissipate more to cover larger surface
area and the waves’ size depends on the wind speed (Mirzaei, Tangang and Juneng, 2014). Higher wind
speed would result in stronger waves hitting the shore. The physical profile of the beach helps to spread
the energy from the waves. White sandy beach in the backshore area was the result of erosion of coastal
dunes that were present in Kampung Sungai Ular. This area is a residential area and most of the activities
are fisheries which are considered to be less vulnerable to coastal erosion.
 In contrast, Pantai Rekreasi Air Balok had a coarse sand and the same goes to Pantai Batu Hitam
with gravel-like beach. For Pantai Rekreasi Air Balok, the width of the beach stretched for about 100 to
250 meter that made it suitable for recreational purposes. Based on the physical site visit, Pantai Air
Balok comprised flat and coarse sandy beach. Some geological feature such as large rock lied on the
front of the beach which helped to disperse and break the waves. Larger surface area of beach might
help to reduce coastal erosion and the beach slope of the area had not been significantly changed for a
long period of time. Meanwhile, Pantai Batu Hitam had a unique feature as there were multiple strips of
upward rocks that were present on the beach. The sand that was deposited on the beach was coarse sand
and the slope was also flat. Several mitigation features were constructed along three kilometers of the
beach to prevent the developed area, such as buildings, from sinking to the sea and also to protect a
recreational facility nearby.
 In addition, Taman Gelora zones were recorded to have a muddy beach in front and sandy beach in
the backshore zone. This area was also covered from direct wave and wind through the geographical
feature of Bukit Pelindung on the north side. The sediment that was carried from other higher zones was
deposited here making it nourished with the coarse sand. Some of the areas were covered with mangrove
but a major part of Taman Gelora was also critically eroded. A breakwater being constructed along the
coastline and some coastal walls to protect the residential area were observed. Taman Gelora had a
shorter beach width and steeper slope compared with Pantai Sepat. The shorter width of beach made the
erosion more aggressive instead of weak waves hitting the shore. However, rapid development of
recreational facility and resorts along Taman Gelora and Swiss Garden Resort might result in higher
erosion score in the upcoming years.

 14
Sustainability and Resilience of Coastal Management (SRCM 2020) IOP Publishing
IOP Conf. Series: Earth and Environmental Science 799 (2021) 012005 doi:10.1088/1755-1315/799/1/012005

Table 8. Qualitative assessment of erosion rate with slope and beach geomorphology (beach width,
beach slope and beach materials) along ten study locations.
 Erosion
 Google Earth Slope
 Zone Location Title IFSAR Slope (%) Rate
 (%)
 (m/year)
 1 Pantai Cherating Beach Slope (%) 4.81 - 5.348 4.237 - 5.952 5.692
 Beach Width (m) 50 - 100 40 -60
 Beach Material White fine sandy beach

 2 Kampung Sungai Beach Slope (%) 3.973 - 4.720 4.379 - 5.147 3.369
 Ular Beach Width (m) 50 - 140 65 -135
 Beach Material Back (White fine sand)
 Front (Yellowish brown course and solid
 texture)

 3 Pantai Rekreasi Beach Slope (%) 2.211 - 3.951 2.242 - 4.048 3.624
 Air Balok Beach Width (m) 50 - 75 40 - 60
 Beach Material Coarse sand (Grey-color)

 4 Swiss Garden Beach Slope (%) 6.332 - 9.336 6.482 - 8.605 6.270
 Resort Kuantan Beach Width (m) 45 - 75 50 - 65
 Beach Material White fine sandy beach

 5 Pantai Batu Hitam Beach Slope (%) 3.234 - 6.982 3.824 - 6.174 3.841
 Berserah Beach Width (m) 55 -135 50 - 90
 Beach Material Muddy and Gravel /Coarse Sand (Black color)

 6 Kampung Pantai Beach Slope (%) 3.023 - 7.693 3.363 - 7.650 3.973
 Beserah Beach Width (m) 65 - 100 80 - 95
 Beach Material Yellow fine sand (Back) Black muddy sand
 (Front)

 7 Taman Gelora Beach Slope (%) 3.894 - 7.595 3.894 - 7.595 4.550
 Beach Width (m) 45 - 115 50 - 80
 Beach Material Yellow fine sand (Back) Black muddy sand
 (Front)

 8 Pantai Sepat Beach Slope (%) 3.457 - 5.553 3.202 - 6.201 4.372
 Beach Width (m) 40 - 90 55 -75
 Beach Material White fine sandy beach

 9 Cherok Paloh, Beach Slope (%) 2.910 - 11.441 3.478 - 10.626 6.919
 Pekan Beach Width (m) 75 - 120 90 - 115
 Beach Material White sandy beach (Back) and Muddy sand
 (Front)

 10 Tanjung Agas, Beach Slope (%) 3.972 - 5.360 4.918 - 5.501 3.454
 Pekan Beach Width (m) 70 - 125 80 - 100
 Beach Material White sandy beach

 Cherok Paloh had the highest erosion score because of natural factors such as winds and currents that
were present there. Most of the beach was white sandy beach with protection from a river delta that
existed there. The river mouth kept changing and strong waves would hit them thus dragging the sand
away from its place. Strong waves and direct winds that hit the shore might have resulted in dynamic
coastal slope and critical erosion around the area.

 15
Sustainability and Resilience of Coastal Management (SRCM 2020) IOP Publishing
IOP Conf. Series: Earth and Environmental Science 799 (2021) 012005 doi:10.1088/1755-1315/799/1/012005

 It is generally known that the greatest beach profile changes occur along the ocean side. Therefore,
many studies have focused on open coast beaches in high-energy environments. Wave energy and
sediment transport rates on sandy beaches in very sheltered locations are much smaller than those on
ocean side beaches. Such a beach is termed a “low-energy beach”, characterized by calm conditions and
minimal non-storm wave heights (less than 0.25 m). Larger wave heights (less than 0.5 m) occur during
storms that drive onshore winds. Some studies of low-energy beaches point out the differences in the
characteristics and nature of beach profile compared with high energy beaches. Nonetheless, low-energy
beaches have generally been subsumed within existing policies that manage high-energy beaches.
Therefore, a prediction method for beach profile changes and sediment grain size distributions of low-
energy beaches is necessary.

4. Conclusion
Coastal areas are mostly important resources for most countries in the world for the purpose of physical
resources, wildlife, and protection against flooding, safety, and recreation. The changes of beach profile
characteristics along Pahang coastline were caused by the northeast monsoon and human activities
(Husain et al.). The beach profile measurement is an easy way to measure a beach cross-section, the
simplest expression of beach morphology. The output of this study so far provided additional
information about the geomorphology and rate of erosion and accretion characteristics of Pahang coast.
The total length of coastline changes is about 14 km (14035.10 m) with totaling up to 205.66 hectares
that had been eroded along 103 kilometers stretching from Cherating to Pekan. The research found that
eight area out of 196 or 39.7% locations were eroded and being categorized as acceptable erosion
category (K3), 64 area or 32.7 % had significant erosion category (K2) where the coastline retreated
more than 1 meter per year, and the most critical eroded area, K1, were 54 sites or 27.6% of the sites.
Cherating, Swiss Garden Resort, and Cherok Paloh were among those with the highest erosion rates
from -5.692 to -6.919 m/year. Meanwhile, the highest rate of accretion value was indicated in Tanjung
Agas at 7.391 m/year. A qualitative study of relationship between the erosion rate and slope percentage
for the entire Kuantan coast stretching from Pantai Cherating to Tanjung Agas, Pekan indicated that the
coastal slope percentage, the beach width, and the beach material deposited on the sites were interrelated
and provided significant impacts to the erosion or accretion rates on several particular zones in Kuantan
coastlines. Further study can be done to increase an understanding of the hydrodynamic parameters and
numerical modeling effects towards the coastal area and coastal community. The findings from
monitoring coastline changes and identifying vulnerable erosion areas might be useful in the policy and
decision making for sustainable coastal management.

Acknowledgments
The authors wish to thank the lecturers and staff of the Centre of Studies Surveying Science and
Geomatics, UiTM Shah Alam for suggestions and comments on the improvement of the research. The
study was funded by UiTM internal LESTARI SDG grant 600-RMC/LESTARI SDG-T 5/3 (113/2019).

References
[1] Akhir, M.F., and Jawchuen Y. (2011). Seasonal variation of water characteristics during
 intermonsoon along the East Coast of Johor. Journal of Sustainability Science and
 Management 6(2):206-214
[2] Andrade, F., & Ferreira, M. A. (2006). A simple method of measuring beach profiles. Journal of
 Coastal Research, 995-999.
[3] Ariffin, E. H., Sedrati, M., Akhir, M. F., Yaacob, R., & Husain, M. L. (2016). Open Sandy Beach
 Morphology and Morphodynamic as Response to Seasonal Monsoon in Kuala Terengganu,
 Malaysia. Journal of Coastal Research, 75(sp1), 1032-1036.
[4] Ghazali, N. H. M. (2006). Coastal erosion and reclamation in Malaysia. Aquatic Ecosystem Health
 & Management, 9(2), 237-247.
[5] Gracia, C. A., Rangel-Buitrago, N., Oakley, J. A., & Williams, A. (2017). Use of ecosystems in

 16
Sustainability and Resilience of Coastal Management (SRCM 2020) IOP Publishing
IOP Conf. Series: Earth and Environmental Science 799 (2021) 012005 doi:10.1088/1755-1315/799/1/012005

 coastal erosion management. Ocean & Coastal Management.
[6] Husain, M. L., Yaakob, R., & Saad, S. (1995). Beach erosion variability during a northeast
 monsoon: the Kuala Setiu coastline, Terengganu, Malaysia. Pertanika Journal of Science and
 Technology, 3(2), 337-348.
[7] Labuz, T. A. (2016). A review of field methods to survey coastal dunes—experience based on
 research from South Baltic coast. Journal of Coastal Conservation, 20(2), 175-190.
[8] Lillesand, T. M., R. W. Kiefer, and J. W. Chipman (2004). Remote sensing and image
 interpretation: John Wiley & Sons Ltd.
[9] Mirzaei, A., Tangang, F., & Juneng, L. (2014). Wave energy potential along the east coast of
 Peninsular Malaysia. Energy, 68, 722-734.
[10] Mohamad, M. F., Lee, L. H., & Samion, M. K. H. (2014). Coastal vulnerability assessment
 towards sustainable management of Peninsular Malaysia coastline. International Journal of
 Environmental Science and Development, 5(6), 533.
[11] Mohd, F.A., Maulud K.M.A., Begum R.A.,Selamat S.N., Karim O.A. (2018). Impact of Shoreline
 Changes to Pahang Coastal Area by Using Geospatial Technology. Sains Malaysiana 47
 (5)(2018): 991–997
[12] Mustapaa, M. Z., Saada, S., Abdul, M. S., Hadib, K. Y., & Saponc, N. (2015). Beach –Face
 Morphodynamics of Different Morpholocgical Setting Along Teluk Chempedak to Kuala
 Pahang, Malaysia. Jurnal Teknologi, 77(25), 51-56.
[13] Pile, J., Gouramanis, C., Switzer, A. D., Rush, B., Reynolds, I., & Soria, J. L. A. (2017). Can the
 risk of coastal hazards be better communicated?. International Journal of Disaster Risk
 Reduction.

 17
You can also read