Using geographic information systems to map older people's emergency department attendance for future health planning
←
→
Page content transcription
If your browser does not render page correctly, please read the page content below
Original article
Emerg Med J: first published as 10.1136/emermed-2018-207952 on 2 November 2019. Downloaded from http://emj.bmj.com/ on January 24, 2021 by guest. Protected by copyright.
Using geographic information systems to map older
people’s emergency department attendance for
future health planning
Eoin O’Mahony ,1 Éidín Ní Shé,2 Jade Bailey,3 Hasheem Mannan,2 Eilish McAuliffe,2
John Ryan,4,5 John Cronin,5 Marie Therese Cooney5
1
The School of Geography, Abstract
University College Dublin, Objectives This study aimed to assess the pattern of Key messages
Dublin, Ireland
2
School of Nursing, Midwifery use of EDs, factors contributing to the visits, geographical
and Health Systems, University distribution and outcomes in people aged 65 years or What is already known on this subject?
College Dublin, Dublin, Ireland older to a large hospital in Dublin. ►► The main point of entry to the acute healthcare
3
School of Medicine, Health Methods A retrospective analysis of 2 years of data system in Ireland is the ED and there is little
Sciences Centre, University variation in this among different age cohorts.
from an urban university teaching hospital ED in the
College Dublin, University Geographic information systems (GIS), while
College Dublin, Dublin, Ireland southern part of Dublin was reviewed for the period
4
University College Dublin 2014–2015 (n=103 022) to capture the records of common in other research, are rarely used in
School of Medicine and Medical attenders. All ED presentations by individuals 65 years aiding health planners and physicians for ED
Science, Dublin, Ireland and older were extracted for analysis. Address-matched services, particularly when analysing older age
5
Department of Emergency cohorts.
Medicine, St Vincent’s University records were analysed using QGIS, a geographic
Hospital, Dublin, Ireland information systems (GIS) analysis and visualisation tool
to determine straight-line distances travelled to the ED What this study adds?
►► Using GIS, we found a high level of clustering
Correspondence to by age.
Dr Eoin O’Mahony, Geography, Results Of the 49 538 non-duplicate presentations of ED presentations in the Dublin area and
University College Dublin, in the main database, 49.9% of the total are women the wider region, with some difference in
Dublin 4, Ireland;
and 49.1% are men. A subset comprised of 40 801 spatial patterns based on age. Older patients
eoin.omahony@u cd.ie are travelling shorter distances, on average,
had address-matched records. When mapped, the data
Received 10 July 2018 showed a distinct clustering of addresses around the based on an analysis of mean straight-line
Revised 2 October 2019 hospital site but this clustering shows different patterns distances. This suggests that the ability of the
Accepted 7 October 2019
based on age cohort. Average distances travelled to older population to reach medical care must
ED are shorter for people 65 and older compared with be considered in planning configuration of
younger patients. Average distances travelled for those services.
aged 65–74 was 21 km (n=4177 presentations); for
the age group 75–84, 18 km (n=2518 presentations)
in the older population has raised concerns as to
and 13 km for those aged 85 and older (n=2104
whether the health service will be able to cope with
presentations). This is validated by statistical tests on
the projected increased demand with attention
the clustered data. Self-referral rates of about 60%
focused on identifying the best pathway for treating
were recorded for each age group, although this varied
older patients.6 7
slightly, not significantly, with age.
In other national contexts, there are primary
Conclusions Health planning at a regional level should
healthcare settings other than a hospital’s ED
account for the significant number of older patients
where older people receive the medical care they
attending EDs. The use of GIS for health planning
need; this is not the case in Ireland.8 In Ireland,
in particular can assist hospitals to improve their
the ED is the ‘front door’ of admission to the acute
understanding of the origin of the cohort of older ED
hospital and patients over 65 years account for a
patients.
growing proportion of ED attendance.8 9 To enable
better and appropriate health planning, we sought
to understand more about the referral patterns and
Introduction locations from which older patients attend EDs.
© Author(s) (or their Ireland’s recent census data show that the popu- In trying to understand the patterns for the
employer(s)) 2019. Re-use lation over 65 years increased by 19.1% in 2016 origins of ED patients, older persons’ access to EDs
permitted under CC BY-NC. No since the previous 2011 census.1 Life expectancy is important and within this, their own mobility is
commercial re-use. See rights
and permissions. Published continues to increase above the EU average for central.10–12 Mobility is the ability and opportunity
by BMJ. both men (79.6 years) and women (83.4 years), to physically move oneself, either independently
illustrating the ongoing socioeconomic advances or with assistive devices or transportation, to get
To cite: O’Mahony E,
and benefits of extended healthcare provision.2–4 to places one wants or needs to go to.13 One way
Ní Shé É, Bailey J, et al.
Emerg Med J Epub ahead A majority of older people (75%) in Ireland self- to analyse this is by using geographic information
of print: [please include Day reported that they rate their health as good, very systems (GIS) which provide a set of tools to inter-
Month Year]. doi:10.1136/ good or excellent, and are actively involved with pret and visualise geographical data to reveal rela-
emermed-2018-207952 their local communities and families.5 This increase tionships and trends.14 Spatially referencing data
O'Mahony E, et al. Emerg Med J 2019;0:1–6. doi:10.1136/emermed-2018-207952 1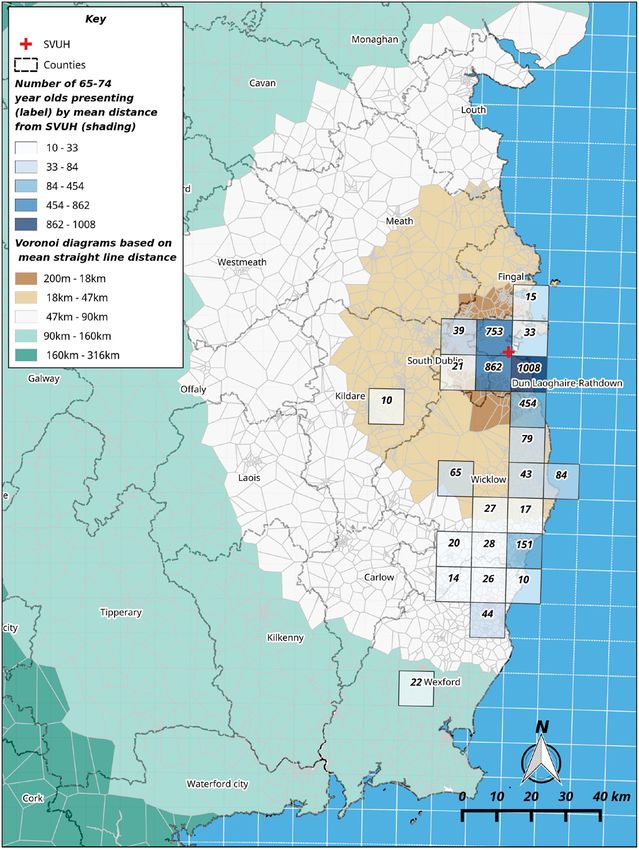
Original article
Emerg Med J: first published as 10.1136/emermed-2018-207952 on 2 November 2019. Downloaded from http://emj.bmj.com/ on January 24, 2021 by guest. Protected by copyright.
Table 2 Triage categories by percentage for ED presentations
for 2014 and 2015; percentages and numbers are of the total
presentations for each year
Triage category* 2014 2015 Totals
1: Immediate 0.7 (180) 0.6 (156) 336
2: Very urgent 23.4 (5884) 24.8 (6077) 11 961
3: Urgent 56.2 (14 060) 57.0 (13 697) 27 757
4: Standard 18.5 (4641) 16.3 (3989) 8630
5: Non-urgent 0.3 (69) 0.1 (35) 104
6: Not recorded 0.9 (233) 1.2 (287) 520
Total 25 027 24 511 49 538
*The Manchester Triage System.22
Methods
Setting
This retrospective study examines the presentations to the ED
of St. Vincent’s University Hospital (SVUH) a level 4 teaching
hospital in the south Dublin area. The department provides Emer-
gency Medicine to a catchment population of 300 000 people
from inner Dublin City to north Wexford, about 60 km south. It
is bordered by the sea to the east and the functional catchment
area extends west for 6 km and further south again. SVUH is one
of six-level four urban acute teaching hospitals located in county
Dublin. These are the Mater Hospital, Beaumont Hospital on
the northside of the city, St. James’s Hospital in the west of the
city centre, Tallaght Hospital in the south west, James Connolly
Memorial Hospital in the western suburbs. SVUH is presently
part of the Ireland East Hospital Group (IEHG) comprising 11
Figure 1 The data workflow. MRN, medical record number. hospitals spanning eight counties which serves a population of
1.1 million.
allow one to pose and answer questions and identify potential Participants and procedures
solutions to problems. Social scientists, epidemiologists and All ED presentations in the two calendar years of 2014 and 2015
clinicians have been using GIS for a long time to understand the and from all age groups were eligible for inclusion. Data were
distribution and causes of illness, and the use of resources across derived from the clinical and administrative records from each
patient presentation. Each patient is assigned a medical record
countries and regions.15 16 Researchers using GIS frequently
number (MRN), which they retain throughout their time inter-
employ thematic maps which use statistics associated with a
acting with SVUH. For patients who presented on more than
particular geographical area and show how these are related to
one occasion during the study period, just one presentation was
other services and data.17 This type of mapping may be useful included in the analysis. Using OpenRefine (a data cleaner and
for planning of health services in a region and allows for anal- parser), the duplicate MRN presentations were identified and
ysis that takes into account the distance from the ED and other discarded. The home address for each patient is recorded at ED,
factors.16 including those coming from locations other than home. These
The objective of this study was to demonstrate how GIS can were extracted as address fields and machine-read as latitude and
be used to map the origin of patients presenting to a busy adult longitude data.
ED of the Dublin region. We sought to demonstrate if there is a Only non-duplicate presentations for calendar years 2014 and
difference in the median distances travelled based on age groups, 2015 and a second and smaller address-matched database are
if there are any differences in the geographical pattern of atten- included in this study. Figure 1 shows the representation of the
dances of the older and younger patients. workflow to derive a database that was suitable for spatial anal-
ysis. The address-matched records were analysed using QGIS,
a commonly used GIS application that allows for the ingestion,
analysis and visualisation of spatially referenced data. In this
Table 1 Recoded age cohorts by percentage for 2014 and 2015; way, we are able to analyse our data alongside socioeconomic
percentages and numbers are of the total presentations for each year data from other sources to examine the factors associated with
Age 2014 2015 Totals self-referral among the older age population.
64 and younger 75.2 (18 673) 76.3 (18 597) 37 270
From this address-matched subset, we extracted all patient
records aged 65 years and older (figure 1). Wishing to understand
65–74 10.1 (2507) 10.4 (2531) 5038
any age-based differences, the subset was further subdivided into
75–84 8.7 (2156) 8.5 (2803) 4959
three smaller groups: 65–74, 75–84, and 85 and older. These
85 and older 6.1 (1508) 4.7 (1156) 2664
correspond with the older age categories used by the Central
Total presentations 25 027 24 511 49 538
Statistics Office, Ireland. Once the main and address-matched
2 O'Mahony E, et al. Emerg Med J 2019;0:1–6. doi:10.1136/emermed-2018-207952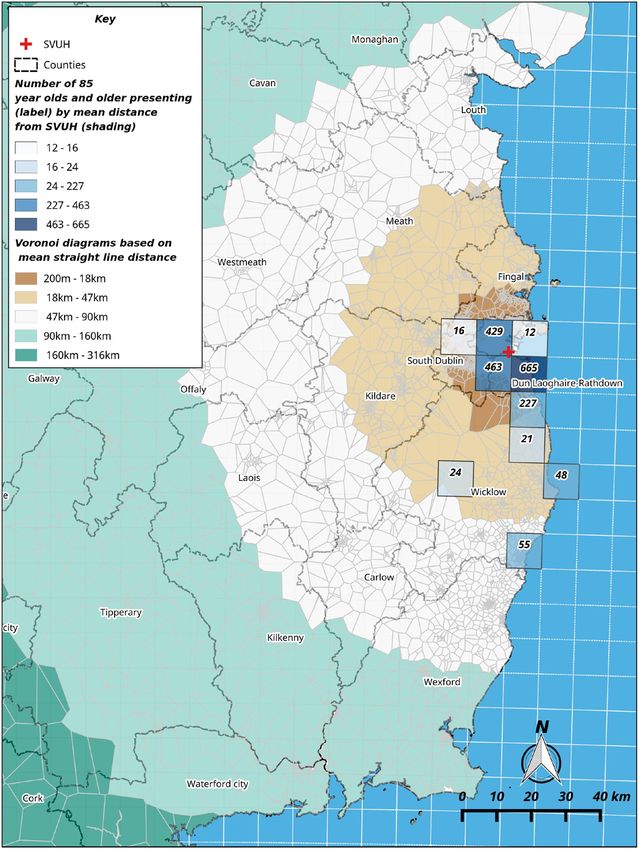
Original article
Emerg Med J: first published as 10.1136/emermed-2018-207952 on 2 November 2019. Downloaded from http://emj.bmj.com/ on January 24, 2021 by guest. Protected by copyright.
Table 3 Percentage of each age group by triage category; percentages and numbers are of the total in each age group by triage category, that is,
column-based N in parentheses
Age 1: Immediate 2: Very urgent 3: Urgent 4: Standard 5: Non-urgent 6: not recorded
64 and younger 0.4 (166) 21.2 (7906) 57.9 (21 561) 19.3 (7183) 0.2 (79) 1.0 (375)
65–74 0.9 (46) 32.2 (1621) 52.8 (2659) 13.2 (664) 0.2 (12) 0.7 (36)
75–84 1.5 (63) 32.8 (1392) 53.6 (2274) 11.3 (479) 0.2 (7) 0.6 (24)
85 and older 2.1 (55) 34.9 (929) 51.8 (1379) 10.2 (272) 0.2 (6) 0.9 (23)
Total 0.7 (330) 24.1 (11 848) 56.6 (27 873) 17.5 (8598) 0.2 (104) 0.9 (458)
databases are created, no name or address details are retained this score tends to −1 and some clustering when it tends to +1.
to protect the anonymity of the patient. All patient data were This statistical test is presented for each over 65 years subgroup.
stored on a removable drive and stored securely. Records with
an address-matched MRN were compared with those without
and it was found that no significant statistical difference could be Outcomes
detected between these two groups with regard to age and other We determined the proportion of patients in each age group
demographic variables. attending the ED, their acuities and the location of the incident
No name or address details were retained to protect the that brought them to the ED. We determined whether patients
anonymity of the patient. were self-referred or referred by a physician; patients who are
referred in this context means that if a patient enters the ED
Analysis having already seen a general practitioner (GP), they would have
For the basic analysis of these data, we used SPSS Statistics V.24. had a referral letter and a consequent reduction in the charge
The dataset was grouped by year for comparative purposes at levied in the ED. The differences in straight-line distance of each
the initial stage. As the address-matching process joined data patient from the ED was examined, and the mean distance was
between two tables where a match occurred, the address- calculated for the three different age cohorts.
matched data thus had all other ED presentation data aligned The differences in straight-line distance of each patient from
within each record such that the demographic, triage and admis- the ED for each of these smaller groups were examined.
sion data could be analysed spatially. No individual point data
are represented throughout this analysis but instead we gener-
alise the deidentified data using a derived 10 km grid square Results
(provided by the national statistical agency, the Central Statistics There were 103 022 recorded presentations in all age groups
Office). These are a uniform aerial unit to visualise the spatial during the study period. Once duplicate MRNs were discarded,
differences in the deidentified presentations on a consistent we were left with 49 538 records. Of these 49 538 records,
basis for each age cohort. All points that fall within this grid 49.9% of the total are women and 49.1% were men (a tiny frac-
square are considered within that area. These data can be then tion went unrecorded); this mirrors the gender breakdown for
graduated in different modes within QGIS. Our analysis here is Irish society as a whole.1 While this paper is concerned with
based on Jenks natural breaks to minimise variability between older age groups, we sought to highlight the differences between
and within the gradations of data. Only those grid squares with the study group and the total population served by the hospital
totals equal to or greater than 10 are represented to further safe- and so have included these data. Of the 49 538 non-duplicate
guard patient anonymity. Accompanying Voronoi diagrams are presentations, 75.7% are aged 64 years or younger with 10.2%
based on all spatially referenced data and show banded metric aged between 65 and 74, 8.6% aged between 75 and 84, and
distances from SVUH. To add to our analysis, we measured the 5.4% aged 85 years and older (table 1). Table 2 shows the triage
spatial autocorrelation of the data, used a nearest neighbour category data for each age category, with approximately two-
analysis (to examine the distribution of points) and Moran’s I as thirds of each year’s presentations designated as urgent or very
a means of detecting any patterns. When points are dispersed, urgent.
Table 4 Selected referral routes by age cohort for 2014 and 2015; percentages and numbers are of the total in each referral route by year, that is,
column-based N in parentheses
Age GP Self-referral Other incl. other doctor
2014 2015 2014 2015 2014 2015
%, N %. N %, N %, N %, N %, N
64 and younger 22.4 (4190) 22.6 63.5 (11 859) 62.5 (11 631) 9.6 9.6
(4196) (1786) (1789)
65–74 26.8 27.2 58.0 (1454) 56.3 (1424) 9.1 9.6
(672) (688) (228) (243)
75–84 23.2 23.2 58.7 (1266) 58.8 (1225) 11.1 10.1
(501) (483) (240) (210)
85 and older 16.0 17.6 59.6 57.4 17.8 18.3
(242) (204) (899) (663) (268) (212)
Total 22.6 (5605) 22.9 (5571) 62.3 (15 478) 61.3 (14 943) 10.1 (2522) 10.1
(2454)
GP, general practitioner.
O'Mahony E, et al. Emerg Med J 2019;0:1–6. doi:10.1136/emermed-2018-207952 3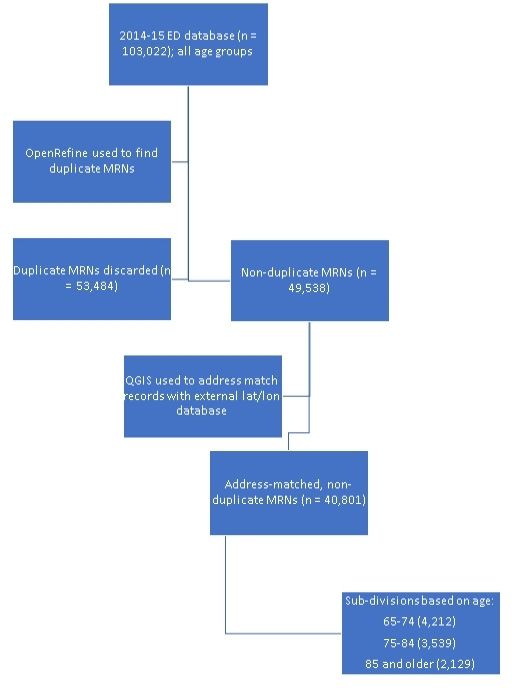
Original article
Emerg Med J: first published as 10.1136/emermed-2018-207952 on 2 November 2019. Downloaded from http://emj.bmj.com/ on January 24, 2021 by guest. Protected by copyright.
Table 5 Location of incident by age cohort for 2014 and 2015; percentages and numbers are of the total in each location by year, that is, column-
based N in parentheses
Home Nursing home Public place Other
Age 2014 2015 2014 2015 2014 2015 2014 2015
64 and younger 62.7 (11 714) 64.0 (11 895) 0.2 (31) 0.1 (25) 14.3 (2669) 14.2 (2644) 4.7 (881) 4.0 (752)
65–74 79.3 (1988) 80.1 (2027) 0.9 (23) 1.5 (38) 11.3 (283) 10.7 (271) 5.3 (133) 5.0 (127)
75–84 77.3 (1666) 78.7 (1639) 4.6 (100) 4.7 (97) 10.9 (235) 10.5 (218) 5.1 (111) 4.6 (95)
85 and older 68.5 (1033) 67.8 (784) 17.0 (257) 18.7 (216) 8.7 (131) 7.4 (85) 4.3 (65) 4.8 (55)
Total 66.0 (16 401) 67.1 (16 345 1.7 (411) 1.5 (376) 13.4 (3318) 13.2 (3218) 4.8 (1190) 4.2 (1029)
Triage category is decided on arrival to the ED. Approximately Between 75% and 90% of the presentations in both years come
one-fifth (21.2%) of those aged 64 and younger were considered from either home or a public place (table 5). The remainder are
in the very urgent category, whereas over one-third (34.9%) of from work or a leisure area. Over 60% of incidents occurred at
those aged 85 and older were very urgent or immediate (table 3). home for all age groups, but with a larger proportion of events
Of note, however, at this point is the slight divergence in propor- at home for those over 65. The difference in events occurring
tions for the urgent category across all four age groups. These in the home location is most marked between those 64 and
data are examined by year to show consistency across the 2 years younger compared with the older cohorts, and for nursing
of the data. For all cross-tabulated data, the χ2 score is 0.00. homes, between those aged greater than 85.
Most patients in all age groups were self-referred. Between
one-fifth and one-quarter (11 176) of all patients who presented
each year were referred by their GP and a further 10% each year Age-based spatial analysis using GIS
by another doctor or a doctor on call in the area. As shown in In this section, we see if there are any spatial differences
table 4, there was a slightly smaller proportion of self-referrals between the different age groups and their distance from ED.
and more GP referrals among patients aged 65–84, those in the As previously mentioned, among those 65 and older, we have
oldest age cohort had a higher proportion of referrals through divided the address-matched data into three subgroups: those
other sources. aged between 65 and 74, totalling 4212 presentations; those
aged between 75 and 84, totalling 3539 presentations; and
those aged 85 and over, totalling 2129 presentations for the
2-year period. We mapped the distance to St. Vincent’s Univer-
sity ED for each age cohort. While the colour gradations are
chosen to aid visual interpretation, they indicate a banding of
the data into discrete categories. Care should be taken here in
the interpretation of the colour shading as the category grada-
tions differ across the age groups. For example, the largest
group in the younger age cohort ranged between 862 and 1008
people (figure 2), while in the oldest age cohort, the largest
numbers ranged between 463 and 665 people (figure 3). Each
grid square represents a straight-line distance of 10 km, we can
note intracohort differences.
As shown in figure 2, for the 65–74 age cohort, large numbers
of patients come from within a distance of 10 km from the
hospital, in particular the neighbourhoods directly south of the
site. The hospital also draws patients in this age cohort from
home addresses in the city centre in spite of other EDs being
available within the city area, for example, St. James’s and the
Mater hospitals. Patients with home addresses in mid-Wicklow
and south-Wicklow (approximately 45 km from SVUH) are also
numerous, as indicated by the third gradation of blue in the
map above. Small numbers of people in this age cohort come
from addresses in south County Wicklow to the south and small
numbers from mid-Kildare in the southwest.
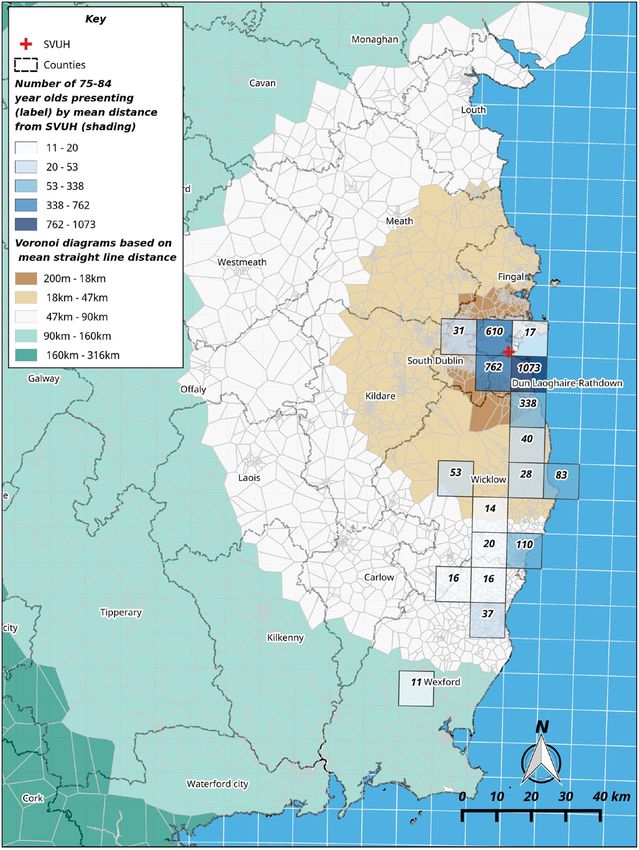
For the 75–84 age cohort, the numbers with addresses from
directly south of the hospital are still large but numbers also begin
at addresses further south and from the more mountainous part
of County Wicklow, despite the lack of public transport options.
As figure 4 shows, these mid-Wicklow patients are approximately
45 km from SVUH. More notable is the almost complete absence
of people in this age cohort from home addresses of a similar
Figure 2 The number of ED presentations in the cohort aged 65–74 straight-line distance in County Kildare. This may be accounted
years old and all presentation distance from St. Vincent’s University for by the availability of other EDs (for which we have no data)
Hospital (SVUH). in that county.
4 O'Mahony E, et al. Emerg Med J 2019;0:1–6. doi:10.1136/emermed-2018-207952Original article
Emerg Med J: first published as 10.1136/emermed-2018-207952 on 2 November 2019. Downloaded from http://emj.bmj.com/ on January 24, 2021 by guest. Protected by copyright.
Figure 3 The number of ED presentations in the cohort aged 85 years Figure 4 The number of ED presentations in the cohort aged 75–84
and older and all presentation distance from St. Vincent’s University years old and all presentation distance from St. Vincent’s University
Hospital (SVUH). Hospital (SVUH).
methodology to establish geographical factors on utilisation
Finally, for those aged 85 and older, we can see a slightly patterns across the IEHG consisting of 11 hospitals and serving
different pattern of patient origins. Figure 3 shows that many over 1 million people. We found a high level of clustering of
hundreds are coming from the immediate area (within 10 km) patient home addresses in the Dublin area and the wider region,
but about 50 patients each are coming from addresses in the with some difference in spatial patterns based on age. In partic-
towns of Arklow and Wicklow to the ED in south Dublin (a ular, older patients travel shorter distances on average, based
distance between 45 and 50 km). on mean straight-line distance from their home address. In the
The statistical evidence shows that there is a high degree of absence of the location data for other primary healthcare facil-
clustering for each of the age cohorts’ addresses. This means that ities, distance from a home address to the ED does not seem
patients in each age cohort originate from addresses close to each to be of great significance for the 65–74 year old cohort when
other and travel similar distances to those in their own cohort. compared with the cohorts of 75 years and older.
There is little change in the Moran’s I score for any group when Although not examined here in detail, self- referral is high
compared. The mean straight- line distance travelled declines among all age cohorts, ranging between 59% and 65% of all
with age and among those aged 85 and older, the distance ED presentations. There is a need for further mapping of these
travelled is averaged at 13 km. This is 7.8 km fewer than those self-referrals to the location of GP practices and their interaction
aged between 65 and 74. As suggested in the fourth column,
table 6, even for older age groups, supports in the community
are by-passed and these people present to the ED regardless of Table 6 Summary of distance and clustering data for the three oldest
their distance from it. age cohorts for the spatially referenced data
Z scores for these data are high (45.7, 44.5 and 43.9, respec- Nearest
tively), suggesting that we can reject the null hypothesis that neighbour
there is no clustering; the p-values are statistically significant. index (observed
The Moran’s I scores suggest that there is a relatively high level Mean straight mean distance/
of spatial autocorrelation in these data. line distance expected mean No. of
Age travelled (km) distance) Moran’s I presentations
65–74 20.8 0.19 0.42 4177
Discussion
The use of GIS in investigating the relative importance of 75–84 17.9 0.18 0.39 2518
geographical factors on utilisation patterns has been previ- 85 and older 13.0 0.15 0.39 2104
ously advocated.18–21 This single hospital study outlines the Note: p-value for Moran’s I isOriginal article
Emerg Med J: first published as 10.1136/emermed-2018-207952 on 2 November 2019. Downloaded from http://emj.bmj.com/ on January 24, 2021 by guest. Protected by copyright.
with nearby EDs. Furthermore, work on the modes of transpor- Open access This is an open access article distributed in accordance with the
tation among the self-referred cohorts (eg, those who perhaps Creative Commons Attribution Non Commercial (CC BY-NC 4.0) license, which
permits others to distribute, remix, adapt, build upon this work non-commercially,
by-passed a GP en route to hospital) is needed to understand and license their derivative works on different terms, provided the original work is
mobility patterns among older patients and how this can properly cited, appropriate credit is given, any changes made indicated, and the use
contribute to the planning of health resources. For older age is non-commercial. See: http://creativecommons.org/licenses/by-nc/4.0/.
groups, distance travelled to the ED is lower but greater numbers
ORCID iD
come from nursing home settings. Eoin O’Mahony http://orcid.org/0000-0002-2312-6621
Our study has several limitations. The analysis presented does
not take into account the mode of travel for these ED presenta-
References
tions. Nor have we factored in the distance from other primary 1 Central Statistics Office. Census 2016 summary results - part 1. Dublin: CSO 2017.
healthcare facilities. Furthermore, we have only analysed the Available: https://www.cso.ie/en/media/csoie/newsevents/documents/c ensus2016su
mean straight-line distance from the point of the hospital site. mmaryresultspart1/Censu s2016SummaryPart1.pdf [Accessed 19 Jun 2018].
Road and other transport networks are not a factor in the 2 OECD/European Observatory on Health Systems and Policies. Ireland: country health
profile 2017, state of health in the EU. Paris: OECD, 2017. Available: https://ec.
measurement of the distance travelled from their address by each europa.eu/health/s ites/health/fi les/state/docs/chp_ir_english.pdf [Accessed 19 Jun
age cohort. It would be interesting to understand any differences 2018].
in distance travelled based on other hospital catchment areas, 3 Committee on the Future of Healthcare. Sláintecare report. Dublin: houses of the
but this is beyond the scope of the current study. We have also Oireachtas, 2017. Available: https://webarchive.o ireachtas.ie/parliament/media/
committees/futureofhealthcare/oireachtas-c ommittee-on-t he-future-o f-healthcare-
been able to spatially identify a proportion of the total number slaintecare-report-300517.pdf [Accessed 15 Jun 2018].
of presentations because of the MRN-matching record process. 4 Burke S, Pentony S. Eliminating health inequalities: a matter of life and death. Dublin:
The difference between MRN-matched and non-MRN-matched TASC 2011. Available: http://www.lenus.ie/hse/handle/10147/301846 [Accessed 26
data with regard to demographic and age-related data does not Mar 2018].
5 Cronin H, O’Regan C, Kenny RA. Chapter 5: physical and behavioural health of older
show great statistical differences but we would like to explore
Irish adults. in: fifty plus in Ireland 2011: first results from the Irish longitudinal study
the ways in which a greater proportion of ED presentations can on ageing. Dublin: TILDA 2011:73-154. Available: https://t ilda.tcd.ie/publications/
be spatially referenced in the manner outlined above. We feel reports/pdf/w1-key-findings-r eport/Chapter5.p df [Accessed 15 Jun 2018].
that such a comparative analysis across the region would yield 6 Health Service Executive. Emergency department Task force report. Dublin: HSE, 2015.
significant results in how health resources across that region Available: https://health.gov.ie/blog/publications/e mergency-department-task-force-
report/ [Accessed 15 Jun 2018].
could be planned for and allocated. 7 HSE. National clinical programme for older people. specialist geriatric services model
An implication of our study is that health planning and any of care, 2012. Available: https://www.h se.ie/eng/services/p ublications/clinical-
service reconfiguration at a regional level must take account of strategy-a nd-programmes/specialist-geriatric-services-model-o f-care.pdf [Accessed 19
the significant number of older patients attending an ED before Jun 2018].
8 McLoughlin J. The case for a radical overhaul of the care pathways for the elderly in
their GP. Through the use of a spatial analysis and in particular the emergency department. Dublin: Special Delivery Unit, 2014.
the analysis here of mean straight-line distances for individual 9 Naughton C, Drennan J, Treacy P, et al. The role of health and non-health-related
patients suggests that older patients travel shorter distances and factors in repeat emergency department visits in an elderly urban population. Emerg
in smaller numbers than their younger neighbours. Our work Med J 2010;27:683–7.
10 Aminzadeh F, Dalziel WB. Older adults in the emergency department: a systematic
gives some insight into how changes to healthcare provision
review of patterns of use, adverse outcomes, and effectiveness of interventions. Ann
in an area like this could be impacted. We may have to further Emerg Med 2002;39:238–47.
examine the ways in which distance influences age-based utilisa- 11 Brouns SHA, Wachelder JJ, Jonkers FS, et al. Outcome of elderly emergency
tion and interactions in a network of hospitals and non-hospital department patients hospitalised on weekends - a retrospective cohort study. BMC
primary health services. Further work on self-referral cases is Emerg Med 2018;18:9.
12 McCabe JJ, Kennelly SP. Acute care of older patients in the emergency department:
now being conducted on these data. We believe that this form of strategies to improve patient outcomes. Open Access Emerg Med 2015;7:45–54.
geospatial analysis would be central to this. 13 Byrne DG, Chung SL, Bennett K, et al. Age and outcome in acute emergency medical
admissions. Age Ageing 2010;39:694–8.
Correction notice Since this article was first published online, affiliation 1 has 14 Meijering L, Weitkamp G. Numbers and narratives: developing a mixed-methods
been updated to read the School of Geography. approach to understand mobility in later life. Soc Sci Med 2016;168:200–6.
15 Henneman PL, Garb JL, Capraro GA, et al. Geography and travel distance impact
Acknowledgements The research team acknowledges the inputs shared on the emergency department visits. J Emerg Med 2011;40:333–9.
data by the St. Vincent’s University Hospital ED staff. 16 McMeekin P, Gray J, Ford GA, et al. A comparison of actual versus predicted
Contributors All the authors have made significant intellectual or practical emergency ambulance journey times using generic geographic information system
contributions towards the development of the geographic information systems software. Emerg Med J 2014;31:758–62.
review. EO’M and ÉNS drafted the manuscript and all authors read, edited and 17 Franke T, Winters M, McKay H, et al. A grounded visualization approach to explore
approved the final manuscript. sociospatial and temporal complexities of older adults’ mobility. Soc Sci Med
2017;193:59–69.
Funding Supported by grant from the Health Research Board for the Systematic 18 Fishman J, McLafferty S, Galanter W. Does spatial access to primary care affect
Approach for Improving care for Frail Older People (SAFE) study under the Applied emergency department utilization for nonemergent conditions? Health Serv Res
Partnership Award Grant No. (APA-2016–1857). 2018;53:489–508.
Competing interests None declared. 19 Higgs G. The role of GIS for health utilization studies: literature review. Health Services
and Outcomes Research Methodology 2009;9:84–99.
Patient consent for publication Not required. 20 Lee DC, Doran KM, Polsky D, et al. Geographic variation in the demand for emergency
Ethics approval Ethical approval to conduct the study was provided by St. care: a local population-level analysis. Health Care 2016;4:98–103.
Vincent’s Healthcare Ethics and Research Committee on 15 February 2017 (Ref 21 Mullner RM, Chung K, Croke KG, et al. Introduction: geographic information systems
SAFE: 23/2/17). in public health and medicine. J Med Syst 2004;28:215–21.
22 Parenti N, Reggiani MLB, Iannone P, et al. A systematic review on the validity and
Provenance and peer review Not commissioned; externally peer reviewed.
reliability of an emergency department triage scale, the Manchester triage system. Int
Data availability statement No data are available. J Nurs Stud 2014;51:1062–9.
6 O'Mahony E, et al. Emerg Med J 2019;0:1–6. doi:10.1136/emermed-2018-207952You can also read