Tobacco Production and Trade in Africa - STATUS OF - WHO | World Health ...
←
→
Page content transcription
If your browser does not render page correctly, please read the page content below

S TAT U S O F

Tobacco Production and
    Trade in Africa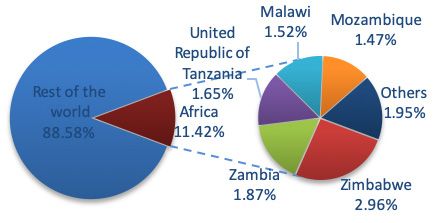
StaStatus of tobacco production and trade in Africa
This publication is the update of the manuscript published in 2015
entitled “Status of tobacco production and trade in Africa: factsheets”.

ISBN 978-92-4-002000-9 (electronic version)
ISBN 978-92-4-002001-6 (print version)

                                             © World Health Organization 2021
Some rights reserved. This work is available under the Creative Commons Attribution-NonCommercial-ShareAlike
3.0 IGO licence (CC BY-NC-SA 3.0 IGO; https://creativecommons.org/licenses/by-nc-sa/3.0/igo).
 Under the terms of this licence, you may copy, redistribute and adapt the work for non-commercial purposes,
 provided the work is appropriately cited, as indicated below. In any use of this work, there should be no suggestion
 that WHO endorses any specific organization, products or services. The use of the WHO logo is not permitted.
 If you adapt the work, then you must license your work under the same or equivalent Creative Commons licence.
 If you create a translation of this work, you should add the following disclaimer along with the suggested citation:
“This translation was not created by the World Health Organization (WHO). WHO is not responsible for the
 content or accuracy of this translation. The original English edition shall be the binding and authentic edition”.
Any mediation relating to disputes arising under the licence shall be conducted in accordance with the mediation
rules of the World Intellectual Property Organization (http://www.wipo.int/amc/en/mediation/rules/).
Suggested citation. Status of tobacco production and trade in Africa. Geneva: World Health Organization; 2021.
Licence: CC BY-NC-SA 3.0 IGO.
Cataloguing-in-Publication (CIP) data. CIP data are available at http://apps.who.int/iris.
Sales, rights and licensing. To purchase WHO publications, see http://apps.who.int/bookorders. To submit re-
quests for commercial use and queries on rights and licensing, see http://www.who.int/about/licensing.
Third-party materials. If you wish to reuse material from this work that is attributed to a third party, such as
tables, figures or images, it is your responsibility to determine whether permission is needed for that reuse and
to obtain permission from the copyright holder. The risk of claims resulting from infringement of any third-par-
ty-owned component in the work rests solely with the user.
General disclaimers. The designations employed and the presentation of the material in this publication do not
imply the expression of any opinion whatsoever on the part of WHO concerning the legal status of any country,
territory, city or area or of its authorities, or concerning the delimitation of its frontiers or boundaries. Dotted
and dashed lines on maps represent approximate border lines for which there may not yet be full agreement.
The mention of specific companies or of certain manufacturers’ products does not imply that they are endorsed or
recommended by WHO in preference to others of a similar nature that are not mentioned. Errors and omissions
excepted, the names of proprietary products are distinguished by initial capital letters.
All reasonable precautions have been taken by WHO to verify the information contained in this publication.
However, the published material is being distributed without warranty of any kind, either expressed or implied.
The responsibility for the interpretation and use of the material lies with the reader. In no event shall WHO be
liable for damages arising from its use.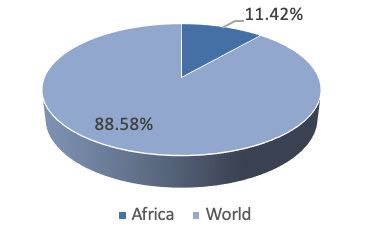
CONTENTS

Acknowledgements                                    iv
Foreword                                             v
Introduction                                         1
I.   Trends in tobacco production                    2
II. Trends in tobacco trade                          5
III. Status of tobacco trade in African countries
     in the WHO Eastern Mediterranean Region        11
IV. Key observations                                12
Glossary		                                          13
References                                          17
Bibliography and data sources                       17
Annex. WHO country classifications                  19

                                                    iii
ACKNOWLEDGEMENTS The World Health Organization gratefully acknowledges the contributions made to this report by the following individuals: WHO African Region: William Maina, Nivo Ramanandraibe WHO Eastern Mediterranean Region: Fatimah El-Awa WHO headquarters Geneva: Data management, data analysis and creation of tables, graphs and annex were performed by Luv Sharma, with support from Alison Commar and Anne-Marie Perucic. Production of the report was coordinated by Vinayak Prasad and Simone St Claire. Administrative support was provided by Ann Sikanda. Special thanks to Ahmad Muhktar from the Food and Agriculture Organization (FAO) for his contributions to the report. Our thanks also go to Teresa Lander for copy-editing support and Ana Sabino for report design. Data on tobacco production and trade used in this report is a subset of the publicly available data provided by the governments to UN COMTRADE, World Integrated Trade Solution (WITS), FAOSTAT and other WHO and United Nations statistical data sources. iv
FOREWORD
We are pleased to present the second Report on Tobacco Production and Trade in Africa.
This report updates the 2015 publication and highlights the trends in tobacco leaf
cultivation and production, as well as tobacco leaf and cigarette trade to and from the
African continent.

WHO is committed to supporting Member States in accelerating the implementation of
the WHO Framework Convention on Tobacco Control (WHO FCTC), which is Sustainable
Development Goal (SDG) target 3.a under SDG Goal 3, and combatting climate change
and its impacts under SDG Goal 13. This includes support for economically viable
alternatives for tobacco workers, growers and, as the case may be, individual sellers,
as well as protection of the environment and health of persons in relation to the
environment of tobacco cultivation. There is, however, limited information on tobacco
growing and tobacco trade, and this has often been a concern for policy-makers looking
to advance supply-side tobacco control policies in the countries.

In recent years, tobacco cultivation has shifted to Africa for a number of reasons, in-
cluding a more favourable regulatory environment, as well as an increasing demand
for tobacco. As per the WHO global report on trends in prevalence of tobacco use 2000-2025
(third edition, 2019), the number of tobacco users in the WHO African Region increased
from an estimated 64 million adult users in 2000 to 73 million in 2018. This increase
contrasts with a decline in the number of tobacco users globally, from 1397 million to
1337 million over the same period. While the use of tobacco in the African Region is still
less than most other regions, the use is increasing in a number of African countries due
to aggressive marketing by the tobacco industry.

We hope this report will support policy-makers, researchers and public health advocates
by increasing awareness of tobacco production and trade in Africa and enable them to
utilize the knowledge to advocate for accelerating implementation of tobacco control
measures, including the WHO FCTC.

Data on tobacco production and trade used in this report are a subset of the publicly
available data provided by the governments to the United Nations Commodity Trade
Statistics Database (UN COMTRADE), World Integrated Trade Solution (WITS), FAOSTAT
and other WHO and United Nations statistical data sources, covering the period 2010
to 2020.

                                                     Dr Ruediger Krech
                                             Director, Department of Health Promotion
                                                    World Health Organization

                                                                                        v
ABBREVIATIONS CIF cost, insurance and freight CTS consolidated tariff schedules FAO Food and Agriculture Organization of the United Nations FAOSTAT FAO Statistical Database FOB free on board GDP gross domestic product HS harmonized system MFN most-favoured nation NTM non-tariff measures UN United Nations UN COMTRADE United Nations Commodity Trade Statistics Database UNCTAD United Nations Conference on Trade and Development UNCTAD-TRAINS UNCTAD Trade Analysis and Information System WHO World Health Organization WHO FCTC WHO Framework Convention on Tobacco Control WITS World Integrated Trade Solution WTO World Trade Organization vi
INTRODUCTION
The tobacco epidemic is one of the biggest public health challenges the world has
ever faced, killing more than 8 million people around the world every year. The WHO
Framework Convention on Tobacco Control (WHO FCTC) provides a strong, concerted
response to the global tobacco epidemic and its enormous health, social, environmental
and economic costs (1). Despite significant global progress since the adoption of the
WHO FCTC, many countries are still not adequately implementing policies that can save
lives from tobacco, and progress in meeting the global target set by governments to
reduce the prevalence of tobacco use by 30% by 2025 remains off-track. A recent trend
in this sector is the shift of tobacco cultivation to Africa. This increase in localized
cultivation is also translating into increased prevalence of tobacco use – a trend which
is amplified by a weaker infrastructure for monitoring of tobacco use in a majority of
sub-Saharan African countries. In fact, according to the Tobacco atlas, between 1980
and 2016, the WHO African and Eastern Mediterranean Regions witnessed the largest
increases in cigarette consumption – 52% and 65%, respectively (2). We intend to high-
light such trends in this report.

Additionally, the country profiles of the present report have been developed with the
objective of supporting policy-makers, researchers and public health advocates in:

   •   increasing awareness of tobacco production and trade in Africa as a result of trade
       liberalization;
   •   using evidence from the country profiles towards advocacy for implementation of
       tobacco control measures, including the WHO Framework Convention on Tobacco
       Control (WHO FCTC), that are led by the World Health Organization.

The country profiles on tobacco production and trade present summary statistics on
tobacco production and trade in 54 African countries1 for the periods 2010–2012 and
2016–2018.2 Average values of production and trade data from 2010–2012 and 2016–2018
are reported as 2012 and 2018 data, respectively. This is done to buffer against year-to-
year fluctuations and provide a more accurate representation of facts and trends. Data
on tobacco production and trade used in this report are a subset of the data provided
by the African countries to the United Nations Commodity Trade Statistics Database
(UN COMTRADE), the World Integrated Trade Solution (WITS), the United Nations Food
and Agriculture Organization (FAO) Statistical Database (FAOSTAT) and other WHO and
United Nations statistical data sources, covering the period 2010–2018.

1
  Of the 54 African countries included in this report, 47 are in the WHO African Region and the remaining seven
are in the Eastern Mediterranean Region. Country distribution in the WHO system is shown in Annex.
2
  The summary statistics presented in the present report are based on actual figures, not adjusted for increases
in population or inflation.

                                                                                                                   1
I. TRENDS IN TOBACCO PRODUCTION
Table 1. Area under tobacco cultivation, in hectares
Year From 2012 to 2018, the area
Region 2012 2018 under tobacco cultivation
decreased globally by 15.66%,
World (total) 4 111 818 3 468 101
while in Africa it increased by
Africa (total) 609 687 630 432 3.40% (Table 1).
Source: FAOSTAT. Rome: Food and Agriculture Organization of the United Nations; 2020
(http://www.fao.org/faostat/en/#home, accessed 30 August 2020).
Fig. 1. Africa’s share of world tobacco leaf production, 2018
During this period, tobacco leaf
production decreased globally
by 13.9%; in Africa, however,
it increased by 10.6%. In 2018,
global tobacco leaf production
was 6.3 million tonnes and in
Africa it was 722 187 tonnes,
representing 11.4% of global
production (Fig. 1).
Source: FAOSTAT. Rome: Food and Agriculture Organization of the United Nations; 2020
(http://www.fao.org/faostat/en/#home, accessed 30 August 2020).
Fig. 2. African tobacco leaf production by region, 2018
East Africa1 accounts for
90.43% of tobacco leaf
production in Africa (Fig. 2).
1
East African countries, as per
United Nations classifications:
Burundi, Comoros, Djibouti, Eritrea,
Ethiopia, Kenya, Madagascar, Malawi,
Mauritius, Mozambique, Rwanda,
Seychelles, Somalia, Uganda, United
Republic of Tanzania, Zambia,
Zimbabwe.
Source: FAOSTAT. Rome: Food and Agriculture Organization of the United Nations; 2020
(http://www.fao.org/faostat/en/#home, accessed 30 August 2020).
2Fig. 3. Top 10 tobacco leaf growers in Africa (quantity in tonnes), 2012
Tobacco leaf production (tonnes)
The main tobacco leaf
growing countries in
Africa are Zimbabwe
(25.9% of Africa’s
output), Zambia (16.4%),
United Republic of
Tanzania (14.4%), Malawi
Zambia
United Republic
of Tanzania
Mozambique
Zimbabwe
Malawi
Uganda
South Africa
Algeria
Kenya
Côte d’Ivoire
(13.3%) and Mozambique
(12.9%) (Fig. 3).
Source: FAOSTAT. Rome: Food and Agriculture Organization of the United Nations
(http://www.fao.org/faostat/en/#home, accessed 30 August 2020).
Fig. 4. Tobacco leaf growing, 1995
In 1995, there were only
two major tobacco leaf
growing countries in
Africa – Malawi and
Zimbabwe. However,
in the past two decades,
Mozambique, United
Republic of Tanzania
Source: FAOSTAT. Rome: Food and Agriculture Organization of the United Nations;
and Zambia have
2020 (http://www.fao.org/faostat/en/#home, accessed 30 August 2020).
substantially increased
their tobacco leaf
Fig. 5. Tobacco leaf growing, 2018 production
(Figs. 4 and 5).
Source: FAOSTAT. Rome: Food and Agriculture Organization of the United Nations;
2020 (http://www.fao.org/faostat/en/#home, accessed 30 August 2020).
3Fig. 6. Tobacco crop yield per hectare (hg/ha), 1995–2012
Yield per hectare (hg/ha)
During the period 1995–2018,
the tobacco crop yield in Africa
initially declined, followed by
stagnation and then a recovery
in more recent years. In 1995,
the average tobacco crop yield
was 13 072 hectograms per
hectare (hg/ha), declining to
10 668 hg/ha by 2010, followed
by an increase to 10 812 in 2018
(Fig. 6).
Source: FAOSTAT. Rome: Food and Agriculture Organization of the United Nations; 2020
(http://www.fao.org/faostat/en/#home, accessed 30 August 2020).
4II. TRENDS IN TOBACCO TRADE
Fig. 7. Tobacco leaf imports (millions US$) Fig. 8. Tobacco leaf exports (millions US$)
2012–2018 2012–2018
$ (Millions)
$ (Millions)
Source: FAOSTAT. Rome: Food and Agriculture Organization of Source: FAOSTAT. Rome: Food and Agriculture Organization of
the United Nations; 2020 (http://www.fao.org/faostat/en/#home, the United Nations; 2020 (http://www.fao.org/faostat/en/#home,
accessed 30 August 2020). accessed 30 August 2020).
Global trade liberalization has From 2012 to 2018, the value of tobacco
increased access to new tobacco leaf exports from Africa increased
markets. More than 70% of African by 10.51%, from US$ 1883 million to
countries are now members of the US$ 2081 million (Fig. 8).
World Trade Organization (WTO).
Between 2012 and 2018, tobacco leaf
imports in Africa decreased by 32.6%
compared with world figures, which
decreased by 5.93% (Fig. 7).
Fig. 9. Tobacco leaf trade in Africa, 2012–2018 (millions US$)
Africa continues to be a net
exporter of tobacco leaf, thus
showing a favourable trade
balance of approximately
US$ 1261 million in 2018 (Fig. 9).
Source: FAOSTAT. Rome: Food and Agriculture
Organization of the United Nations; 2020
(http://www.fao.org/faostat/en/#home, accessed
30 August 2020).
5Africa’s main tobacco leaf exporters and importers in 2017 are shown in Figs. 10 and 11.
Fig. 10. Main tobacco leaf exporters, Africa, 2018
Mozambique
Zimbabwe
Malawi
United Republic
of Tanzania
Zambia
Uganda
Kenya
Senegal
South Africa
Namibia
Source: FAOSTAT. Rome: Food and Agriculture Organization of the United Nations; 2020
(http://www.fao.org/faostat/en/#home, accessed 30 August 2020).
Fig. 11. Main tobacco leaf importers, Africa, 2018
Mozambique
Sudan
Tunisia
Egypt
South Africa
Nigeria
Côte d’Ivoire
Kenya
Senegal
Malawi
Source: FAOSTAT. Rome: Food and Agriculture Organization of the United Nations; 2020
(http://www.fao.org/faostat/en/#home, accessed 30 August 2020).
6Fig. 12. Cigarette exports, 2012–2018 (millions US$)
By 2018, the export value
of cigarettes from Africa
was US$ 401 million,
reflecting a 2.14%
decrease since 2012
(Fig. 12).
Source: FAOSTAT. Rome: Food and Agriculture Organization of the United Nations; 2020
(http://www.fao.org/faostat/en/#home, accessed 30 August 2020).
Fig. 13. Africa’s cigarette trade, 2012–2018 (millions US$)
Between 2012 and
2018, the cigarette
trade deficit for African
nations increased
from US$ 387.5 million
to US$ 843.9 million
(Fig. 13).
Source: FAOSTAT. Rome: Food and Agriculture Organization of the United Nations; 2020
(http://www.fao.org/faostat/en/#home, accessed 30 August 2020).
7The main cigarette exporters and importers in Africa in 2018 are shown in Figs. 14 and 15.
Fig. 14. Main cigarette exporters, Africa, 2018
South Africa
Kenya
Nigeria
Senegal
United
Tunisia
Republic of
Tanzabia
Côte d’Ivoire
Seychelles
Zimbabwe
Uganda
Source: FAOSTAT. Rome: Food and Agriculture Organization of the United Nations; 2020
(http://www.fao.org/faostat/en/#home, accessed 30 August 2020).
Fig. 15. Main cigarette importers, Africa, 2018
Libya
Morocco
Somalia
Tunisia
South Africa
Guinea
Mauritius
Mali
Côte d’Ivoire
Egypt
Source: FAOSTAT. Rome: Food and Agriculture Organization of the United Nations; 2020
(http://www.fao.org/faostat/en/#home, accessed 30 August 2020).
8The Member States of the WHO African Region (see Annex for list of country groupings)
account for 18.2% of the global area under tobacco cultivation and 11.4% of tobacco leaf
growing in the world. Within Africa, the top 10 tobacco-growing countries account for
approximately 94% of African tobacco leaf production.
Most of the top tobacco growers export tobacco leaf to other countries. Top tobacco leaf
exporters include Zimbabwe (US$ 851 million), Malawi (US$ 529 million), Mozambique
(US$ 236 million), United Republic of Tanzania (US$ 208 million), and Zambia (US$ 123 mil-
lion). Just five countries – South Africa (US$ 134 million), Kenya (US$ 87 million), Nigeria
(US$ 55 million), Senegal (US$ 49 million), and Tunisia (US$ 39 million) – accounted
for 81.8% of African cigarette exports in 2018.1
1
Report presents summary statistics on tobacco production and trade in 54 African countries for the periods
2010–2012 and 2016–2018. Average values of production and trade data from 2010–2012 and 2016–2018 are
reported as 2012 and 2018 data, respectively.
9Table 2. Tariffs applied by 10 top tobacco trading countries in Africa for tobacco leaf and
cigarettes
COUNTRY TOBACCO LEAF CIGARETTES
Simple average Bound Simple average Bound tariffs %
MFN applied % tariffs % MFN applied %
Côte d’Ivoire 5 17 20 64
Democratic 5 100 20 100
Republic of Congo
Kenya 25 100 35 100
Malawi 18.2 125 25 125
Mozambique 2.5 100 20 100
Nigeria 5 150 20 150
Tanzania, United 25 120 35 120
Republic of
Uganda 25 80 35 80
Zambia 15 125 25 125
Zimbabwe 80 150 40 150
MFN: most-favoured nation. Note: Kenya calculates tariffs as a percentage of free-on-board (FOB) value; all remaining
countries calculate tariffs as a percentage of cost, insurance and freight (CIF) value.
Table 3. Tobacco leaf and cigarette tariffs applied between top tobacco trading countries
in Africa.
COUNTRY TOBACCO LEAF CIGARETTES
Imports Exports Imports Exports
Mozambique South Africa Belgium South Africa South Africa
2.50% 18.4% MIN 20% 45%
€22/100 kg MAX
€24/100 kg
Tanzania, United Uganda China Kenya Democratic
Republic of Republic of
Congo
25% 10% 35% 20%
Zambia Zimbabwe China South Africa South Africa
20% 10% 25% 45%
Zimbabwe Zambia South Africa South Africa Mozambique
10% 860c/kg less 85% US$ 20/1000 20%
with a maximum cigarettes
of 44%
Note: Kenya calculates tariffs as a percentage of FOB value; all remaining countries calculate tariffs as a percentage of CIF value.
10III. STATUS OF TOBACCO TRADE
I N AFRICAN COUNTRIES IN THE
WHO EASTERN MEDITERRANEAN REGION
African countries in the WHO Eastern Mediterranean Region (Djibouti, Egypt, Libya,
Morocco, Somalia, Sudan, Tunisia) account for less than 1% of tobacco leaf growing
in Africa. In 2018, the top growers of tobacco leaf among these countries were Tunisia
(2067 tonnes), Morocco (1300 tonnes) and Libya (1249 tonnes).
However the import share of tobacco leaf by Eastern Mediterranean Region countries
on the African continent is significant, accounting for almost 27% of total tobacco leaf
imported by African countries in 2018. The top leaf importers include Egypt (US$ 135 mil-
lion), Sudan (US$ 35 million), Tunisia (US$ 27 million) and Morocco (US$ 23 million).
Likewise, Eastern Mediterranean Region countries on the African continent account for
a large share of cigarettes imported by Africa, accounting for about 48.8% of Africa’s
total cigarette imports. Top importers of cigarettes are Libya (US$ 205 million), Somalia
(US$ 128 million), Morocco (US$ 118 million), Tunisia (US$ 94 million) and Egypt
(US$ 45 million).
Table 2 shows the tariff structure for the top 10 tobacco trading countries in Africa. The
first column shows the applied rate, which means the actual customs duties applied at
the border, while the second column shows bound tariffs – the maximum binding these
countries have undertaken for this tariff in line with their WTO obligations. Table 3
shows the tariffs applied between the leading tobacco leaf and cigarette producers in
Africa and their top trade partners.
11IV. KEY OBSERVATIONS1 1. All but five countries2 in Africa are Parties to the WHO Framework Convention on Tobacco Control (WHO FCTC). Nevertheless, tobacco production trends are rising in Africa. 2. Africa witnessed an increase in both the acreage devoted to tobacco leaf production and production quantities; acreage increased by 3.4% and production quantity increased by 10.6% between 2012 and 2018. This trend is counter to a 13.9% decrease in global tobacco leaf production and a 15.6% reduction in the area harvested under tobacco. 3. The country profiles provide a snapshot of tobacco growing and tobacco trade as a percentage of GDP; in most countries they account for less than 1% of GDP. This suggests a negligible role for tobacco production and trade in all but a few economies where tobacco leaf export is more than 1% of GDP, such as in Malawi (8.45% of GDP in 2018), Zimbabwe (3.43% of GDP in 2018) and Mozambique (1.77% of GDP in 2018). Even in these countries tobacco leaf exports as a percentage of GDP have been in decline, demonstrating the reduced role of tobacco in economic output. 4. Northern African countries in the WHO Eastern Mediterranean Region have little or no role in tobacco production, although they have significant trade volumes in the import of tobacco. 5. According to the WHO global report on trends in prevalence of tobacco use 2000-2025 (third edition, 2019) (3), the number of tobacco users in the WHO African Region increased from an estimated 64 million adult users in 2000 to 73 million in 2018. This increase contrasts with the decline in the number of tobacco users globally, from 1397 million to 1337 million over the same period. The African countries in the WHO Eastern Mediterranean Region (Djibouti, Egypt, Libya, Morocco, Somalia, Sudan, Tunisia) taken together have at least 19 million tobacco users. 1 During the compilation of UN COMTRADE and FAOSTAT data for developing the country profiles, incomplete or missing data for a large number of countries in Africa remained a key challenge. In respect of the African countries – Cape Verde, Comoros, Equatorial Guinea, Eritrea, Gabon, Guinea-Bissau, Lesotho, Liberia, Mauritania, São Tomé and Príncipe, Seychelles, South Sudan and Sudan – the information presented was limited or missing. 2 Eritrea, Malawi, Morocco, South Sudan, Somalia. 12
GLOSSARY
AGRICULTURAL AREA
Agricultural area is the sum of areas under (a) arable land – land under temporary ag-
ricultural crops (multiple-cropped areas are counted only once), temporary meadows
for mowing or pasture, land under market and kitchen gardens, and land temporarily
fallow (less than five years). The abandoned land resulting from shifting cultivation
is not included in this category. Data for “arable land” are not meant to indicate the
amount of land that is potentially cultivable; (b) permanent crops – land cultivated with
long-term crops which do not have to be replanted for several years (such as cocoa and
coffee); land under trees and shrubs producing flowers, such as roses and jasmine; and
nurseries (except those for forest trees, which should be classified under “forest”); and
(c) permanent meadows and pastures – land used permanently (five years or more) to
grow herbaceous forage crops, either cultivated or growing wild (wild prairie or grazing
land). Data are expressed in hectares. Unit of measurement is “hectares”.
Source: FAOSTAT

AREA HARVESTED
“Area harvested” data refer to the area from which a crop is gathered. Area harvested,
therefore, excludes the area from which, although sown or planted, there was no harvest
because of damage, crop failure, etc. It is usually net for temporary crops and sometimes
gross for permanent crops. Net area differs from gross area insofar as the latter includes
uncultivated patches, footpaths, ditches, headlands, shoulders, shelterbelts, etc.

If the crop under consideration is harvested more than once during the year because of
successive cropping (i.e. the same crop is sown or planted more than once in the same
field during the year), the area is counted as many times as harvested. By contrast, area
harvested will be recorded only once in the case of successive gathering of the crop
during the year from the same standing crops. With regard to mixed and associated
crops, the area sown relating to each crop should be reported separately. When the
mixture refers to particular crops, generally grains, it is recommended that the mixture
is treated as if it were a single crop; therefore, area sown is recorded only for the crop
reported. Unit of measurement is “hectares”.
Source: FAOSTAT

                                                                                       13
BOUND TARIFFS The bound tariff rate is the most-favoured-nation tariff rate resulting from negotia- tions under the General Agreement on Tariffs and Trade (GATT) and incorporated as an integral component of a country’s schedule of concessions or commitments to other World Trade Organization members. If a country raises a tariff to a higher level than its bound rate, those adversely affected can seek remedy through the dispute settlement process and may obtain the right to retaliate against an equivalent value of the offending country’s exports or the right to receive compensation, usually in the form of reduced tariffs on other products they export to the offending country. COMTRADE UN COMTRADE is the short name for the United Nations Commodity Trade Statistics Database. Over 140 reporting countries provide the United Nations Statistics Division with their annual international trade statistics data, detailed by commodities and partner countries. These data are then converted into the United Nations Statistics Division standard format with consistent coding and valuation. UN COMTRADE is the largest depository of international trade data. Commodities are reported in the current Harmonized System (HS) classification and revision, and are converted all the way down to the earliest classification Standard International Trade Classification (SITC) revision 1. The data are permanently stored in the UN COMTRADE database server (http://comtrade.un.org/). Source: WTO ITC UNCTAD World Tariff Profiles 2012 CONSOLIDATED TARIFF SCHEDULES DATABASE The Consolidated Tariff Schedules database (CTS) contains all WTO members’ conces- sions on goods in a standardized format. The database has been established as a working tool only, without implications as to the legal status of the information therein. All members’ CTS files (approved and provisional) were made available to members on 28 June 2002 through the Integrated Data Base IDB/CTS Internet File Transfer Facility. For each WTO member there is a CTS file containing its tariff commitments and, if applicable, its specific commitments in agriculture. The information contained in the CTS is available on the WTO website. Source: WTO ITC UNCTAD World Tariff Profiles 2012 CROP YIELD Crop yield refers to the harvested production per unit of harvested area for crop products. In most of the cases yield data are not recorded but obtained by dividing the production data by the data on area harvested. Unit of measurement is “hg/ha”. Hg = hectogram (100 grams) and ha = hectare. Source: FAOSTAT 14
CURRENT TOBACCO SMOKING PREVALENCE
Percentage of survey respondents who currently smoke tobacco daily or occasionally.
Daily means smoking at least one tobacco product every day or nearly every day over
a period of a month or more. Tobacco smoking includes all forms of smoked tobacco,
examples: cigarettes, kreteks, pipes, cigars, cheroots, water pipes. Rare instances of
smoking or experimental smoking (tried once or twice in lifetime) should be counted
in the NOT AT ALL category.
Source: http://www.who.int/tobacco/publications/surveillance/en_tfi_tqs.pdf

GROSS DOMESTIC PRODUCT
The gross domestic product (GDP) is the market value of all officially recognized final
goods and services produced within a country in a year, or over a given period of time.
GDP per capita is often used as an indicator of a country’s material standard of living.

MOST-FAVOURED-NATION TARIFF
The most-favoured-nation (MFN) tariff refers to the normal non-discriminatory tariff
charged on imports (excludes preferential tariffs under free trade agreements and other
schemes or tariffs charged inside quotas).

NET WEIGHT
Net weight refers to the net shipping weight in kilograms, excluding the weight of
packaging or containers.
Source: FAOSTAT

NON-TARIFF MEASURES
Non-tariff measures (NTMs) refer to the barriers, other than traditional customs duties,
which make exports to a particular country difficult and costly. NTMs may take the form
of quotas, charges, discriminatory labelling and health standards and other restrictive
conditions. They may result from government or private sector action.
Source: Glossary on Trade Financing Terms of the International Trade Centre (ITC)

TARIFFS
Tariffs refer to tax imposed by a government on goods as they enter (or leave) a country.
They may be imposed for protectionist reasons and/or to generate government reve-
nues. Tariff types include ad valorem,1 specific, variable or some combination of these.
Source: Glossary on Trade financing terms of the International Trade Centre (ITC)

1
  Ad valorem (of the levying of tax or customs duties): in proportion to the estimated value of the goods or
transaction concerned.

                                                                                                               15
TOBACCO LEAF PRODUCTION Tobacco leaf production data refer to the actual harvested production from the field or orchard and gardens, excluding harvesting and threshing losses, and parts of the crop not harvested for any reason. Production therefore includes the quantities of the commodity sold in the market (marketed production) and the quantities consumed or used by the producers (auto-consumption). When the production data available refers to a production period falling into two successive calendar years and it is not possible to allocate the relative production to each of them, it is usual to refer production data to that year into which the bulk of the production falls. Crop production data are re- corded in tonnes (t). In many countries, crop production data are obtained as a function of the estimated yield and the total area. If such a compilation method of production statistics is enforced by the country, it must be ensured that the total area does not refer to sown or planted area, which would then give the “biological production”, but to the area actually harvested during the year. Unit of measurement is “metric tons”. Source: FAOSTAT TRADE VALUE Statistical trade value is the sum of the transaction value of goods (or its substitute), and the value of the services performed in delivering the goods to the border of the exporting (or importing) country, and not included in their transaction value. Source: FAOSTAT TRAINS – UNCTAD UNCTAD–Trade Analysis and Information System (TRAINS) is a comprehensive computerized information system at the HS-based tariff line level covering tariff, para-tariff and non-tariff measures, as well as import flows by origin for more than 140 countries. The system is operated by World Integrated Trade Solution (WITS) software, developed jointly with the World Bank, which is also a gateway to other databases such as UN COMTRADE and WTO IDB/CTS. WITS is a simple to use yet powerful software which gives access to trade and tariff related statistical information and includes some simulation and analysis tools. (http://unctad-trains.org for TRAINS and http://wits. worldbank.org/witsweb for the WITS software). Source: World Trade Organization (WTO), United Nations Conference on Trade and Development (UNCTAD) and International Trade Centre (ITC) World Tariff Profiles 2012 16
REFERENCES
 1.   WHO Framework Convention on Tobacco Control. Geneva: World Health
      Organization; 2003.
 2.   Drope J, Schluger N, Cahn Z, Drope J, Hamill S, Islami F et al. The tobacco atlas.
      Atlanta (GA): American Cancer Society and Vital Strategies; 2018.
 3.   WHO global report on trends in prevalence of tobacco use 2000–2025, third
      edition. Geneva: World Health Organization; 2019.

BIBLIOGRAPHY AND DATA SOURCES
Data were collected from the publications and databases listed below:

 1.   Consolidated Tariff Schedules database (CTS): http://tdf.wto.org.
 2.   FAO Statistical Database: http://faostat.fao.org/.
 3.   UN COMTRADE Database: http://comtrade.un.org/db/default.aspx.
 4.   UNCTAD-TRAINS (Trade Analysis and Information System): www.unctad.info/
      en/Trade-Analysis-Branch.
 5.   United Nations Statistics Division: http://data.un.org/Default.aspx.
 6.   Mortality attributable to tobacco. Geneva: World Health Organization; 2013.
 7.   WHO report on the global tobacco epidemic. Geneva: World Health Organization;
      2013.
 8.   World Bank list of economies. Washington (DC): World Bank; 2014: http://data.
      worldbank.org/about/country-and-lending-groups.
 9.   World Population Prospects – 2012 revision. New York: United Nations Population
      Division; 2013.
10.   WHO global report on trends in prevalence of tobacco smoking. Geneva: World Health
      Organization; 2015: http://apps.who.int/iris/bitstream/10665/156262/1/978924
      1564922_eng.pdf.

                                                                                     17
GENERAL DISCLAIMERS OF THE MAIN DATA SOURCES
UN COMTRADE The designations employed and the presentation of material on this internet
site do not imply the expression of any opinion whatsoever on the part of the
Secretariat of the United Nations concerning the legal status of any country,
territory, city or area, or of its authorities, or concerning the delimitations of
its frontiers or boundaries.
Where the designation “country or area” appears on this internet site, it
covers countries, territories or areas.
The data of the UN COMTRADE database shown on this internet site are
copyrighted by the United Nations and are provided for your internal use only.
They may not be re-disseminated in any form without written permission of
the United Nations Statistics Division.
FAOSTAT The designations employed and the presentation of materials in FAOSTAT do
not imply the expression of any opinion whatsoever on the part of the Food
and Agriculture Organization of the United Nations concerning the legal
status of any country, territory, city or area or its authorities, or concerning
the delimitation of its frontiers or boundaries.
Where the designation “country” or “area” appears on this internet site, it
covers countries, territories or areas.
The data of the FAOSTAT database shown on this internet site are copyrighted
by the Food and Agriculture Organization of the United Nations and are
provided for your internal use only. They may not be re-disseminated in any
form without written permission of the FAO Statistics Division.
All references to FAOSTAT data will have to be mentioned with the proper
URL and the access date.
18Annex.
WHO COUNTRY CLASSIFICATIONS
WHO African Region
Algeria Lesotho
Angola Liberia
Benin Madagascar
Botswana Malawi
Burkina Faso Mali
Burundi Mauritania
Cameroon Mauritius
Cape Verde Mozambique
Central African Republic Namibia
Chad Niger
Comoros Nigeria
Congo Rwanda
Côte d’Ivoire São Tomé and Príncipe
Democratic Republic of Congo Senegal
Equatorial Guinea Seychelles
Ethiopia Sierra Leone
Eritrea South Africa
Eswatini South Sudan
Gabon Togo
Gambia Uganda
Ghana United Republic of Tanzania
Guinea Zambia
Guinea-Bissau Zimbabwe
Kenya
WHO Eastern Mediterranean Region countries in Africa
Djibouti
Egypt
Libya
Morocco
Somalia
Sudan
Tunisia
1920
You can also read