Regional meteo-marine reanalyses and climate change projections: Results for Northern Europe and potentials for coastal and offshore applications
←
→
Page content transcription
If your browser does not render page correctly, please read the page content below
Regional meteo-marine reanalyses and
   climate change projections: Results for
      Northern Europe and potentials for
      coastal and offshore applications
        Ralf Weisse1, Hans von Storch1, Ulrich Callies1, Alena Chrastansky1, Frauke Feser1,
       Iris Grabemann1, Heinz Guenther1, Andreas, Pluess2, Thomas Stoye3, Jan Tellkamp4,
                                Jörg Winterfeldt1 and Katja Woth1
              1
                  GKSS Research Center, Institute for Coastal Research, Geesthacht, Germany
                  2
                   Federal Waterways Engineering and Research Institute, Hamburg, Germany
                   3
                     Flensburger Schiffbau-Gesellschaft mbH & Co. KG, Flensburg, Germany
                                 4
                                   DNV Germany GmbH, Hamburg, Germany

Abstract:

A compilation of coastal weather analyses and climate change scenarios for the future for Northern
Europe from various sources is presented. They contain no direct measurements but results from
numerical models that have been driven either by observed data in order to achieve the best possible
representation of observed past conditions or by climate change scenarios for the near future. A
comparison with the limited number of observational data points to the good quality of the model
data in terms of long-term statistics such as multi-year return values of wind speed and wave
heights. These model data provide a unique combination of consistent atmospheric, oceanic, sea
state and other parameters at high spatial and temporal detail, even for places and variables for
which no measurements have been made. In addition, coastal scenarios for the near-future
complement the numerical analyses of past conditions in a consistent way. The backbones of the
data are regional wind, wave and storm surge hindcasts and scenarios mainly for the North Sea. We
briefly discuss the methodology to derive these data, their quality and limitations in comparison with
observations. Long-term changes in the wind, wave and storm surge climate are discussed and
possible future changes are assessed. A variety of coastal and offshore applications taking
advantage of the data is presented. Examples comprise applications in ship design, oil risk modeling
and assessment, or the construction and operation of offshore wind farms.

                                                         indices for changes in storm activity (e.g. Schmidt
                                                         and von Storch 1993). The other approach is to use
                                                         numerical models driven by re-analysis data over
  I.    INTRODUCTION                                     sufficiently long periods and at high spatial and
   Coastal and offshore applications require             temporal resolution (e.g. Günther et al. 1998).
appropriate planning and design. For most of them,          Both     approaches      have   advantages     and
statistics of extreme wind, waves and storm surges       disadvantages. While proxy data can generally be
are of central importance. To obtain such statistics     used to reconstruct indices for rather long time
long and homogeneous time series are needed.             periods (up to centuries), their spatial resolution
   Usually such time series are hardly available. In     remains limited and proxy data must be available at
most cases observations are either missing, cover        sufficient detail and quality. Hindcasts, on the other
too short periods, or are lacking homogeneity, that is   hand, are limited to periods for which global re-
long-term changes in the time series are not entirely    analyses are available (nowadays about 60 years)
related to geophysical changes on the scale of           and by the quality of the involved models.
interest, but are partly due to changes in                  In the following we describe a set of coastal and
instrumentation, measurement technique or other          offshore hindcasts based on global re-analysis data.
factors such as changes in the surrounding of the        The hindcasts are complemented with consistent
measurement site.                                        climate change scenarios for the future. Data
   There are in principal two approaches to address      obtained from these exercises are integrated into a
these issues (cf. WASA 1998): One is the use of          joint data base referred to as coastDat (see
proxy data that are considered to be more                www.coastdat.de). In the following the model set-up
homogeneous and are available for longer periods.        and experimental design are briefly described.
An example is the use of pressure data to derive         Subsequently some representative examples are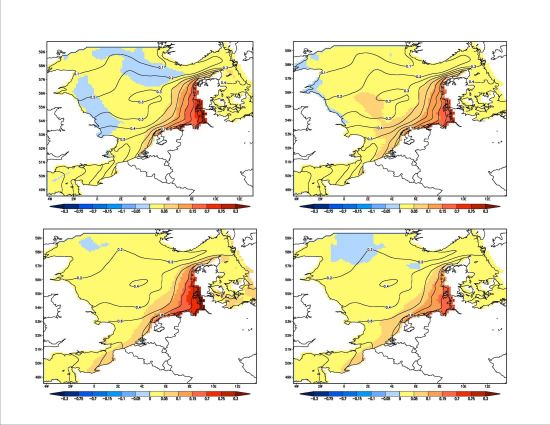
Figure 1: Layout of the consistent metocean hindcast 1948-2007
for the Southern North Sea. From the regional atmosphere
hindcast (middle) hourly wind fields were used to force a tide-
surge (right) and a wave model hindcast (left). The figure shows
an example of consistent metocean conditions obtained from the
hindcast for 12 UTC on 21 February 1993. Middle: near-surface
(10 m height) marine wind fields in ms−1 and corresponding wind
direction obtained from the regional atmospheric reconstruction.
Left: corresponding significant wave height fields in m and mean
wave direction from the coarse and the fine grid wave model
hindcast. Right: Tide-surge levels in m from the corresponding
tide-surge hindcast. After Weisse and Günther (2007).
provided in which coastDat has been applied for the
analysis of recent and potential future changes.
Finally applications are shown in which coastDat has
been used to address coastal and offshore
problems. An outlook for further applications is
offered at the end of this paper.
II. MODEL SET-UP AND SIMULATIONS
We used the NCEP/NCAR global re-analysis
(Kalnay et al. 1996) in combination with spectral
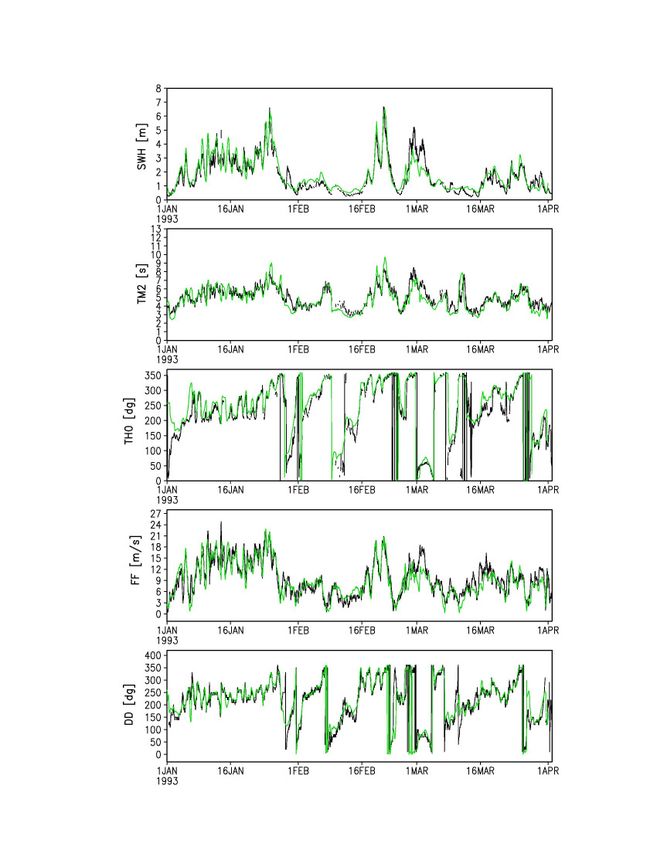
nudging (von Storch et al. 2002) to first drive a Figure 2. Time series of significant wave height in m, Tm2 wave
regional atmosphere model for an area covering period in s, mean wave direction in degrees coming from, wind
most of Europe and adjacent seas. Initially the model speed in ms−1 and wind direction in degrees coming from (from
top to bottom) at K13 for a three months period 01 January
was integrated for the years 1958-2002 with a spatial 1993-31 March 1993. Observations - black, model results –
grid size of about 50x50 km. The period has been green. After Weisse and Günther (2007).
extended later and currently covers the 60 years
1948-2007. Full model output is available for every station K13 (53.22 N, 3.22 E). In principal a good
hour within this 60 year period. agreement can be inferred. For instance, the storm
From this atmospheric simulation, near-surface event on 21 February which caused observed
marine wind fields have been used subsequently to significant wave heights of more than 6 m is
drive high-resolution wave and tide-surge models. reasonably reproduced for all parameters. On the
While the wave model was run in a nested mode other hand, there are also events with larger
with a coarse grid (about 50x50 km) covering most of discrepancies such as the one around 1 March for
the Northeast Atlantic and a fine grid (about 5x5 km) which wave heights are considerably
covering the North Sea south of 56N, the tide-surge underestimated, in this case caused by too low wind
model was run on an unstructured grid with typical speeds in the atmospheric hindcast.
grid spacing of about 5 km in the open North Sea A comparison of modelled and hindcast storm
and largely increased values (up to 80 m) near the indices for Lund in Sweden is shown in Figure 3.
coast and in the estuaries. As for the atmospheric Generally it can be inferred, that the observed year
part, full model outputs have been stored every hour. to year variability is captured reasonably by the
This way a high-resolution meteo-marine (metocean) hindcast although some bias may occur. For marine
data set for the North Sea covering the last six near-surface wind fields Winterfeldt (2008)
decades of years has been created. Figure 1 shows demonstrated that, compared to the driving
an example of conditions obtained for 21 February reanalysis, an improvement is obtained mainly in
1993. coastal areas. More validation can be found for the
An impression of the extent to which this approach atmospheric part in Feser (2006), for the tide-surge
is able to provide a reasonable reconstruction of the simulation in Weisse and Pluess (2006), and for the
observed wind and wave climate is given in Figure 2. wave model hindcast in Weisse and Günther (2007).
Shown are observed and hindcast wind speed and Scenarios for future climate conditions have been
direction as well as significant wave height, period obtained in a similar way. Here the global re-analysis
and wave direction for a three months period at has been replaced by an ensemble of different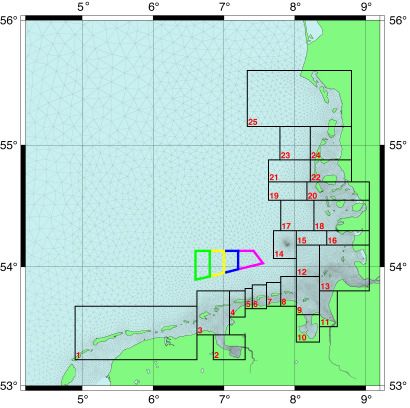
with increases in storm surges and wave heights
                                                                 between about 1960 and 1990 and decreases
                                                                 afterwards.
                                                                    Changes of the North Sea storm surge climate in
                                                                 an ensemble of climate change simulations that form
                                                                 part of the coastDat data set were analyzed by Woth
                                                                 (2005) and Woth et al. (2006). Figure 4 shows the
                                                                 changes in extreme storm surge levels expected
                                                                 towards the end of the century. Although regional
                                                                 details differ among the different models and
                                                                 scenarios, all point towards a moderate increase in
                                                                 severe storm surge levels along most of the
                                                                 Netherlands, German and Danish coast lines. When
                                                                 compared to the natural variability estimated from
                                                                 the coastDat hindcast (Weisse and Pluess 2006)
                                                                 climate change related increases in storm surge
Figure 3. Comparison between different storm indices for Lund,   heights are found to be smaller for most of the
Sweden. From top to bottom: Number of deep pressure
readings; Number of strong pressure tendencies; 95- and 99-      Netherlands and Danish coast, while they are larger
percentiles of strong pressure tendencies. Blue: Obtained from   along most of the German coast line.
observations. Red: Obtained from coastDat. After Bärring and        Using near-surface marine wind speeds from the
von Storch (2004).
                                                                 same set of scenario simulations Grabemann and
global climate change simulations. We have used                  Weisse (2008) performed a similar ensemble of
four sets of simulations using A2 and B2 emission                wave model simulations. Although the same wind
scenarios with two different global climate models.              forcing was used, changes appeared to be more
These simulations were downscaled approximately                  diverse. In particular, regional patterns of changes in
on a 50 x 50 km grid by the Swedish Meteorological               severe wave conditions differ and the magnitude of
and Hydrological Institute in the framework of the               the changes strongly depends on the choice of the
PRUDENCE project (Christensen et al. 2002) with                  atmospheric model from which wind fields have been
the regional model RCAO (Räisänen et al. 2004).                  used.
From these simulations, near-surface wind and
pressure fields have subsequently been used to                    IV. APPLICATIONS OF COASTDAT
produce high-resolution scenarios of possible wave                  The coastDat data set has been used for a variety
(Grabemann and Weisse 2008) and storm surge                      of coastal and offshore applications. This comprises
conditions (Woth 2005, Woth et al. 2006) for the                 applications in ship design, oil risk modeling and
North Sea. While the size of this ensemble is still              assessment, and the construction and operation of
somewhat       limited   owing    to    computational            offshore wind farms. In the following a few examples
constraints, it allows not only for an estimate of               will be provided.
potential future metocean conditions but also for a
first rough guess about the underlying uncertainties.
                                                                 A. Optimization of ship operation profiles
                                                                    Operation profiles of RoRo vessels operating on
  III. RECENT AND POSSIBLE FUTURE CHANGES                        fixed routes in the North Sea were simulated over
    The coastDat data set was used by Weisse et al.              decades of years with environmental conditions
(2005) to analyze long-term changes in storm activity            (wind, water depth, sea state) provided by the
over the North Sea and the Northeastern North                    coastDat data set (Friedhoff and Maksoud 2005).
Atlantic. They found an increase in storm activity               Operation profiles (such as velocity or power) were
from about 1960. Storm activity peaked around                    varied under the constraint, that the operations are
1990/1995, afterwards a decrease was inferred.                   time critical, that is, the individual trips need to be
These results are consistent with those obtained                 finished within a given time window, as long as
from proxy data for the area. For instance,                      permitted by safety requirements (weather
Alexandersson et al. (2000) and an update in IPCC                conditions). Results for a 200 m RoRo vessel
(2007) report a similar behavior based on the                    operating on a 332 nm round trip between
analysis of upper geostrophic wind speed percentiles             Zeebrügge, Belgium and Immingham, UK are
derived from station pressure data. Covering a                   provided in Friedhoff and Maksoud (2005). For the
longer period than the coastDat hindcasts in                     3,650 trips simulated within a 10 year period they
particular theses studies showed that the 1960-1990              found fuel consumption to be increased by about 9%
increase in storm activity was not unusual but that              when compared to calm weather conditions and
activity levels reached in the mid-1990’s were                   attributed the effect to the additional power required
comparable to that at the beginning of the 20th                  to face with the environmental conditions caused by
century. Long-term changes in extreme storm surge                wind, waves and water levels. They also showed
and ocean wave heights based on the coastDat data                that operation profiles may be optimized compared
set were analyzed by Weisse and Pluess (2006) and                to conventional approaches such that operation
Weisse and Günther (2007). In particular they found              costs are reduced and delay becomes minimal. They
that the changes correspond to that of storm activity            concluded that data bases such as coastDat may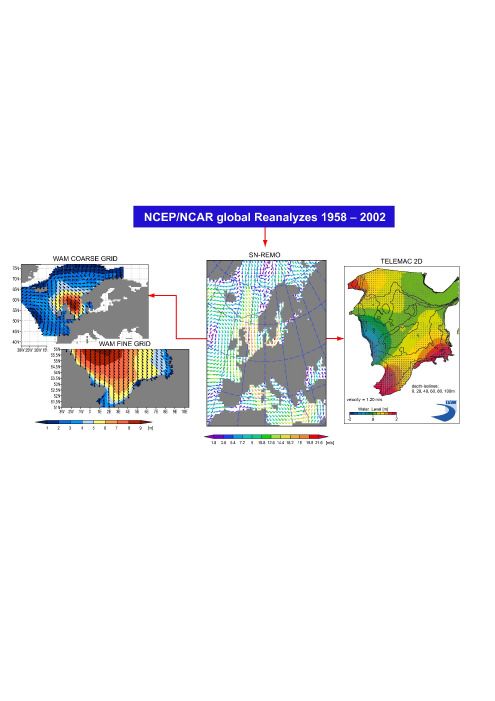
need to be reduced, passive roll-stabilization tanks
                                                                may be installed to modify the eigenfrequency of the
                                                                roll motion making the ship more seaworthy in a
                                                                given sea state. An alternative is the installation of
                                                                active fin-stabilizers that compensate the roll
                                                                moment caused by waves up to a certain degree
                                                                provided that the ship's speed is sufficient. From
                                                                coastDat, statistics about weather-downtimes, e.g.
                                                                for operation with or without fin stabilizers may be
                                                                derived. The latter provides decision support for the
                                                                ship operator on whether the improvement of the
                                                                sea-keeping behaviour is worth the investment into a
                                                                roll stabilisation system.

                                                                C. Offshore wind farms
Figure 4. Differences of annual maximum storm surges between
                                                                   In the North Sea there are presently substantial
potential future (2071-2100) and present day (1960-1990)        efforts underway regarding the construction and
conditions obtained from tide-surge simulations using forcing   implementation of offshore wind farms. Design,
from different climate models and emission scenarios. Left      planning of construction and maintenance etc.
column: Response for the A2-emission scenario. Right column:
Response for the B2-emission scenario. Upper and lower row:
                                                                require long and homogeneous environmental data
Response for near-surface wind speeds from the RCAO regional    that are seldom available at the site. There is
climate model driven by two different global climate models.    presently considerable interest in the use of statistics
After Woth (2005) and Woth et al. (2006).                       derived from coastDat for such purposes. Weisse
                                                                and Günther (2007) have shown that there is a
provide valuable tools to optimize ship design with             reasonable agreement of such statistics when
respect to the expected environmental conditions on             estimated from observations and from coastDat
the route.                                                      data.
                                                                   As coastDat data are available for 60 years at high
                                                                spatial and temporal resolution the data are often
B. Environmentally based optimization of ship                   used to estimate the magnitude of rare events that
    design
                                                                may have considerable impacts on the site, such as
   Operability and safety on board, both constrained            the 50 year return value for near-surface wind speed
by severe weather conditions, are important factors             or significant wave height. Also joint probability
for short-sea shipping, especially for RoRo and                 distributions such as any combination of wind speed,
RoPax vessels. In ship design, sea-keeping                      wind direction, significant wave height, wave periods
simulations are used to account for these factors               and wave direction are frequently requested and
(Cramer et al. 2002). Generally, the motion of a ship           needed during the design process. A unique feature
in a sea state depends on several design                        of coastDat is the estimation of duration related
parameters (e.g. hull form, location of the center of           statistics, for instance how long severe sea state
gravity, radii of gyration etc.) and it cannot generally        conditions may last on the site. Similarly, statistics of
be concluded that a specific sea state is more or less          weather windows may be derived. For instance, the
severe for the ship than others. Instead the reaction           time window within which wave heights, on average,
of the ship to a design modification has to be                  remain below a given threshold (e.g. 2 m) may be
determined for each sea state by direct simulations             required to plan equipment and maintenance
(Cramer et al. 2002). In case the intended operating            schemes, or to estimate whether it would be feasible,
area and operation schedule are known already                   at a given probability, to arrange the site within a
during the design phase, this information can be                given timeframe, e.g. a season.
used to simulate the ship's motion in environmental
conditions to be expected in the operation area
during the lifetime of the vessel and to optimize the           D. Coastal protection
design with respect to the intended operational
                                                                   On the basis of coastDat local scenarios for future
profile. Detailed wind- and sea state information over
                                                                high water levels for coastal tide gauges have been
decades of years as given by coastDat are an
                                                                constructed (Grossmann et al. 2007). A statistical
excellent source of data for this kind of application.
                                                                relationship was constructed between observed high
   The coastDat data set has been used by the                   water levels at the North Sea and at the tide gauge
Flensburger Schiffbau-Gesellschaft to assess and                Hamburg (St. Pauli) located about 80 km upstream
optimize a RoRo-ferry operating in the North Sea.               within the estuary of the river Elbe. Subsequently,
Design parameters such as limiting accelerations                storm surge projections from coastDat were used to
and roll angles (Henning et al. 2006), slamming                 elaborate on potential future changes for Hamburg
impact loads (Stoye et al. 2008) and others have                (Figure 5). According to Grossmann et al. (2007) an
been investigated. When exceedance probabilities of             increase of the annual maximum high water levels in
operational limits were found to be unacceptable,               Hamburg of about 20 ± 20 cm appears possible and
design modifications had to be performed. For                   plausible for the time horizon of 2030. In 2085, the
example, when the occurrences of high roll angles               mean scenario for St. Pauli amounts to an increase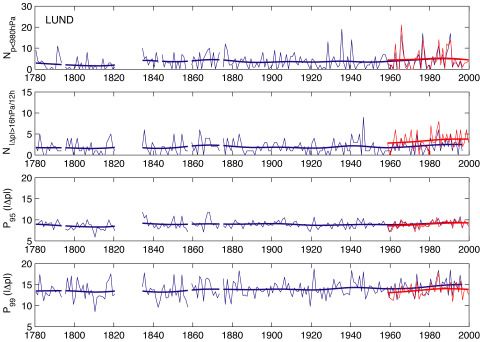
a)

Figure 5. Projections of climate change related modifications in
                                                                        b)
extreme high waters (incl. sea leve1 rise) in Cuxhaven (North
Sea) and Hamburg (St. Pauli), 2030 and 2085, based on
coastDat scenarios from different regional models and
emissions scenarios. Since the A2 and B2 scenarios do not
differ significantly the mean value is indicated across all models
and scenarios and the minimum and maximum range is shown
in addition. After Grossmann et al. (2007).                          Figure 6. (a) Section of the North Sea. Green, yellow, blue and
                                                                     magenta boxes denote areas in the vicinity of major shipping
                                                                     routes in which passive tracer simulations representing
of 64 ± 50 cm. These calculations employ a mean                      hypothetical oil accidents have been initiated. The black boxes
sea level rise of 9 cm for 2030 and of 29 and 33 cm                  labeled with red numbers indicate target regions in which the
(accounting for different scenarios) for 2085,                       impact of the accidents has been investigated. The gray mesh
respectively.                                                        indicates the computational grid of the ocean model. (b)
                                                                     Frequency distribution of the travel time that passive tracer
                                                                     particles started within the magenta source region need to reach
                                                                     target region 14 (Helgoland). The analysis is based on 65% of the
E. Oil risk modeling                                                 initial tracer particles that actually affect the target region within
                             1                                       13,615 simulations that were started within the period 1958-1999.
   A toolbox (PELETS-2d ) for Lagrangian drift                       Weathering of spilled oil was disregarded in this study.
modeling based on fields from coastDat has been
developed. An oil chemistry model may also be                        considerable consequences for emergency concepts
included and wind drift may or may not be taken into                 to be implemented.
account. The latter represents an essential forcing                     The analysis could be further refined by assuming
factor when oil spills or drifting materials are                     that the frequency of accidents but also the efficiency
considered.                                                          of oil fighting may actually depend on the current
   On the basis of coastDat PELETS-2d has been                       metocean conditions in each case. All information
applied to a number of problems including the                        needed for such studies would again be available
assessment of fresh water signals at Helgoland, the                  from coastDat.
comparison of station data with ship based
measurements, or the assessment of oil related
risks. An example is shown in Figure 6. Here oil                     F. Assessment of chronic oil pollution
accidents along a major shipping route have been                         The coastDat data set in combination with
considered based on coastDat. In order to estimate                   PELETS-2d has also been used for the interpretation
travel time statistics, such oil accidents have been                 of chronic oil pollution (Chrastansky et al. 2008).
represented by passive tracer simulations initialized                Chronic oil pollution predominantly results from
once every 28 hours over about five decades of                       illegal oil dumping and represents a major threat for
years. Subsequently potential impacts on different                   the marine environment. It is, however, difficult to
target regions have been examined. Such target                       quantify and often the number of oil-contaminated
regions may be defined, for instance, by their                       beached birds is used as an indirect indicator. It
potential sensitivity to the stranding oil. Figure 6b                turns out that for trend assessments the latter may
shows an example of a travel time distribution that                  be misleading. Chrastansky et al. (2008) show an
was obtained from such simulations. It can be                        example of two common sea bird species where the
inferred that, depending on weather conditions,                      variability observed within the number of corpses
eventually 65% of all particles reached the target                   registered during beached bird surveys for the
region. The most frequent travel time was found to                   German coast primarily reflects the inter-annual
be about 2-3 days. In some cases, however, travel                    variability of prevailing weather conditions (Figure 7).
times could be as small as 12 hours. The latter has                  In other words, variations within the number of
                                                                     beached birds may at least partially be a result of
  1
     Program for the Evaluation of Lagrangian Ensemble               changes and variations in atmospheric wind
Transport Simulations                                                conditions and changes over several years are not
Figure 7. Number of beached oil-contaminated Common
Scoters observed at the German coast (1992-2003) and number
of beached tracer particles simulated with PELETS-2d based on   Figure 8. Annual lead deposition (in tons) over the Baltic Sea,
coastDat (1958-2003) assuming a constant level of chronic oil   from measurement-based estimates (coloured bars) and the
pollution. All data are shown in standardized form. After       simulations from von Storch et al. (2003).
Chrastansky et al. (2008).

necessarily a proof that chronic pollution has                    V. SUMMARY AND OUTLOOK
reduced as a result of the implemented measures.                   The coastDat data set consists of a set of coastal
Chrastansky et al. (2008) therefore concluded that              analyses and scenarios for possible future
atmospheric variability needs to be accounted for in            developments. It constitutes a consistent meteo-
the interpretation of such data.                                marine (metocean) data set at high spatial and
                                                                temporal resolution available for the last 60 years. It
                                                                was shown that the statistics of extreme events can
G. Assessment of Policy Regulations                             be estimated from coastDat at a reasonable degree
  In a methodologically similar effort an analysis of           of approximation. So far the data set has been
the European regulations on the use of leaded                   developed mainly for the North Sea and adjacent
gasoline has been provided (von Storch et al. 2003).            areas. Efforts are presently underway to transfer the
Figure 8 shows the estimated deposition of lead into            approach to the statistics of polar lows (Zahn et al.
the Baltic Sea in 1958-1995. Obviously, the phasing             2008) or tropical regions (Feser and von Storch
out of lead as antiknock additive in gasoline was very          2008a, 2008b). Other extra-tropical regions such as
successful even if significant amounts of lead are still        the Baltic Sea are also considered. Similarly to the
found in coastal sediments.                                     effort on assessing the success of EU regulations on
                                                                the use of leaded gasoline attempts are underway to
                                                                simulate and assess long-term changes of persistent
H. Other Applications                                           organic pollutants in the marine environment.
   There are a number of other applications not                    The coastDat data set has been applied to a large
addressed in detail here. These include applications            number of different coastal and offshore applications
related to water quality studies or the definition of           ranging from ship design, to oil risk modeling and the
safety criteria for navigation. Data may also be used           construction and operation of offshore wind farms. It
for comparison of in-situ data taken at different               was shown that long-term variations in extreme
platforms. For example, data from a fixed station               weather conditions can be reliably derived making
have been compared with measurements taken on a                 the data set a particularly useful tool in the
ferry passing nearby. Here, usually a better                    interpretation of long-term changes and variability.
agreement between observations could be obtained
when currents from coastDat were used to simulate
water transports between the two observational                    ACKNOWLEDGMENT
sites. The time dependent simulated travel times                  Figure 3 and the comparison therein were kindly
provided an estimate of the time dependent time lag             provided by Lars Bärring from the Swedish
that had to be taken into account for a proper                  Meteorological and Hydrological Institute. Mrs.
comparison of the two observational time series. For            Gardeike kindly prepared Figures 5 and 8.
more details we refer to www.coastdat.de.
   Data from coastDat have also been used for some
terrestrial applications. For example, terrestrial                REFERENCES
biosphere models were driven with atmospheric
                                                                Alexandersson, H., H. Tuomenvirta, T. Schmidth and K. Iden, 2000.
input from coastDat to analyze gross primary                       Trends of storms in NW Europe derived from an updated pressure
productivity over Europe (Jung et al., 2007) or to                 data set. Climate Res., 14, 71-73.
examine and assess the European 2003 carbon flux                Bärring, L. and H. von Storch, 2004. Scandinavian storminess since
anomaly (Vetter et al., 2008).                                     about      1800.    Geophys.       Res. Lett.,  31,    L20202,
                                                                   doi:10.1029/2004GL020441.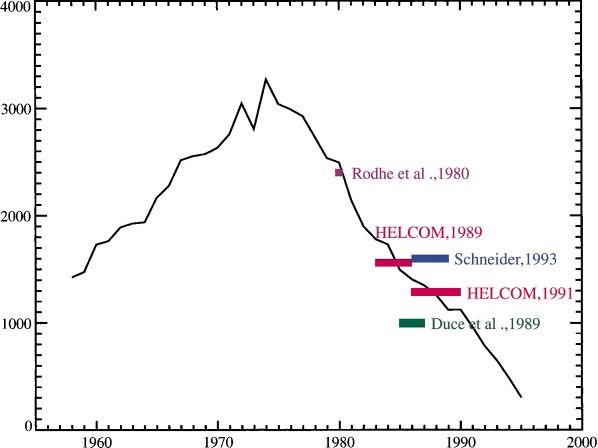
Christensen, J. H., T. Carter and F. Giorgi, 2002. PRUDENCE employs          Räisänen J., U. Hansson, A. Ullerstig, R. Döscher, L. Graham, C. Jones,
    new methods to assess European climate change. EOS, 83, 147.                M. Meier, P. Samuelsson and U. Willén, 2004. European climate in
Chratansky, A., U. Callies and D. Fleet, 2008. Estimation of the impact         the late twenty-first century: regional simulations with two driving
    of prevailing weather conditions on the occurrence of oil-                  global models and two forcing scenarios. Clim. Dyn. 22, 13-31.
    contaminated dead birds on the German North Sea coast. Environ.          Schmidt, H. and H. von Storch, 1993. German Bight storms analysed.
    Pollution, Submitted.                                                       Nature, 365, 791.
Cramer, H., S. Krüger, J. Tellkamp, and J. Falk, 2002. Kentersicherheit      Stoye, T., A. Bruns and A. Braathen, 2008. Evaluation of Slamming
    im Seegang. Abschlussbericht BMBF Vorhaben ROLL-S,                          Forces on the Bow of a RoPax-vessel. Hauptversammlung der
    Flensburger Schiffbau-Gesellschaft, 2002.                                   Schiffbautechnischen Gesellschaft, 103, to be published.
Feser, F. and H. von Storch, 2008a. A dynamical downscaling case             Vetter, M., G. Churkina, M. Jung, M. Reichstein, S. Zaehle, A.
    study for typhoons in SE Asia using a regional climate model. Mon.          Bondeau, Y. Chen, P. Ciais, F. Feser, A. Freibauer, R. Geyer, C.
    Wea. Rev., 136, 1806-1815.                                                  Jones, D. Papale, J. Tenhunen, E. Tomelleri, K. Trusilova, N. Viovy
Feser, F. and H. von Storch, 2008b. Regional modeling of the Western            and Martin Heimann, 2008. Analyzing the causes and spatial pattern
    Pacific typhoon season. Meteorol. Zeitschr., 17, doi:10.1127/0941-          of the European 2003 carbon flux anomaly in Europe using seven
    2948/2008/0282.                                                             models. Biogeosciences, 5, 561-583.
Feser, F., 2006. Enhanced detectability of added value in limited area       von Storch, H., M. Costa-Cabral, C. Hagner, F. Feser, J. Pacyna, E.
    model results separated into different spatial scales. Mon. Wea. Rev.,      Pacyna and S. Kolb, 2003. Four decades of gasoline lead emissions
    134, 2180-2190.                                                             and control policies in Europe: A retrospective assessment. The
                                                                                Science of the Total Environment, 311, 151-176.
Friedhoff, B. and M. Abdel-Maksoud, 2005. Per Simulation durch die
    Nordsee.                   http://www.forum-forschung.de/2005/pdf/       von Storch, H., H. Langenberg and F. Feser, 2000. A spectral nudging
    fofo2005_04_abdel01.pdf                                                     technique for dynamical downscaling purposes. Mon. Wea. Rev.,
                                                                                128, 3664-3673.
Grabemann, I. and R. Weisse, 2008. Climate change impact on extreme
    wave conditions in the North Sea: An ensemble study. Ocean               WASA, 1998: Changing waves and storms in the Northeast Atlantic?
    Dynamics, Accepted.                                                         Bull. Am. Meteorol. Soc., 79, 741-760.
Grossmann, I., K. Woth and H. von Storch, 2007. Localization of global       Weisse, R. and H. Günther, 2007. Wave climate and long-term changes
    climate change: Storm surge scenarios for Hamburg in 2030 and               for the Southern North Sea obtained from a high-resolution hindcast
    2085. Die Küste, 71, 169-182.                                               1958-2002. Ocean Dynamics, 57, 161-172.
Günther, H., W. Rosenthal, M. Stawarz, J.C. Carretero, M. Gomez,             Weisse, R. and A. Pluess, 2006. Storm-related sea level variations along
    I. Lozano, O. Serrano, and M. Reistad, 1998. The wave climate of            the North Sea coast as simulated by a high-resolution model 1958-
    the Northeast Atlantic over the period 1955-1994: The WASA wave             2002. Ocean Dynamics, 56, 16-25.
    hindcast. Global Atmos. Oc. System, 6, 121-164.                          Weisse, R., H. von Storch and F. Feser, 2005. Northeast Atlantic and
Henning, J., H. Billerbeck, G.F. Clauss, D. Testa, K.E. Brink, and W.           North Sea storminess as simulated by a regional climate model
    Kühnlein, 2006. Qualitative und quantitative validation of a                1958-2001 and comparison with observations. J. Clim., 18, 465-479.
    numerical code for the realistic simulation of various ship motion       Winterfeldt, J., 2008. Comparison of measured and simulated wind
    scenarios. OMAE2006-92245. In OMAE 2006, 25th International                 speed data in the North Atlantic, PhD thesis, GKSS Research
    Conference on Offshore Mechanics and Arctic Engineering,                    Center, GKSS Report 2008/2, 102 pages, Available from
    Hamburg, Germany, 2006.                                                     http://www.gkss.de/central_departments/library/publications/report2
IPCC, 2007. Climate Change 2007: The Physical Science Basis.                    008/index.html.de
    Contribution of Working Group I to the Fourth Assessment Report          Woth, K., R. Weisse, and H. von Storch, 2006: Climate change and
    of the Intergovernmental Panel on Climate Change [Solomon, S., D.           North Sea storm surge extremes: An ensemble study of storm surge
    Qin, M. Manning, Z. Chen, M. Marquis, K.B. Averyt, M. Tignor                extremes expected in a changed climate projected by four different
    and H.L. Miller (eds.)]. Cambridge University Press, Cambridge,             regional climate models. Ocean Dynamics, 56, 3-15.
    United Kingdom and New York, NY, USA, 996 pp.                            Woth, K. 2005. North Sea storm surge statistics based on projections in
Jung, M., M. Vetter, M. Herold, G. Churkina, M. Reichstein, S. Zaehle,          a warmer climate: How important are the driving GCM and the
    P. Cias, N. Viovy, A. Bondeau, Y. Chen, K. Trusilova, F. Feser and          chosen emission scenario? Geophys. Res. Lett., 32, L22708,
    M. Heimann, 2007. Uncertainties of modeling gross primary                   doi:10.1029/2005GL023762.
    productivity over Europe: A systematic study on the effects of using     Zahn, M., H. von Storch and S. Bakan, 2008. Climate mode simulations
    different drivers and terrestrial biosphere models. Global                  of North Atlantic polar lows in a limited area model. Tellus, doi:
    Biogeochemical Cycles, 21, GB4021, doi:10.1029/2006GB002915.                10.1111/j.1600-0870.2008.00330.x
Kalnay, E., M. Kanamitsu, R. Kistler, W. Collins, D. Deaven, L.
    Gandin, M. Iredell, S. Saha, G. White, J. Woollen, Y. Zhu, M.
    Chelliah, W. Ebisuzaki, W. Higgins, J. Janowiak, K.C. Mo, C.
    Ropelewski, J. Wang, A. Leetmaa, R. Reynolds, R. Jenne and D.
    Joseph, 1996. The NCEP/NCAR reanalysis project. Bull. Am.
    Meteorol. Soc., 77, 437-471.
You can also read