Lake O'Hara alpine hydrological observatory: hydrological and meteorological dataset, 2004-2017 - Earth System Science ...
←
→
Page content transcription
If your browser does not render page correctly, please read the page content below
Earth Syst. Sci. Data, 11, 111–117, 2019
https://doi.org/10.5194/essd-11-111-2019
© Author(s) 2019. This work is distributed under
the Creative Commons Attribution 4.0 License.

               Lake O’Hara alpine hydrological observatory:
            hydrological and meteorological dataset, 2004–2017
                                                Jesse He and Masaki Hayashi
                              Department of Geoscience, University of Calgary, Alberta, Canada
                                        Correspondence: Jesse He (jehe@ucalgary.ca)

                                     Received: 16 July 2018 – Discussion started: 2 August 2018
                       Revised: 12 December 2018 – Accepted: 30 December 2018 – Published: 22 January 2019

       Abstract. The Lake O’Hara watershed in the Canadian Rockies has been the site of several hydrological inves-
       tigations. It has been instrumented to a degree uncommon for many alpine study watersheds. Air temperature,
       relative humidity, wind, precipitation, radiation, and snow depth are measured at two meteorological stations near
       Lake O’Hara and in the higher elevation Opabin Plateau. Water levels at Lake O’Hara, Opabin Lake, and several
       stream gauging stations are recorded using pressure transducers and validated against manual measurements.
       Stage–discharge rating curves were determined at gauging stations and used to calculate discharge from stream
       stage. The database includes additional data such as water chemistry (temperature, electrical conductivity, and
       stable isotope abundance) and snow survey (snow depth and density) for select years, as well as geospatial data
       (elevation and land cover). This dataset will be useful for the future study of alpine regions, where substantial
       and long-term hydrological datasets are scarce due to difficult field conditions. The dataset can be accessed at
       https://doi.org/10.20383/101.035.

1   Introduction                                                   the Canadian Rocky Mountains (see Site description below)
                                                                   in 2004. The observatory has supported a series of studies
Mountains are an important source of water for downstream          designed to identify important alpine aquifer units and char-
regions (Viviroli et al., 2007). The hydrology of mountains        acterize their hydrogeological functions (Roy and Hayashi,
in midlatitude and high-latitude regions is dominated by the       2009; Langston et al., 2011; Muir et al., 2011; Hood and
storage of water in the form of snowpack and glaciers, which       Hayashi, 2015). The observatory was integrated into a larger
provide meltwater to headwater streams during the melt sea-        hydrological monitoring network under the Changing Cold
son (Barnett et al., 2005). Climate warming can influence          Regions Network (CCRN) in 2013 (DeBeer et al., 2016).
these processes through changes in the timing of snow ac-          The unique dataset collected to date is available to the public
cumulation and melt, the transition towards more rain and          through the CCRN data server. The objective of this paper
less snow, and depletion of glaciers and mountain permafrost       is to describe the physiographical characteristics of the Lake
(Bales et al., 2006). While it is straightforward to understand    O’Hara watershed, the history of the hydrological observa-
the effects of these changes on the timing and magnitude           tory, and the methods of data collection and processing for
of spring freshet, their effects on the flow during low-flow       the potential users of the dataset.
periods is uncertain because groundwater can store and re-
lease meltwater, thereby buffering the effects of warming
(Tague and Grant, 2009). However, groundwater processes            2   Site description
in alpine headwaters are not well understood due to the lack
of long-term, field-based studies examining the interaction        The Lake O’Hara watershed in Yoho National Park has an
of surface water and groundwater in alpine zones. To ad-           area of 14 km2 and ranges in elevation from 1996 to 3440 m
dress this gap in knowledge, an alpine hydrological obser-         above sea level (m a.s.l.) (Fig. 1). The site is accessible via
vatory was established in the watershed of Lake O’Hara in          an 11 km dirt road up to Lake O’Hara. Raw mean annual

Published by Copernicus Publications.
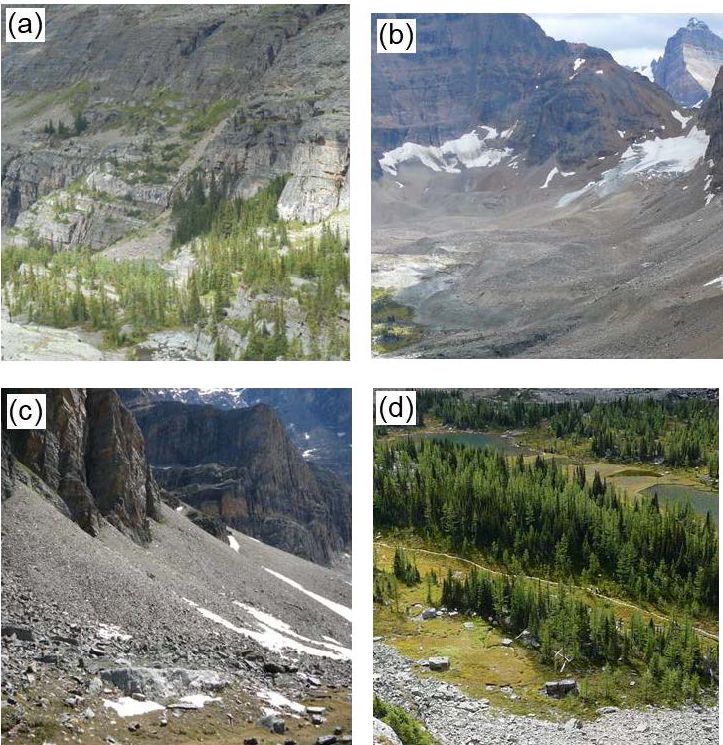
112                                                        J. He and M. Hayashi: Lake O’Hara alpine hydrological observatory

Figure 1. Topographic map of the Lake O’Hara watershed indicating major land cover units and locations of installed equipment. Stream
gauging stations are (1) O’Hara outlet, (2) Mary, (3) Oesa Falls, (4) West Opabin, (5) East Opabin, (6) Gorge, (7) Upper Opabin,
(8) Hungabee, and (9) Lefroy Oesa. Stilling wells are (10) Lake O’Hara and (11) Opabin Lake. See Table S3 for station coordinates. Land
cover delineation was based on 2006 aerial photography; current glacial extents are smaller than indicated on the map.

precipitation measured within the watershed at the Opabin             ish and Simony, 1995; Price et al., 1980). Bedrock is typi-
automatic weather station (OPAWS) was 1021 mm during                  cally exposed at higher elevations as part of ridges which ring
2005–2017. After adjustment for noise- and wind-induced               the watershed (Fig. 2a). Overburden deposits (e.g. talus and
undercatch (Kochendorfer et al., 2017), corrected annual pre-         moraine) are present throughout the region, and are found in
cipitation at OPAWS was 1113 mm. Mean monthly air tem-                association with steeper bedrock slopes and small glaciers
peratures at OPAWS range from −9.0 (January) to 10.2 ◦ C              (Fig. 2b and c). These deposits play an important role in
(July).                                                               groundwater and surface water exchange throughout the wa-
   Bedrock throughout the watershed consists mainly of                tershed (Langston et al., 2011; Muir et al., 2011; Roy and
quartzite of the Cambrian Gog Group. At higher elevations,            Hayashi, 2009). For example, 70 %–80 % of flow in Up-
carbonate of the Cathedral, Mt. Whyte, Stephen, and El-               per Opabin Creek is provided from a large talus–moraine
don formations may be found capping mountains (Lickor-                complex present in the Opabin Plateau (Hood and Hayashi,

Earth Syst. Sci. Data, 11, 111–117, 2019                                                www.earth-syst-sci-data.net/11/111/2019/
J. He and M. Hayashi: Lake O’Hara alpine hydrological observatory                                                              113

                                                                     conducted within the watershed. Study-specific data include
                                                                     measurements from temporary sensors and stream gauging
                                                                     stations as well as extensive geophysical, geochemical, and
                                                                     snow survey data. The CCRN dataset only includes consis-
                                                                     tent measurements from permanent weather stations, lake
                                                                     stilling wells, and stream gauging stations (Fig. 1) over the
                                                                     years of 2004–2017. Some chemistry and snow survey mea-
                                                                     surements are also included for select years.

                                                                     3     Methods

                                                                     3.1    Meteorological data

                                                                     Two permanent weather stations are present within the Lake
                                                                     O’Hara watershed (Fig. 1). OHAWS is located 500 m north-
                                                                     west of Lake O’Hara at an elevation of 2024 m a.s.l. OPAWS
                                                                     is located on the Opabin Plateau at 2230 m a.s.l.
                                                                        Both stations are equipped with air temperature and rel-
                                                                     ative humidity sensors (Vaisala, HMP35) which are kept
                                                                     within solar radiation shields to mitigate the influence of di-
                                                                     rect sunlight on measurements. Wind speed and direction are
                                                                     measured with vane anemometers (RM Young, 05103). A
Figure 2. Major hydrogeological response units in the Lake O’Hara    four-component radiometer (Kipp & Zonen, CNR-1) mea-
watershed. (a) Exposed bedrock. (b) Proglacial moraine. (c) Talus.   sures incoming and outgoing fluxes of longwave and short-
(d) Alpine meadow.
                                                                     wave radiation at OPAWS. At OHAWS, a net radiometer
                                                                     (Kip & Zonen, NR-Lite) measures net radiation flux. Both
                                                                     stations have an ultrasonic snow depth sensor (Campbell
2015). Surface water bodies such as Opabin Lake, Hungabee            Science, SR50) measuring the distance between the sen-
Lake, and the eponymous Lake O’Hara are found at lower               sor and the ground or the snow level below. Temperature-
elevations in the watershed. Previous study has indicated ac-        compensated snow depth data are calculated from raw SR50
tive interaction between lakes and groundwater (Roy and              data and the sensor height. All aforementioned sensors are
Hayashi, 2008). Groundwater input to Lake O’Hara was es-             mounted on a tripod at both stations. Recent sensor heights
timated to equal 35 %–74 % of surface outflow from the lake          are listed in Table 1. Measurements are taken every minute,
in 2005 (Hood et al., 2006). Alpine meadows (Fig. 2d) are            and average values are recorded at an interval of 60 and
generally found in close association with surface water bod-         30 min at OHAWS and OPAWS, respectively.
ies and are important sites for hydrological and ecological             Tipping bucket rain gauges (Hydrological Services,
processes (McClymont et al., 2010).                                  CS700) and weighing cumulative precipitation gauges
    Compared to other high-elevation lakes in the region, the        (Geonor, T200B) are installed at both stations. Both types of
Lake O’Hara hydrological observatory is easily accessible            precipitation gauge are suitable for measuring liquid precipi-
by a road, yet relatively undisturbed (road access is only al-       tation; however, only the weighing gauge is capable of mea-
lowed for a small number of authorized vehicles), making             suring solid precipitation. Tipping bucket gauges are placed
it ideal for the study of alpine hydrological processes. Mon-        on the ground, away from the main weather station tripod.
itoring at Lake O’Hara began in 2004 with the installation           Weighing gauges are mounted on a freestanding base and are
of OHAWS, OPAWS, and several stream gauging and wa-                  equipped with an Alter wind shield to reduce wind-related
ter level monitoring stations (Fig. 1). Some change has been         snow undercatch. Precipitation and relative humidity sensors
made to the number and locations of gauging stations. Since          are calibrated yearly in order to ensure that they continue to
2009, the Gorge gauging station has replaced the East and            accurately record measurements. However, relative humid-
West Opabin stations for the measurement of discharge in             ity measurements fail to reach 100 % in several years, pos-
the lower reaches of Opabin Creek. In Oesa Creek, measure-           sibly due to the instrumental accuracy (2 % reported by the
ments of discharge have been taken at the Oesa Falls (2005–          manufacturer) affecting the two-point calibration procedure
2006, 2008 and 2014–2017) and Lefroy Oesa (2013–2014)                using the saturated chemical solutions with known equilib-
gauging stations over different years. Water levels at Lake          rium humidity. In particular, the higher end of the data was
O’Hara and Opabin Lake have been measured continuously               substantially under-calibrated during 2011–2013, with max-
during the ice-free season since 2004. Additional equipment          imum values reaching only 91 %. However, we have opted
has been installed and removed as part of previous studies           to keep the raw values in the database rather than making a

www.earth-syst-sci-data.net/11/111/2019/                                               Earth Syst. Sci. Data, 11, 111–117, 2019
114 J. He and M. Hayashi: Lake O’Hara alpine hydrological observatory
Table 1. Current sensor height measurements at OHAWS and
OPAWS. A more complete record of sensor height changes over
the 2004–2017 monitoring period is available in Table S4 in the
Supplement. NA denotes data that are not available.
Sensor Sensor height (m)
OPAWS OHAWS
Snow depth 2.4 2.2
Air temperature/humidity 2.5 2.2
Net radiation NA 2.0
Wind 4.1 3.1
Cumulative precipitation 2.4 2.2
Four component radiation 2.7 NA
Figure 3. Relationship between daily winter precipitation at
subjective correction and introducing another degree of un- OHAWS (POH ) and OPAWS (POP ). Daily precipitation was cor-
certainty. rected for instrument noise- and wind-induced undercatch. Plotted
Meteorological measurements in the dataset are presented daily precipitation was sampled from the entire monitoring period
(2004–2017) for days between 1 December and 30 April, for which
largely in raw form; some effort has been made to remove er-
both OPAWS and OHAWS were recording and correctly function-
roneous data due to sensor malfunction or maintenance in the
ing the entire day. R 2 is the coefficient of determination.
raw dataset, but the data have largely been spared from other
corrections. Precipitation data are available in both raw and
corrected form. The corrected precipitation dataset has been
Pressure transducers (In-Situ, Minitroll; In-Situ, Level-
adjusted for noise- and wind-induced undercatch (Kochen-
Troll; Solinst, Levelogger) are installed in stilling wells at
dorfer et al., 2017). Undercatch-corrected precipitation was
each stream gauging station and automatically record water
8.6 % and 0.3 % higher than raw precipitation at OPAWs and
level and temperature in 15 min intervals. To verify the trans-
OHAWS respectively. From 2011 to 2016, snow has been
ducer data, water levels are measured manually from a ref-
observed to accumulate at the top of the OHAWS weighing
erence (staff gauge or stilling well) with discharge measure-
precipitation gauge and persist over the span of several weeks
ments. A power function is used to define the rating curve,
in the wintertime. This accumulation effectively blocks the
which is calibrated each year to find a coefficient and expo-
opening of the gauge (i.e. snow capping), resulting in a pe-
nent which minimize error between measured and computed
riod of time during which no precipitation is registered. We
discharge. With the rating curve, a near-continuous record of
attempt to approximate this missing data at OHAWS from
stream discharge can be calculated from the transducer data.
measurements recorded at OPAWS in the corrected dataset.
Hourly and half-hourly averaged discharge is included within
Comparison of noise and undercatch-corrected daily precip-
the dataset. Discharge is only measured from spring (typi-
itation between the two weather stations indicates a linear
cally early June) to fall (typically late September) of each
correlation (Fig. 3). Using the trend line from Fig. 3, pre-
year due to winter freeze-up in stream channels.
cipitation at OHAWS was approximated and used to fill in
gaps during periods of snow capping. Table S1 in the Sup-
plement lists the date ranges for which precipitation was ap- 3.3 Lake water level
proximated, and total approximated precipitation.
Pressure transducers housed in stilling wells are used at water
level monitoring stations in Lake O’Hara and Opabin Lake
3.2 Stream discharge
(Fig. 1). Transducer water levels are compared with man-
Gauging stations are located at the outlets of Lake O’Hara ual measurements of water level taken during field visits.
and Hungabee Lake and along reaches of several creeks At Lake O’Hara, manual measurements are taken as the dis-
(Fig. 1). To establish the discharge–stage rating curve, bi- tance from the top of the stilling well casing to the lake wa-
weekly manual discharge measurements are taken at each ter level. At Opabin Lake, manual measurements are taken
station over field seasons which typically last from early June as the distance from a rock bolt (securing the stilling well)
to late September. Average stream flow velocity and water to the lake water level. Within the dataset, both raw water
depth are measured in segments 10 or 25 cm wide across the level (depth of water above the transducer) and corrected wa-
width of a stream with a propeller flow meter (Global Wa- ter level are included. Corrected water level is normalized
ter, FP101), and discharge is calculated by the area–velocity against the benchmark and is calculated as the distance be-
method (Dingman, 2002, p. 609). tween the benchmark and the water level. Therefore, the cor-
rected water level increases when the lake water level (and
Earth Syst. Sci. Data, 11, 111–117, 2019 www.earth-syst-sci-data.net/11/111/2019/J. He and M. Hayashi: Lake O’Hara alpine hydrological observatory 115
raw water level) drops. The same is true in reverse. Nega-
tive values of corrected water level indicate periods when the
lake water level is above the datum. Corrected water levels
are not available in several years due to inconsistent manual
measurement and recording of lake water levels (Table S2).
Water levels are only available from spring to fall of each
year due to freeze-up.
3.4 Snow surveys
Snow depth and density are measured annually in mid-April
to capture the amount of peak accumulation. The extent of
these snow surveys has varied over the years, from a hand-
ful of transects nearby OHAWS and OPAWS to hundreds of
measurements spanning the entire Opabin Plateau. Snow sur-
veys are typically conducted by laying a measurement chain
along the survey transect and measuring snow depth at a fixed
interval with a probe or ruler. Snow density measurements
are taken along the survey transect or from snow pits (see
Hood and Hayashi, 2015 for details). Handheld Global Posi-
tioning System devices are used to locate depth and density
measurement points. Snow survey data from 2006 to 2017
are included within the dataset. Before 2012, measurements Figure 4. (a) Annual total and winter (14 October–30 April) pre-
near OHAWS were made inconsistently, but in more recent cipitation at OPAWS. (b) Mean annual and winter (14 October–
years, data from both OPAWS and OHAWS have been avail- 30 April) air temperature at OPAWS. (c) First day of complete melt
able (Table S2 in the Supplement). at OPAWS. Data are missing in 2012 due to sensor malfunction.
(d) First day of snow accumulation at OPAWS. (e) June–September
total runoff at the Lake O’Hara outlet.
3.5 Water sample collection and analysis
Stream water and rain samples are collected during bi-
weekly site visits. Stream water is sampled at most gaug- maps of the region, possibly resulting from inconsistency in
ing stations (Fig. 1). During sampling, water is filtered in the elevation datum used during the lidar survey. However,
the field using 0.45 µm disposable filters and stored in pre- the lidar DEM still represents topography within the water-
rinsed polyethylene bottles. Electrical conductivity and tem- shed accurately. Also included are several ArcMap (ESRI,
perature of stream water are measured during collection 2014) shapefiles which classify land cover throughout the
with handheld meters (VWR, 2052-B; Omega Engineering, watershed (Fig. 1). Land cover was classified manually from
HH-25TC). Rain samples are collected from samplers de- an aerial photo taken in August 2006.
ployed near both weather stations and Opabin Lake. Depth-
integrated snow samples were collected from snow pits dur-
ing snow survey campaigns in 2015 and 2016, and subsam- 4 Data examples
ples of entire meltwater were kept for isotope analysis. All
water samples are stored at 4 ◦ C until analysis. Oxygen- Figure 4 show the annual time series of hydro-meteorological
18 and deuterium isotope abundances are measured in all parameters indicating the inter-annual variability of hydro-
collected samples using an off-axis integrated-cavity spec- logical fluxes during hydrological years (HYs) 2006–2017.
trometer (Los Gatos Research, DLT-100). This dataset in- Note that the HYs in these plots are defined as 1 October–
cludes chemical and stable isotope data collected from 2004 30 September; e.g., HY2006 starts on 1 October 2005. Win-
to 2008, 2013, and from 2015 to 2016. ter is defined as 14 October–30 April because the average
start date of snow accumulation is 14 October, and the accu-
3.6 Spatial data
mulation normally peaks in late April. Annual total precipita-
tion at Opabin AWS ranged between 920 and 1394 mm with
The dataset includes a 2 m resolution digital elevation model a mean of 1113 mm, while winter precipitation ranged be-
(DEM) of the Lake O’Hara region derived from the light tween 475 and 785 mm with a mean of 612 mm (Fig. 4a). The
detecting and ranging (lidar) data (Hopkinson et al., 2009). ratio of winter to total precipitation ranged between 0.46 and
Some difference in elevation has been found between the li- 0.65. Annual mean and winter mean air temperature ranged
dar DEM provided and older, lower resolution topographic from −2.4 to −0.1 ◦ C and from −8.9 to −5.4 ◦ C, respec-
www.earth-syst-sci-data.net/11/111/2019/ Earth Syst. Sci. Data, 11, 111–117, 2019116 J. He and M. Hayashi: Lake O’Hara alpine hydrological observatory
tively (Fig. 4b). There was no noticeable trend in any of these Competing interests. The authors declare that they have no con-
parameters. flict of interest.
The timing of snow accumulation and melt are believed to
respond sensitively to the climate warming (e.g. Barnett et
al., 2005). We define the first day of accumulation at Opabin Special issue statement. This article is part of the special issue
AWS as the day when snowpack starts to persist continu- “Water, ecosystem, cryosphere, and climate data from the interior
ously, and the first day of complete melt as the day when of Western Canada and other cold regions”. It is not associated with
a conference.
the snow depth sensor indicates no snow. These dates var-
ied widely with the first day of melt from 29 May to 3 July
(Fig. 4c) and the first day of accumulation from 28 Septem-
Acknowledgements. The field program at Lake O’Hara was
ber to 26 October (Fig. 4b), but there was no noticeable trend. assisted by numerous field assistants, who are too many to name.
The total discharge (i.e. watershed runoff) during June– We especially thank the graduate students and post-doctoral fellows
September measured at the Lake O’Hara outlet had large who conducted hydrological research projects: Jaime Hood,
variability (Fig. 4e) and was positively correlated with to- James Roy, Danika Muir, Greg Langston, and Andrius Paznekas.
tal annual precipitation (r, correlation coefficient = 0.78; We also thank field technicians who took responsibility for data
p, significance level = 0.003) and winter precipitation (r = collection and quality control: Mike Toews, Jacqueline Schmidt,
0.65, p = 0.02), as expected. Previous studies in the re- Nathan Green, Jackie Randall, Kate Forbes, Krystal Chin,
gion have shown that late-summer flow in alpine streams Shelby Snow, and Brandon Hill. Chris Hopkinson and the Cana-
is predominantly sourced by groundwater (e.g. Hood and dian Consortium for Lidar Environmental Application Research
Hayashi, 2015; Harrington et al., 2018). However, dis- provided lidar data for the DEM, Parks Canada and Lake O’Hara
Lodge provided logistical support, and Branko Zdravkovic and
charge in September (not plotted) was not correlated to ei-
Amber Peterson assisted with data transfer and archiving. The
ther total annual precipitation (r = 0.01, p = 0.75) or June–
program has been funded by Natural Sciences and Engineering
August precipitation (r = 0.003, p = 0.86), suggesting that Research Council (Discovery Grant, CCRN), the Biogeoscience
the groundwater discharge rate may be controlled by factors Institute of the University of Calgary, Alberta Ingenuity Centre
other than precipitation, such as the storage capacity or trans- for Water Research, the Canadian Foundation for Climate and
missivity of aquifers. Atmospheric Sciences (IP3 Network), the Canada Foundation for
Innovation, the Canada Research Chair program, and Environment
Canada. Constructive comments by Ignacio López-Moreno and
5 Data availability an anonymous reviewer contributed to improved clarity of the paper.
Edited by: Chris DeBeer
The Lake O’Hara dataset is available from the Federated
Reviewed by: J. Ignacio López-Moreno and one anonymous referee
Research Data Repository (FRDR), and can be accessed
from the FRDR at https://doi.org/10.20383/101.035 (He and
Hayashi, 2018).
References
6 Final remarks Bales, R. C., Molotch, N. P., Painter, T. H., Dettinger, M.
D., Rice, R., and Dozier, J.: Mountain hydrology of the
The data from the Lake O’Hara hydrological observa- western United States, Water Resour. Res., 42, 08432,
tory have contributed significantly to our understanding of https://doi.org/10.1029/2005WR004387, 2006.
groundwater processes in alpine environments. The long- Barnett, T. P., Adam, J. C., and Lettenmaier, D. P.: Po-
term dataset can be used to examine the inter-annual vari- tential impacts of a warming climate on water avail-
ability of hydrological fluxes and the timing of snow accu- ability in snow-dominated regions, Nature, 438, 303–309,
mulation and melt, and their long-term trends. The unique https://doi.org/10.1038/nature04141, 2005.
DeBeer, C. M., Wheater, H. S., Carey, S. K., and Chun, K. P.: Recent
dataset will be valuable to alpine hydrological research com-
climatic, cryospheric, and hydrological changes over the interior
munities for various purposes such as inter-site comparison of western Canada: a review and synthesis, Hydrol. Earth Syst.
of hydrological processes or hydrological model testing. Sci., 20, 1573–1598, https://doi.org/10.5194/hess-20-1573-2016,
2016.
Dingman, S. L.: Physical Hydrology, Prentice Hall Inc., Upper Sad-
Supplement. The supplement related to this article is available dle River, New Jersey, USA, 2002.
online at: https://doi.org/10.5194/essd-11-111-2019-supplement. ESRI: ArcMap, 10.3 edn., ArcGIS, Esri, Environmental Systems
Research Institute, Redlands, CA, USA, 2014.
Harrington, J. S., Mozil, A., Hayashi, M., and Bentley, L. R.:
Author contributions. Both authors were involved with data col- Groundwater flow and storage processes in an inactive rock
lection, data processing and the writing of the paper. glacier, Hydrol. Process., 32, 3070–3088, 2018.
Earth Syst. Sci. Data, 11, 111–117, 2019 www.earth-syst-sci-data.net/11/111/2019/J. He and M. Hayashi: Lake O’Hara alpine hydrological observatory 117 He, J. and Hayashi, M.: Hydrological and meteorological McClymont, A. F., Hayashi, M., Bentley, L. R., Muir, D., and dataset from the Lake O’Hara alpine hydrological obser- Ernst, E.: Groundwater flow and storage within an alpine vatory, 2004–2017, Federated Research Data Repository, meadow-talus complex, Hydrol. Earth Syst. Sci., 14, 859–872, https://doi.org/10.20383/101.035, 2018. https://doi.org/10.5194/hess-14-859-2010, 2010. Hood, J. L. and Hayashi, M.: Characterization of snowmelt flux and Muir, D. L., Hayashi, M., and McClymont, A. F.: Hydrological groundwater storage in an alpine headwater basin, J. Hydrol., storage and transmission characteristics of an alpine talus, Hy- 521, 482–497, https://doi.org/10.1016/j.jhydrol.2014.12.041, drol. Process., 25, 2954–2966, https://doi.org/10.1002/hyp.8060, 2015. 2011. Hood, J. L., Roy, J. W., and Hayashi, M.: Importance of groundwa- Price, R. A., Cook, D. G., Aitken, J. D., and Mountjoy, E. W.: Geol- ter in the water balance of an alpine headwater lake, Geophys. ogy, Lake Louise, Alberta and British Columbia, Geol. Surv. of Res. Lett., 33, L13405, https://doi.org/10.1029/2006GL026611, Can., Ottawa, Ontario, Canada, 1980. 2006. Roy, J. W. and Hayashi, M.: Groundwater exchange with two Hopkinson, C., Hayashi, M., and Peddle, D.: Comparing alpine wa- small alpine lakes in the Canadian Rockies, Hydrol. Process., 22, tershed attributes from LiDAR, photogrammetric, and Contour- 2838–2846, https://doi.org/10.1002/hyp.6995, 2008. based digital elevation models, Hydrol. Process., 23, 451–463, Roy, J. W. and Hayashi, M.: Multiple, distinct ground- 2009. water flow systems of a single moraine-talus fea- Kochendorfer, J., Nitu, R., Wolff, M., Mekis, E., Rasmussen, R., ture in an alpine watershed, J. Hydrol., 373, 139–150, Baker, B., Earle, M. E., Reverdin, A., Wong, K., Smith, C. D., https://doi.org/10.1016/j.jhydrol.2009.04.018, 2009. Yang, D., Roulet, Y.-A., Buisan, S., Laine, T., Lee, G., Aceituno, Tague, C. and Grant, G. E.: Groundwater dynamics me- J. L. C., Alastrué, J., Isaksen, K., Meyers, T., Brækkan, R., diate low-flow response to global warming in snow- Landolt, S., Jachcik, A., and Poikonen, A.: Analysis of single- dominated alpine regions, Water Resour. Res., 45, 1–12, Alter-shielded and unshielded measurements of mixed and solid https://doi.org/10.1029/2008WR007179, 2009. precipitation from WMO-SPICE, Hydrol. Earth Syst. Sci., 21, Viviroli, D., Dürr, H. H., Messerli, B., Meybeck, M., and Wein- 3525–3542, https://doi.org/10.5194/hess-21-3525-2017, 2017. gartner, R.: Mountains of the world, water towers for humanity: Langston, G., Bentley, L. R., Hayashi, M., McClymont, A., and Typology, mapping, and global significance, Water Resour. Res., Pidlisecky, A.: Internal structure and hydrological functions of 43, 1–13, https://doi.org/10.1029/2006WR005653, 2007. an alpine proglacial moraine, Hydrol. Process., 25, 2967–2982, https://doi.org/10.1002/hyp.8144, 2011. Lickorish, W. H. and Simony P. S.: Evidence for late rifting of the Cordilleran margin outlined by stratigraphic division of the Lower Cambrian Gog Group, Rocky Mountain Main Ranges, British Columbia and Alberta, Can. J. Earth Sci., 32, 860–874, 1995. www.earth-syst-sci-data.net/11/111/2019/ Earth Syst. Sci. Data, 11, 111–117, 2019
You can also read