Monitoring the live reef food fi sh trade: Lessons learned from local and global perspectives
←
→
Page content transcription
If your browser does not render page correctly, please read the page content below
36     SPC Live Reef Fish Information Bulletin #17 – November 2007

                    Monitoring the live reef food fish trade:
                    Lessons learned from local and global perspectives
                                                                    Helen Scales1, Andrew Balmford and Andrea Manica
There are widespread concerns that the live reef                    describe the dynamics of the geographic spread of
food fish trade (LRFFT) is causing overexploitation                 the trade across countries. Despite the high value of
of populations of coral reef fishes (Johannes and                   the LRFFT, there is a relatively small volume of live
Riepen 1995; Bentley 1999; Lau and Parry-Jones 1999;                reef fish traded internationally compared with oth-
Sadovy et al. 2003; Hamilton and Matawai 2006). A                   er global fisheries. Consequently fisheries statistics
major challenge for achieving sustainable manage-                   rarely include live reef fish in a separate category
ment of the LRFFT is obtaining data needed to quan-                 (Cesar et al. 2000).
tify the influence of the trade on the natural resource
base and to accurately characterize the trade in terms              For our study, complete figures for imports of live
of spatial and temporal patterns. Such information                  reef fish to Hong Kong from 1988 to 2003 were col-
is necessary for monitoring the impact of the trade                 lected directly from the Hong Kong Census and
on particular species (for example to provide non-                  Statistics Department (CSD). This dataset went
detriment findings required for trading the CITES                   further back in time than the previously available
Appendix II-listed humphead wrasse,2 Cheilinus                      Hong Kong import datasets, such as those used by
undulatus; Chu et al. 2006) and for informing man-                  Johannes and Riepen 1995, McGilvray and Chan
agement initiatives, both in existing fisheries and in              2002, Sadovy et al. 2003, and Muldoon et al. 2005.
countries where the trade has not yet arrived.                      A shortcoming of the existing system for recording
                                                                    live reef imports into Hong Kong is the fact that ap-
We have been involved in two recently published                     proximately 100 locally licensed fishing and trans-
studies quantifying the dynamics and impacts of                     port vessels are exempt from the declaration of im-
the LRFFT at two different geographic scales: first,                ports of live reef fish (Sadovy et al. 2003; Muldoon
we investigated the global dynamics and regional                    et al. 2005). The total mass of live fish recorded by
impacts of the LRFFT using Hong Kong import                         the CSD is therefore an underestimate of the to-
data (Scales et al. 2006), and second, we assessed                  tal imports into Hong Kong. In 1998 a voluntary
the local impacts of the LRFFT on populations of                    scheme was set in place by the Agriculture, Fisher-
coral reef fish in northern Borneo using fish catch                 ies and Conservation Department (AFCD) to record
data from traders (Scales et al. 2007). Due to the                  volumes of live fish being imported by locally reg-
nature of the datasets collected, both of these stud-               istered vessels. According to these AFCD statistics,
ies provided insights into the temporal and spatial                 between 1998 and 2002 the locally registered vessels
dynamics of the LRFFT. Here we give an overview                     that participated in this voluntary scheme imported
of these two studies, highlighting the data collec-                 an additional 13–53% of the fish biomass recorded
tion methods used and the features of the datasets                  by the CSD. It has been estimated that 60% of live
that made them especially useful in monitoring the                  reef food fish traded internationally is imported
LRFFT. Based on lessons learned from these studies                  into Hong Kong (Sadovy et al. 2003), hence data on
we make recommendations for future monitoring                       its imports are likely to be indicative of the dynam-
of the LRFFT.                                                       ics and structure of the LRFFT as a whole. In addi-
                                                                    tion, past trade studies have suggested that because
Analysing global trends in the LRFFT                                Hong Kong is a duty-free port, its trade statistics
                                                                    are likely to reflect actual trade volumes more ac-
The LRFFT has spread dramatically since its ini-                    curately than those from elsewhere, since there is
tiation in Hong Kong in the 1970s (Johannes and                     little incentive to under-report declared imports in
Riepen 1995; Sadovy et al. 2003). We recently looked                order to reduce tariffs (Lau and Parry-Jones 1999;
in detail at historical data in order to quantitatively             Clarke 2004).

1. Department of Zoology, University of Cambridge, Downing Street, Cambridge, CB2 3EJ, UK. Email: helenscales@cantab.net
2. International trade is permitted for species listed on Appendix II of the Convention on International Trade in Endangered Species
   of Wild Fauna and Flora (CITES) but only where it can be demonstrated that harvesting does not have a detrimental impact on wild
   populations.
SPC Live Reef Fish Information Bulletin #17 – November 2007
37
Table 1. Revised trade categories of live reef fish imported to Hong Kong, as recorded in AFCD records from 1997
onwards.
Common name used by AFCD FAO common name Scientific name
Giant grouper Giant grouper Epinephelus lanceolatus
High-finned grouper Humpback grouper Cromileptes altivelis
Green grouper Orange-spotted grouper Epinephelus coioides
Tiger grouper Brown-marbled grouper Epinephelus fuscoguttatus
Flowery grouper Camouflage grouper Epinephelus polyphekadion
Leopard grouper Leopard coralgrouper Plectropomus leopardus
Spotted grouper Spotted coralgrouper Plectropomus maculatus
Humphead wrasse Humphead wrasse Cheilinus undulatus
Mangrove snapper Mangrove red snapper Lutjanus argentimaculatus
Before 1997, CSD trade data were only available as Accelerating global expansion of the LRFFT
totals of “live marine fish” from a given exporting
nation. However, since all the other import catego- In order to assess the speed at which the LRFFT
ries included freshwater and non-reef marine fish, has spread away from Hong Kong, we collated
we assumed that this “live marine fish” category available published start-up dates of the trade
represented mostly coral reef fish. Species-specific in individual exporting countries (Johannes and
import data were available from 1997 onwards, fol- Riepen 1995; Bentley 1999) and measured the di-
lowing an initiative from the AFCD to revise the rect distance (in km) from the capital city of each
trade categories (Table 1). exporting country to Hong Kong. These data indi-
cated that the LRFFT has been spreading to new
Our newly compiled datasets included full infor- countries farther and farther away from Hong
mation regarding the source nation of all the im- Kong at an accelerating pace: initially in the 1970s
ports of live reef food fish into Hong Kong; those the trade expanded at a rate of about 100 km per
sources included 19 nations in Southeast Asia and year and by the late 1990s reached over 400 km per
the Pacific Islands. year (Fig. 1).
1968
1985 1997
1970
1980 1994
1992 1994
1993
1998
No existing institutions to address LRFT
Broad fisheries management regime or overfished reefs
LRFT legislated
Figure 1. The global spread of the LRFFT, showing start-up dates for the trade in several areas and contours
representing the area covered by the trade in 1970, 1985 and 1998. After Scales et al. (2007).38 SPC Live Reef Fish Information Bulletin #17 – November 2007
Boom-and-bust patterns and-bust trend if the boom-and-bust phases were
interrupted by no more than two deviations from
Boom-and-bust trends are often observed in marine the overall trend (i.e. there were small year-to-year
and freshwater fisheries and have been reported decreases or increases) (Fig. 2b). At the end of a
in the LRFFT (Barber and Pratt 1998; Cesar et al. boom-and-bust phase, according to our definition,
2000; Clark 2001; Bruckner et al. 2003). When a po- the volume of trade is low but not necessarily zero.
tentially lucrative fishery resource is discovered in Where there were gaps in the dataset for a particu-
a particular area, such as when stimulated by new lar source nation, we assumed that there was no de-
market demands or increases in price, fishing effort parture from the general trends.
increases rapidly. Growing catches encourage other
fishers to join the fishery, which expands rapidly Out of 19 source nations studied, 10 clearly showed a
(boom phase). In the absence of any management boom-and-bust pattern of development. Worryingly,
interventions, more and more fishers become in- the booms appeared to be increasingly ephemeral
volved in the fishery and soon fish populations are for countries farther from Hong Kong, with shorter
unable to replenish themselves rapidly enough to boom phases (time between the start-up of the trade
maintain catch rates; fish populations crash, catch- and the peak in trade volume). This was not ex-
es fall, profits fall and the fishery collapses (bust plained by the more distant countries having smaller
phase). We looked at LRFFT trade data to search for reefs and hence potentially smaller pre-LRFFT popu-
boom-and-bust trends and investigated the magni- lations of targeted species: the time between start-up
tude of the boom phases and the location and tim- to peak was found to be unrelated to reef area.
ing of boom-and-bust trends.
Fishing down the price list
We defined a boom-and-bust trend to be one in
which there were data showing at least five years of We also analysed the data by species instead of by
trade, during which there was an increase in annual source nation. Species-specific import figures from
export weight over at least three years (boom phase) 1997–2002 were summed from CSD and AFCD da-
followed by at least two years in which the annual tasets to provide total annual import figures for
weight declined each year (bust phase) (Fig. 2a). each species across all source nations combined.
If in a given case the data showed more than five These data revealed the serial depletion of species in
years of trade activity, it was still defined as a boom- trade in descending order of price (based on rank-
ing of prices paid to fishers in the main
(a) exporting countries in 2001; Sadovy et al.
2003) with more expensive species such
60 as humphead wrasse and giant grouper
Biomass exported (mt)
50 undergoing bust phases first, followed
40 by lower-priced species such as leopard
30
coralgrouper and spotted coralgrouper.
20
What happens next to the LRFFT
10 globally?
0
1 2 3 4 5 Taken together, these three main find-
Year ings from our global study — the increas-
ing pace of trade expansion, accelerating
(b)
boom-and-bust trends, and fishing down
60 the price list — pose a worrying scenario
Biomass exported (mt)
50 for nations located at the periphery of the
40 current trade. At particular risk are Pacific
30
nations with reef ecosystems that so far
remain comparatively healthy and sus-
20
tainably managed, since their relatively
10 large distance from Hong Kong may not
0 be enough to protect these nations from
1 2 3 4 5 6 7 8 9 10 being the focus of attention of the expand-
Year ing wave of the LRFFT. An issue raised by
Berkes et al. (2006) was the threat posed by
Figure 2. Illustration of minimum requirements for mobile fishing fleets that enter countries
a boom-and-bust trend (as defined in Scales et al. 2006 and rapidly deplete resources before re-
and here) with: a) five years of export data, and gional or national institutions can address
b) more than five years of export data.
issues of overexploitation. UnderstandingSPC Live Reef Fish Information Bulletin #17 – November 2007
39
the global dynamics of the LRFFT is crucial to help Sea and the southwest Philippines. Fish are caught
pre-empt its continued expansion and to encourage using either handlines from the surface or underwa-
countries to enter the trade under a controlled and ter using surface-fed hookah diving gear. None of the
precautionary basis. It is extremely encouraging that fishers or traders we visited in Sabah spoke of using
through the Secretariat of the Pacific Community’s cyanide, which is not unexpected given the illegal
(SPC) Pacific Regional Live Reef Fish Trade Initia- nature of this fishing technique; however, there was
tive, several countries have begun to approach the anecdotal evidence that cyanide is used (Barber and
LRFFT in a precautionary way, introducing small- Pratt 1997). Consignments of live fish from Kudat
scale trial fisheries and developing LRFFT manage- are transported by road to the state capital, Kota
ment plans (Yeeting 2006). There also remain some Kinabalu, bound either for consumption in local up-
worrying gaps within existing regional coordination market seafood restaurants or for export by air to
of fisheries management institutions for nations in Singapore and Hong Kong.
the Indo-Pacific region, including those bordering
the Red Sea, Persian Gulf and in the far eastern Pacif- Data collection in northern Borneo
ic (Fig. 1). Reefs in these nations could well become
attractive to the LRFFT in the near future; in our view During our research in the area, we discovered that
these countries’ fisheries would benefit greatly from some LRFF traders kept continuous records of the
following a management and conservation model daily fish catches bought from individual fishers
such as that developed by the SPC. and vessels, either in record books or as copies of
cash receipts given to fishers. These records includ-
Local impacts ed the date of sale, the name of each fisher or vessel
registration number, the local name for each species
Having looked at the wide scale, country-by-coun- bought, the total weight (kg) of each species (but
try trends in the LRFFT, we also investigated the not the number of individual fish), and the price per
local impacts of the LRFFT on populations of coral kg paid for each species. Several traders were will-
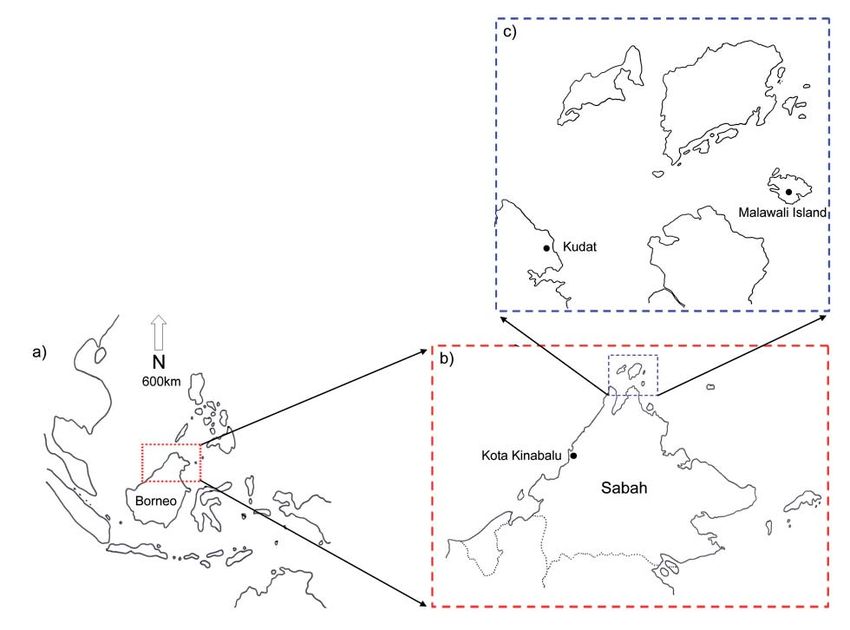
reef fish (Scales et al. 2007). The geographic focus for ing to let us study their receipts and record books
this study was the Malaysian state of Sabah on the on the understanding that we were conducting in-
northern tip of Borneo (Fig. 3). The LRFFT has op- dependent academic research. We were able to gain
erated in this region since the 1980s with a supply access to these scientifically valuable datasets only
chain structure broadly representative of other live because we worked closely and openly with local
reef fisheries in Southeast Asia (Bentley 1999). There fishers and traders.
are two main types of fishing operations around the
northwest coast of Sabah and offshore islands. First,
individual fishers operate from small wooden boats,
using hook and line to catch fish from reefs up to one
day’s journey from their home villages. Middlemen
based in the villages buy live fish at a considerable
premium (compared with prices for the same spe-
cies dead). Traders send consignments of live fish to
the town of Kudat on the mainland (Fig. 3). Second,
larger vessels owned by live fish traders also operate
out of Kudat, taking around 20 men to sea for up to
12 days at a time into the waters of the South China
Figure 3. Maps of a) Southeast Asia, b) Sabah and c) north coast of Sabah.40 SPC Live Reef Fish Information Bulletin #17 – November 2007
Daily fish catch data were collected in 2002, 2003 We tested whether differences in results across
and 2004 from two of the nine main traders in the datasets were likely due to their different lengths
mainland town of Kudat (these data represented by truncating the longest dataset so that it only
about 30% of the overall trade in Kudat during that spanned the years included in the medium or
period) and from the single trader based on the is- short datasets. Doing so removed all the signifi-
land of Malawali (Fig. 3). The dataset covering the cant patterns that were detected in the long da-
longest period was from one trader in Kudat: it in- taset, thus confirming that the lack of patterns in
cluded continuous catch data from January 1995 to the other time series was probably due to their
January 2003 (excluding January 1998 through July short coverage, which only provided informa-
1999, due to a missing record book). The second tion on the bust phase. We also lumped all the
Kudat trader provided data from November 1999 species together in each of the three datasets and
to June 2003. The Malawali trader provided catch looked for trends. For the long and medium da-
receipts from August 2001 to August 2003. tasets there was still a significant decline in total
monthly catch, but there were no significant de-
For each of the three datasets we calculated the dai- clines in CPUE.
ly total catch (kg) of each species. Catch-per-unit-
of effort (CPUE) was calculated by dividing these By gaining access to these highly detailed datasets,
daily totals by the number of fishers (in Malawali) we were able to demonstrate just how rapid and
or vessels (in Kudat) operating each day. Each fish- drastic catch declines of species in the LRFFT can
ing trip from Kudat represented a consistent unit of be. The declines were species-specific, took place
fishing effort since there was no significant change in less than a decade, and are especially worrying
over time in the length of trips made by vessels. given the mobile nature of the Kudat fishing fleet:
Trip length in Malawali was always one day. In or- it is likely that when the most accessible popula-
der to test for any significant changes in biomass of tions became depleted, the fishery ranged farther
targeted species in the wild over time, we summed and, thus, maintained catches and catch rates for a
the fish catch data into monthly figures, which al- longer period than they otherwise would have. In
lowed us to subsequently take seasonal effects into other words, the declines we observed at points of
account. We then used linear regression models on sale masked greater declines at points of capture.
the monthly data to analyse temporal changes in The masking of serial depletions by spatial shifts in
total catch and CPUE for each species for each of exploitation range is a major obstacle in assessing
the three traders. We assumed that CPUE is posi- the impacts on fish populations of mobile fishing
tively related to biomass in the wild and hence is fleets (Berkes et al. 2006).
a reasonable proxy for estimating relative abun-
dance of species. The declines in biomass of LRFFT species we have
inferred from declines in CPUE could have been
Local depletion of coral reef fish caused by overfishing or by habitat degradation.
However, it is unlikely that these declines were a
We found that the total monthly catches in the long- consequence of widespread declining reef health,
est dataset declined significantly for all species be- since the reefs around Borneo were relatively un-
tween 1995 and 2003 (Table 2). Despite a decline in affected by the 1998 global coral bleaching event
the number of vessels selling fish to this trader over (Wilkinson 2000). Also, as described above in our
the same time period (which may reflect a general study of global dynamics, the international trade
downturn in the fishery, a view that is backed up data showed that stocks of LRFFT species did not
by informal interviews with fishers and traders in simultaneously decline but were serially depleted
the region), CPUE also declined for three species – according to distance from Hong Kong and price.
humphead wrasse, Epinephelus spp. and humpback The species targeted by the LRFFT in northern
grouper. We interpret the declines in CPUE of these Borneo do not appear in local markets (A.M. and
species as quantitative evidence for population im- H.S., pers. observs.) and we therefore believe the
pacts of the LRFFT. LRFFT is the main source of fishing mortality for
these species.
Results from the shorter datasets were less clear-cut.
Total monthly catches in the medium dataset de- Given that the LRFFT is generally legal (which facil-
clined significantly for all species except spotted cor- itates data collection), and that the structure of the
algrouper. However, the number of vessels selling supply chain is similar throughout Southeast Asia
to this trader also declined — in this case to such an and beyond (e.g. traders outside Sabah, such as in
extent that it explained the declines in total catches, Indonesia, are also known to issue cash receipts;
since none of the species showed declines in CPUE. Bentley 1999), it is likely that other daily catch da-
Patterns in the short dataset were very unclear. The tasets could be collected from fishers and traders to
only significant temporal change was an increase in further investigate the impacts of the trade on local
the total monthly catch of humphead wrasse. fish stocks.SPC Live Reef Fish Information Bulletin #17 – November 2007
41
Table 2. Temporal changes in total monthly catch and CPUE for fish species bought by three LRFF traders
in northern Sabah (from Scales et al. 2007).
Total catch CPUE
Long Medium Short Long Medium Short
dataset dataset dataset dataset dataset dataset
(8 years) (3 years) (2 years) (8 years) (3 years) (2 years)
Humphead
wrasse
Leopard
coralgrouper
Epinephelus spp.
Spotted
coralgrouper*
Blacksaddled
No data No data No data No data
coralgrouper**
Squaretail
No data No data No data No data
coralgrouper†
Highfin
No data No data
coralgrouper††
Red arrow = significant decline (p < 0.05), green arrow = significant increase, white horizontal arrow = non-significant (p > 0.05).
*Plectropomus maculatus, **Plectropomus laevis, †Plectropomus areolatus, ††Plectropomus oligacanthus
Recommendations for monitoring the LRFFT scale, even though the Hong Kong trade data were
in some senses highly aggregated into annual trade
Despite focusing on two contrasting geographic volume from each country, they still provided de-
scales of the LRFFT, the datasets used in these two tails of fish species and country of origin and thus
studies share some features that lead to important remained useful in gaining a widespread picture of
recommendations for future data collection that the dynamics of the trade.
can be used for impact assessment throughout
the LRFFT: 3. An estimate of harvesting effort (e.g. in terms of
fishing trips, as in this northern Borneo study)
1. Catch or trade datasets need to cover as long a can be crucial for interpreting catch data (i.e. es-
time period as possible. timating CPUE) and determining local impacts
(i.e. using CPUE as an indicator for in-water
This is necessary to increase the likelihood of detect-
stock biomass), but the lack of such information
ing changes in catches and CPUE as well as boom-
does not preclude the use of catch data for deter-
and-bust patterns of fishery development. Trun-
mining broad trends, especially when it is pos-
cating our longest dataset in the northern Borneo
sible to compare local datasets across regions, as
study removed all the significant patterns that were
in our global study.
apparent in the original, eight-year, time series.
Again, our ability to estimate levels of fishing effort
2. Catch or trade datasets need to be as disaggre-
in the northern Borneo fishery was due to the fact
gated as possible, both spatially and by species.
that we collected daily fish catch data, from which
The disaggregated nature of the northern Borneo da- we were able to determine the number of fishing
tasets was due to our having collected information trips undertaken to catch a given biomass of fish
directly from traders and not from further along the and hence make reasonable estimates of effort.
supply chain, such as consignments leaving from
Kudat by road or from Kota Kinabalu by air. If we 4. It is possible that there were other factors that
had done that, the data would not have been bro- could have influenced the trends in live food
ken up into individual days, with information on fish exports that were not apparent in the rel-
particular fishing vessels and fishermen, meaning atively crude import data used in the global
that effort and therefore CPUE would have been study. However, the regional perspective these
difficult or impossible to calculate. At a broader data provided was important for putting local42 SPC Live Reef Fish Information Bulletin #17 – November 2007
changes into a wider context. Therefore, data Cesar H.S.J., Warren K.A., Sadovy Y., Lau P., Mei-
collected for purposes other than fisheries man- jer S. and van Ierland E. 2000. Marine market
agement, such as customs data, can be useful. transformation of the live reef fish food trade
in Southeast Asia. p. 137–157. In: Cesar H.S.J.
5. Similar datasets to those compiled in these stud- (ed). Collected essays on the economics of coral
ies should be collected where possible to help reefs. Sweden: CORDIO, Kalmar University.
further understand the temporal and spatial dy- Chu C., Kirkpatrick C., Kwan B. and Sadovy Y. 2006.
namics of the LRFFT. Final Report: Western Pacific Workshop on Pol-
icy, Enforcement and Sustainable Trade for the
For example, other points of importation may hold CITES Appendix II-listed Humphead (Napole-
trade data that could be analysed in the same way on) Wrasse Cheilinus undulatus, 5–7 June 2006,
as the Hong Kong data were here. It would be use- Hong Kong. WWF Hong Kong, Agriculture,
ful to update estimates of the respective shares of Fisheries and Conservation Department Hong
the global live reef fish market that each main im- Kong SAR, IUCN and TRAFFIC. 48 p.
porting nation/city accounts for. Clark M.R. 2001. Are deepwater fisheries sustain-
able? The example of orange roughy (Ho-
To effectively regulate the trade in threatened spe- plostethus atlanticus) in New Zealand. Fisheries
cies it is important to be able to determine whether Research 51:123–135.
or not the trade is having a detrimental impact on Clarke S. 2004. Understanding pressure on fishery
wild populations. For example, trade in CITES Ap- resources through trade statistics: A pilot study
pendix II-listed humphead wrasse should now only of four products in the Chinese dried seafood
take place from exporting nations that have dem- market. Fish and Fisheries 5:53–74.
onstrated (through non-detriment findings) that the Hamilton R.J. and Matawai M. 2006. Live reef food
LRFFT is not impacting wild populations (Chu et fish trade causes rapid declines in abundance
al. 2006). Assessing the status of naturally rare and of squaretail coralgrouper (Plectropomus areola-
widely dispersed species — for CITES non-detri- tus) at a spawning aggregation site in Manus,
ment findings or any other management or con- Papua New Guinea. SPC Live Reef Fish Infor-
servation programmes — is extremely challenging. mation Bulletin 16:13–18.
Species-specific catch data, such as those collected Johannes R.E. and Riepen M. 1995. Environmental,
in northern Borneo, are very useful in investigating economic, and social implications of the live
local impacts of the LRFFT. It is possible that other fish trade in Asia and the West Pacific. Hono-
coral reef fish species could, in the future, be listed lulu: The Nature Conservancy.
in CITES appendices or protected under national Lau P.P.F. and Parry-Jones R. 1999. The Hong Kong
legislation, which would bring about the need for trade in live reef fish for food. Hong Kong:
similar levels of monitoring. TRAFFIC East Asia and WWF Hong Kong.
McGilvray F. and Chan T.T.C. 2002. The trade in live
References reef food fish: A Hong Kong perspective. Aqua-
culture Asia 7:21–26.
Barber C.V. and Pratt V.R.1997. Sullied seas: Strate- Muldoon G., Peterson L. and Johnston B. 2005. Eco-
gies for combating cyanide fishing in Southeast nomic and market analysis of the live reef food
Asia and beyond. Washington, DC: World Re- fish trade in the Asia-Pacific region. SPC Live
sources Institute and International Marine Life Reef Fish Information Bulletin 13:35–41.
Alliance. Sadovy Y.J., Donaldson T.J., Graham T.R., McGilvray
Barber C.V. and Pratt V.R. 1998. Poison and profits. F., Muldoon G.J., Phillips M.J., Rimmer M.A.,
Environment 40:4–16. Smith A. and Yeeting B. 2003. While stocks last:
Bentley N. (ed). 1999. Fishing for solutions: Can the The live food reef fish trade. Manila: Asian De-
live trade in wild groupers and wrasses from velopment Bank.
Southeast Asia be managed? Kuala Lumpur: Scales H., Balmford A., Liu M., Sadovy Y. and Mani-
TRAFFIC Southeast Asia. ca A. 2006. Keeping bandits at bay? Science
Berkes F., Hughes T.P., Steneck R.S., Wilson J.A., 313:612–613.
Bellwood D.R., Crona B., Folke C., Gunderson Scales H., Balmford A. and Manica A. 2007. Impacts
L.H., Leslie H.M., Norberg J., Nystrom M., Ols- of the live reef fish trade on populations of cor-
son P., Osterblom H., Sheffer M. and Worm B. al reef fish off Northern Borneo. Proceedings of
2006. Globalization, roving bandits, and marine the Royal Society B 274:989–994.
resources. Science 311:1557–1558. Wilkinson C. (ed). 2000. Status of the coral reefs of
Bruckner A.W., Johnson K.A. and Field J.D. 2003. the world: 2000. Townsville, Australia: Austral-
Conservation strategies for sea cucumbers: Can ian Institute of Marine Science.
a CITES Appendix II listing promote sustain- Yeeting B. 2006. The Live Reef Fish Trade in the Pa-
able international trade? SPC Beche-de-mer In- cific: A look at recent trends and developments.
formation Bulletin 18:24–34. SPC Fisheries Newsletter 119:56–64.You can also read