Potential Dependent Structure and Stability of Cu(111) in Neutral Phosphate Electrolyte - MDPI
←
→
Page content transcription
If your browser does not render page correctly, please read the page content below
Article
Potential Dependent Structure and Stability of
Cu(111) in Neutral Phosphate Electrolyte
Yvonne Grunder 1 , Jack Beane 1 , Adam Kolodziej 2 , Christopher A. Lucas 1 and
Paramaconi Rodriguez 2, *
 1   Department of Physics, University of Liverpool, Liverpool L69 7ZE, UK;
     Yvonne.Grunder@liverpool.ac.uk (Y.G.); sgjbeane@student.liverpool.ac.uk (J.B.);
     clucas@liverpool.ac.uk (C.A.L.)
 2   School of Chemistry, University of Birmingham. Birmingham B15 2TT, UK; AXK595@student.bham.ac.uk
 *   Correspondence: p.b.rodriguez@bham.ac.uk

 Received: 30 January 2019; Accepted: 20 February 2019; Published: 24 February 2019

 Abstract: Copper and copper oxide electrode surfaces are suitable for the electrochemical reduction
 of CO2 and produce a range of products, with the product selectivity being strongly influenced by the
 surface structure of the copper electrode. In this paper, we present in-situ surface X-ray diffraction
 studies on Cu(111) electrodes in neutral phosphate buffered electrolyte solution. The underlying
 mechanism of the phosphate adsorption and deprotonation of the (di)-hydrogen phosphate is
 accompanied by a roughening of the copper surface. A change in morphology of the copper surface
 induced by a roughening process caused by the formation of a mixed copper–oxygen layer could
 also be observed. The stability of the Cu(111) surface and the change of morphology upon potential
 cycling strongly depends on the preparation method and history of the electrode. The presence
 of copper islands on the surface of the Cu(111) electrode leads to irreversible changes in surface
 morphology via a 3D Cu growth mechanism.

 Keywords: Cu(111); electrochemical interface; in-situ X-ray diffraction

1. Introduction
      Compared to many metal catalysts, copper surfaces have been proven to electrochemically convert
CO2 to high value and energy-dense products, such as methane ethylene, formic acid, methanol and
ethanol amongst others. However, the efficiency and the selectivity are far from optimal and the
parameters controlling these factors are not-fully understood. Differences in reactivity and selectivity
have been variously ascribed to surface area, particle size, surface structure and roughness and the
electrolyte composition [1–6]. More recently, the effect of the role of the oxygen content of the copper
catalyst and the oxidation state of the copper on the electrocatalytic activity and selectivity have
illustrated the high complexity of the system. Oxide-derived Cu catalysts have shown high-selectivity
towards the formation of C2 products [7–10]. Such selectivity has been attributed to changes in
the surface structure, including roughness and defects, with active sites being generated during the
reduction pretreatment of the Cu-oxide catalyst. However, more recently, in addition to the structural
factors, the presence of Cu+ and residual subsurface oxygen has been suggested to affect the product
selectivity [5,11,12]. Mistry et al. demonstrated, via operando XAFS, the presence of Cu+ species and
subsurface oxygen during the carbon dioxide reduction reaction [5]. In another report, LeDuff et al. [7]
implemented a pulse sequence between reduction potentials where the carbon dioxide reduction
reaction (CO2RR) takes place (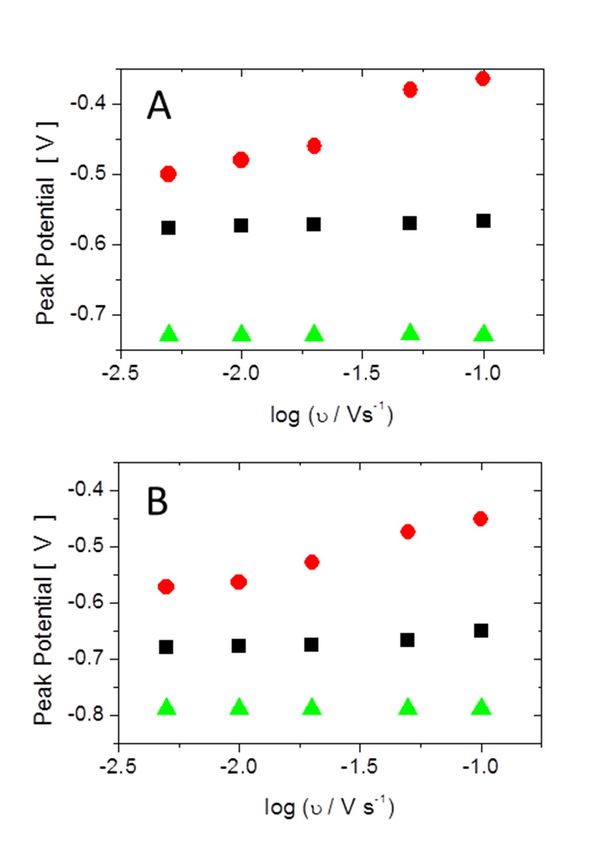
Surfaces 2019, 2 146
single-crystal electrodes towards the CO2RR. This was associated to the adsorbed species, presumably
OH or anions, at the surface of the Cu single crystal electrodes which prevent any irreversible damage
or changes to the Cu surface structure [7].
In this paper, we present the in-situ characterization by surface X-ray diffraction of the Cu(111)
electrode at positive potentials with the aim to determine the composition and structure of the
electrochemical interface. The key to understanding the stability and reactivity of the Cu(111)
electrode is to control the surface morphology during the preparation of the clean surface. Depending
on the details of surface preparation, two different Cu(111) surfaces can be obtained; although
macroscopically rather rough, one surface is completely stable during potential cycling that involves
considerable modification of the surface structure. The other surface gives rise to X-ray scattering
features consistent with the presence of twinned Cu nano-islands and, although this surface exhibits
a similar potential-dependent restructuring, it is not stable during potential cycling. The direct
correlation of structural stability, only available via in-situ structural characterization, and reactivity is
vital to understanding structure–reactivity relationships, especially in studies of more active metal
electrodes [14,15].
2. Materials and Methods
The Cu(111) single crystal working electrode (MaTeck, miscut < 0.1◦ ) was prepared by
electropolishing for 10 s in 70 % orthophosphoric acid at 2 V against a high-surface area copper
mesh. The crystal was then rinsed in ultra-pure water, covered with the electrolyte solution and
transferred to the electrochemical cell. A copper wire was used as counter electrode and an Ag/AgCl
electrode was used for the reference electrode. All potentials are quoted against this reference electrode.
The experimental procedure for the surface X-ray diffraction experiments followed that of similar
studies reported previously [16,17]. Surface X-ray diffraction measurements were carried out on the
I07 beamline at Diamond Light Source (Harwell Science and Innovation Campus, Fermi Ave, Didcot
OX11 0DE, Oxford, UK) [18], with a monochromatic beam of 25 keV X-rays. Beam defining slits were
0.5 mm × 0.5 mm and the beam size at the sample was estimated to be 200 µm × 300 µm (vertical ×
horizontal). The sample was mounted on a (2 + 3) circle diffractometer [19]. A 2D Pilatus Dectris 1
M detector (DECTRIS Ltd., Baden-Daettwil, Switzerland) was used for the data acquisition. For the
measurement of crystal truncation rods, scans along the Qz (surface normal) direction at specific points
in reciprocal space were recorded. Background correction and standard instrumental corrections were
applied to the dataset to be able to model the intensity distribution [20,21]. Errors on the individual
data points were a combination of the statistical error and an estimated 10% systematic error. The
model of X-ray diffraction was obtained using a Python (Python Software Foundation, Beaverton, OR,
USA) program and the integrated lmfit leastsquare fitting routine, which returned the best values
for the relaxation, coverage and β-factor. The Cu(111) surface has a close packed structure with a
hexagonal unit cell, where the surface normal is along the (0, 0, L)hex direction and the surface plane
contains the ( H, 0, 0)hex and (0, K, 0)hex
√ vectors, which are separated
√ by 60◦ . The Miller indices H, K,
∗ ∗ ∗
and L have units of a = b = 4π/ 3a NN and c = 2π/ 6a NN , where the nearest neighbour for
copper is a NN = 2.556 Å.
3. Results
The Cu(111) surfaces were characterised in a phosphate buffered electrolyte by surface X-ray
diffraction and with electrochemical methods.
3.1. Electrochemical Characterization
The Cu(111) electrode was characterised in phosphate buffer solution of concentration equal
to 0.01 M, 0.05 M and 0.1 M at different pH values of 6 and 8 with cyclic voltammetry at different
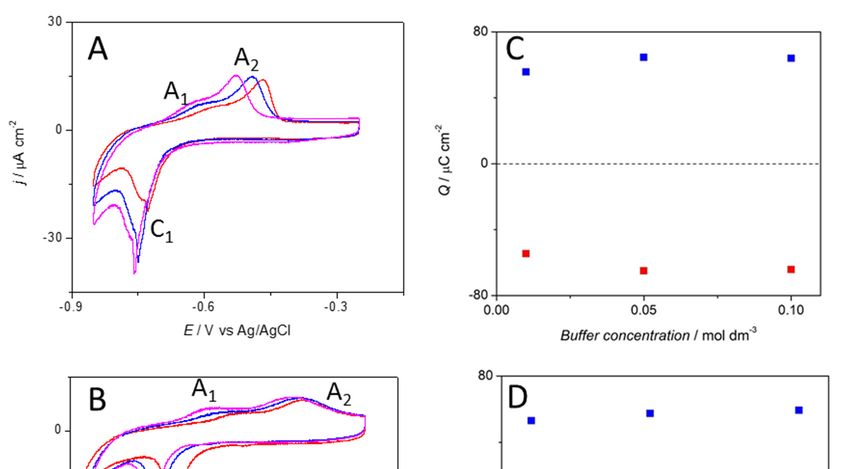
scan rates (Figure 1A). In the anodic scan, a shoulder (A1) at approximately −0.65 V and a peak (A2)
approximately −0.5 V can be observed at both pHs; however, at lower pH, the second anodic peak is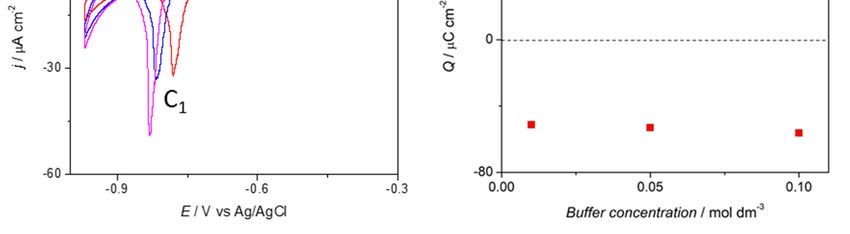
Surfaces 2019, 2 147
more defined. At pH = 6, the anodic peak shifts towards higher potentials with decreasing phosphate
Surfaces 2018, 1, x FOR PEER REVIEW 3 of 16
concentration (Figure 1B). The total charge associated to the electrochemical process shows equal
charge 2 , which corresponds to ~0.2 electrons per
showsin bothcharge
equal the anodic andthe
in both cathodic
anodicscan
and of 52–60 µC/cm
cathodic scan of 52–60 µC/cm2, which corresponds to ~0.2
surface atom. The charge values were found to be independent
electrons per surface atom. The charge values were found to be of the pHindependent
and phosphateofconcentration
the pH and
(Figure 1C,D).
phosphate concentration (Figure 1C,D).
Figure 1. Cyclic voltammetry profiles of a Cu(111) electrode in a phosphate buffer solution at (A) pH = 6
Figure
and (B) 1.
pHCyclic voltammetry
= 8 with phosphateprofiles of a Cu(111)
concentration equalelectrode
to 0.01 Min(red
a phosphate
line), 0.05buffer solution
M (blue at (A)
line) and 0.1 pH
M
= 6 and (B) pH = 8 with phosphate concentration
− 1 equal to 0.01 M (red line), 0.05 M (blue
(magenta line). Scan rate ϑ= 0.02 V s . (C,D) Charge involved in the oxidative () and reductive ( line) and 0.1
)
M (magenta line) . Scan rate ϑ= 0.02 V s −1. (C, D) Charge involved in the oxidative (■) and reductive
process at the Cu(111) electrode as a function of the phosphate buffer concentration for pH = 6 and
(■) =process
pH at the Cu(111) electrode as a function of the phosphate buffer concentration for pH = 6
8 respectively.
and pH = 8 respectively.
3.2. Structural Characterization
3.2. Structural Characterization
The Cu(111) surface was investigated in phosphate buffer solution of concentration 0.1 M at pH = 8
The Cu(111)
with in-situ surfacesurface
X-raywas investigated
diffraction. in phosphate
Throughout buffer solution
the experiment, we of concentration
noted 0.1 Minatthe
the difference pH
= 8 with in-situ surface
quality/morphology X-ray
of the diffraction.
starting surface,Throughout
which resultedthe experiment,
specifically we in anoted the difference
difference in the
in reversibility
quality/morphology
of adsorption processes of the
andstarting surface,
stability. which resulted
The differences specifically
in surface morphologyin a difference in reversibility
are described in more
of adsorption
detail processes
below. Prior to anyand stability.
prolonged The differences
potential in surfaceinmorphology
cycling resulting excessive time arespent
described in more
at potentials
detail phosphate
where below. Prior to any prolonged
is adsorbed, potential
all surfaces cycling
exhibited resulting
a rather similarinchange
excessive time spent
in structure at potentials
as the potential
where
was phosphate
cycled. Figure 2isshows
adsorbed, all surfaces
the X-ray exhibited
intensities measured a rather similar change
at the reciprocal space in structure
positions as 1.4)
(0, 0, the
potential
and was cycled.
(0, 1, 0.5), shown as Figure 2 shows
dotted the X-ray
and solid lines, intensities
respectively, measured
and areat the reciprocalofspace
representative positions
the potential
(0, 0, 1.4) and
dependent (0, 1, 0.5),
behaviour. Theshown as dotted(0,
non-specular and solid
1, 0.5) lines, respectively,
position is sensitive to andanyare representative
changes of the
in the atomic
potentialof
structure dependent
the Cu(111) behaviour.
surface or Theto non-specular
the adsorption (0,of1,species
0.5) position is sensitive to
into well-defined Cuany changes in
adsorption the
sites,
atomic structure
whereas the specularof the
(0, 0,Cu(111) surface
1.4) position or to thetoadsorption
is sensitive any changes of inspecies into well-defined
the surface normal electron Cu
adsorption
density sites, whereas
distribution the the
including specular (0, 0, side
electrolyte 1.4) of
position is sensitive
the interface. to any indicate
The results changes that
in the surface
there is a
normal electron density distribution including the electrolyte side of the interface. The results
indicate that there is a clear structural change at the interface, most likely involving restructuring of
the Cu surface itself and this exhibits considerable hysteresis consistent with significant
rearrangement of surface atoms.Surfaces 2019, 2 148
clear structural change at the interface, most likely involving restructuring of the Cu surface itself and
this exhibits considerable hysteresis consistent with significant rearrangement of surface atoms.
Surfaces 2018, 1, x FOR PEER REVIEW 4 of 16
Following the X-ray voltammetry (XRV) measurements, such as those shown in Figure 2, the
Cu(111) surface
Followingstructures
the X-raywere characterised
voltammetry (XRV) while changing the
measurements, suchpotential
as those in stepsinofFigure
shown 0.1 V2,over
the the
Cu(111)
range from −1.0surface
V to structures
−0.5 V. For wereeachcharacterised
potential, awhile changing
rocking the potential
scan was measured in steps
at theof(0,0.11,V0.5)
overposition
the
range from −1.0 V to −0.5 V. For each potential, a rocking scan was measured
and the integrated intensity obtained from this measurement is also shown in Figure 2 as black squares. at the (0, 1, 0.5) position
andseen
It can be the that
integrated
these lieintensity
halfway obtained
in the from this measurement
hysteresis loop. The surfaceis also was
shown in Figure 2 by
characterised as black
detailed
squares. It can be seen that these lie halfway in the hysteresis loop. The surface was characterised by
crystal truncation rod (CTR) measurements at potentials in the order −1.0 V, −0.9 V, −0.8 V, −0.7 V,
detailed crystal truncation rod (CTR) measurements at potentials in the order −1.0 V, −0.9 V, −0.8 V,
−0.6 and −0.5 V, after which the potential was stepped back to −0.8 V to check the reproducibility and
−0.7 V, −0.6 and −0.5 V, after which the potential was stepped back to −0.8 V to check the
stability of the surface
reproducibility andstructure.
stability ofThe exact potential
the surface structure.history
The exactofpotential
the experiment
history ofisthe
shown in Figure
experiment is 3
together withinthe
shown integrated
Figure intensity
3 together with theand the peak
integrated widthand
intensity at the
the(0, 1, 0.5)
peak widthposition.
at the (0,It1,can
0.5) be seen that
position.
the peak width
It can be did
seennot thatchange
the peakthroughout
width didthe notcourse
change of throughout
the experiment, indicating
the course of thea experiment,
stable surface,
i.e., there was noachange
indicating in surface
stable surface, morphology
i.e. there or domain
was no change size morphology
in surface (which is inversely
or domain proportional
size (which tois the
inversely proportional to the width of the peak in the rocking scan).
width of the peak in the rocking scan). The integrated intensity changed with the applied potential The integrated intensity
changed
as expected withthe
from theresults
appliedshown
potentialin as expected
Figure fromchange
2. This the results
wasshown in Figure
reversible, 2. This change
as indicated wastwo
by the
reversible, as indicated by the two datasets recorded at −0.8 V, before
datasets recorded at −0.8 V, before and after the potential cycle, which gave the same structural and after the potential cycle,
which gave the same structural parameters within the experimental error.
parameters within the experimental error.
1.25
Intensity / (arb. units)
1.20
1.15
1.10
1.05
1.00
-1.0 -0.8 -0.6 -0.4
potential / V
Figure 2. The potential dependence of the X-ray intensities measured at the non-specular, (0, 1, 0.5),
Figure
(solid line) and2. specular,
The potential
(0, 0,dependence of the positions
1.4), anti-Bragg X-ray intensities
(sweepmeasured at the non-specular,
rate = 2 mV/s). In addition, (0,
the1,intensity
0.5),
obtained from measuring the integrated intensity at selected potentials under static conditions the
(solid line) and specular, (0, 0, 1.4), anti-Bragg positions (sweep rate = 2 mV/s). In addition, is also
intensity obtained from measuring the integrated intensity at selected potentials under static
shown (black squares).
conditions is also shown (black squares).
The CTR data and the best fit to the data obtained through a least-square fitting procedure for
potentials of −0.5 V and −0.8 V are shown in Figure 4. The structural model used to fit the data
allowed variation in the coverage of the topmost copper layer, the relaxation of the two topmost copper
layers and also included a β-roughness factor which is typically used to model surface roughness in
CTR measurements [22]. For the data measured at positive potentials it was also necessary to include
an adsorbed oxygen layer with the oxygen atoms occupying fcc/hcp three-fold hollow Cu sites. The
oxygen coverage and distance to the topmost Cu layer was allowed to vary to obtain the best fit. The
obtained parameters for the best fits to the data at the different potentials are summarised in Figure 5.
At potentials positive of −0.7 V, the coverage of the topmost copper layer started decreasing andSurfaces 2019, 2 149
the oxygen coverage increased, together with an increased surface roughness. The inclusion of the
oxygen layer in the structural model resulted in a decrease of the reduced χ2 (indicating the goodness
of fit in the least squares method) from 3.3 to 1.8 for the fit to the data recorded at −0.5 V. In-plane
scans were measured at all potentials at L = 0.4 along the high symmetry , and
directions but did not show any additional superstructure peaks. Thus, we conclude that
there is no specific ordering of the phosphate or any oxygenated species into a commensurate ordered
adsorbate or copper oxide layer, as such ordering would give rise to additional scattering features
that would be detected in the scans along the high symmetry directions. Previous works, in gas phase
and computational studies, suggest the formation of hexagonal or quasi-hexagonal structures on the
Cu(111) surface upon oxygen adsorption, structures which can be viewed as the initial layer of a
Cu2 O (111) film. The model proposed by Platzman et al. suggests a three-step oxidation mechanism
comprising the formation of a Cu2 O layer, followed by the formation of a metastable overlayer of
Cu(OH) 2 and2018,
Surfaces finally the transformation
1, x FOR PEER REVIEW of this metastable overlayer phase into CuO layer [23]. Our 5 of 16
results in electrochemical environment do not show any of these ordered structures in the potential
range under study.
0.7 -0.4
(a) 9 (c) #158
0.6
#383
potential [V]
0.5 -0.6
FWHM [°]
8
0.4
-0.8 7
0.3
0.2
6
-1.0
0.1
8
5
(b)
Intensity / (arb. units)
Intensity [arb. units]
6 4
4 3
2 2
1
0
100 300 500 -0.5 0.0 0.5
scannumber omega / °
Figure 3. The surface stability has been monitored throughout the course of the experiment. (a) The
full width half 3.
Figure maximum
The surface (FWHM) and
stability integrated
has intensity
been monitored obtained from
throughout rocking
the course ofscans at the (0, 1, (a) The
the experiment.
0.5) position are shown as function of the scan number during the experiment.
full width half maximum (FWHM) and integrated intensity obtained from rocking scans The potential is also
at the (0, 1,
shown in red. The peak width is stable, indicating a stable surface with a domain
0.5) position are shown as function of the scan number during the experiment. The potentialsize of ~100 nm. is also
(b) The shown
integrated intensity
in red. The peakis changing
width is reversibly with thea applied
stable, indicating potential.
stable surface with(c) The peaksize
a domain profiles of nm. (b)
of ~100
the rocking
The scan and the
integrated fit of the
intensity is peak with reversibly
changing a Lorentzian line
with theshape are potential.
applied shown for(c)scan
Thenumbers 158 of the
peak profiles
and 383rocking
at a potential of − 0.9 V and − 0.6 V, respectively.
scan and the fit of the peak with a Lorentzian line shape are shown for scan numbers 158 and
383 at a potential of −0.9 V and −0.6 V, respectively.
The CTR data and the best fit to the data obtained through a least-square fitting procedure for
potentials of −0.5 V and −0.8 V are shown in Figure 4. The structural model used to fit the data
allowed variation in the coverage of the topmost copper layer, the relaxation of the two topmost
copper layers and also included a β-roughness factor which is typically used to model surface
roughness in CTR measurements [22]. For the data measured at positive potentials it was also
necessary to include an adsorbed oxygen layer with the oxygen atoms occupying fcc/hcp three-fold
hollow Cu sites. The oxygen coverage and distance to the topmost Cu layer was allowed to vary to
obtain the best fit. The obtained parameters for the best fits to the data at the different potentials are
summarised in Figure 5. At potentials positive of −0.7 V, the coverage of the topmost copper layer
started decreasing and the oxygen coverage increased, together with an increased surface
roughness. The inclusion of the oxygen layer in the structural model resulted in a decrease of theSurfaces 2018, 1, x FOR PEER REVIEW 6 of 16
the formation of a metastable overlayer of Cu(OH)2 and finally the transformation of this metastable
overlayer phase into CuO layer [23]. Our results in electrochemical environment do not show any of
these ordered structures in the potential range under study.
Surfaces 2019, 2 150
-500 mV:
(01) model
103 data
Intensity/arb. units
-800 mV
model
102 data
101
100
(10)
3
10
Intensity/arb. units
102
101
100
(11)
Intensity/arb. units
103
102
101
100
1 2 3 4 5 6
L/c*
Figure 4. CTR data measured at −0.8 V (blue symbols) and −0.5 V (black symbols) together with
the calculated fits to the data (solid lines) according to the structural model described in the text. At
−0.5 V, an overall decrease in intensity at the surface sensitive positions can be observed. This has been
Figure 4.with
modelled CTRandata measured
increased at −0.8 V
roughness (blue
and symbols)ofand
adsorption −0.5 V (black
an oxygenated symbols)
species intotogether with
the surface Cuthe
calculated fits to the data (solid lines) according to the structural model
layer. The change in intensity induced by the potential is fully reversible. described in the text. At −0.5
V ,an overall decrease in intensity at the surface sensitive positions can be observed. This has been
Asmodelled
noted above,
with anthe morphology
increased roughnessof the
and surface depends
adsorption crucially on
of an oxygenated the into
species surface preparation
the surface Cu
and transfer intochange
layer. The the electrochemical system.
in intensity induced by theFor the above
potential is fullycase following the electropolishing of
reversible.
the Cu crystal, the transfer process to the X-ray electrochemical cell was smooth and the working
electrode was contacted and held at −0.8 V as soon as the crystal was in the cell. Any exposure to
oxygen during the preparation or not applying a potential in the oxygen reduction region immediately
upon immersion into the cell resulted in a different surface morphology than for the surface described
above. Previous work in gas phase has shown that at room temperature the oxidation of Cu(111)
proceeds through the epitaxial growth of copper oxide islands [24,25]. It has been shown that, in
gas phase, the growth of oxides on Cu(111) depends on the oxygen pressure and temperature and it
can follows three possible processes: (i) growth from step edges; (ii) interrace growth from vacancy
islands; and (iii) growth of on-terrace oxide [24,25]. The CTRs in this case showed additional peaks at
(0, 1, 1), (0, 1, 4), (1, 0, 2) and (1, 0, 5) (Figure 6), which arose from stacking faults (twinning) induced
by the nucleation of copper atoms into hcp sites. The CTR data in Figure 6 were best modelled by
including additional Lorentzian peaks to represent the twinned Cu, rather than a smooth surface
with stacking faults, and indicate that the peaks arose due to nano-crystalline copper islands on the
surface. Due to the presence of the additional peaks resulting from the nano-crystalline copper at the
surface, the CTRs could be reproduced reliably with a very simple model including surface roughness
and Cu surface relaxation only, i.e., for this more complex surface, the fitting was not sensitive to the
inclusion of an oxygen layer. The surface roughness and relaxation rely on the overall intensity changeSurfaces 2019, 2 151
across the whole range of L and the intensity distribution close to the Bragg peaks, respectively. We
were not able to reliably include any coverage of individual atomic layers or oxygen atoms, which
changed the intensity close to the anti-Bragg position as the intensity was dominated by the Lorentzian
peaks arising from the nano-crystalline copper. Although these parameters, which are summarized
in Figure 7, are only indicative, a similar trend in the potential dependent relaxation and roughness
was observed when stepping the potential slowly positively. Surprisingly, at −0.8 V, modelling of the
CTR data indicated a much lower surface roughness parameter, β, than the data shown in Figure 4.
We attribute this to the presence of the nano-clustered copper islands acting as nucleation sites for
copper ad-atoms, thus decreasing the overall surface roughness. The changes observed during the
potential steps were, however, not reversible. Upon stepping back to the negative potential, an increase
in the surface roughness, as indicated by the red symbols in Figure 7, could be observed. This increase
in surface roughness was accompanied by a decrease in surface domain size and an increase in the
size of the nano-crystalline copper domains present on the surface. This was shown by the rocking
scan measurements at the (0, 1, 0.5) position (Figure 8), which, as for the data shown in Figure 3,
also indicated the potential history of this sample. A gradual increase in the width of the rocking
scan, from 0.2◦ to 0.4◦ , was observed, corresponding to a domain size decreasing from ~100 nm to
~50 nm. Correspondingly, the height D of the nano-clusters could be estimated from the width of the
Surfaces 2018, 1, x FOR PEER REVIEW 7 of 16
peaks observed in the CTR data in Figure 6, D = 2 Π/∆Qz , and was found to grow in the course of the
experiment from 20 to 40 nm. Thus, it can be concluded that this Cu surface—with Cu islands present
on the surface—was unstable during potential cycling.
coverage / ML
1.00
0.75
0.50
0.25 Cu
O
0.00 (a)
relaxation / c
0.01
0.00 2nd layer
1st layer (b)
0.50
beta
0.48
0.46
(c)
0.2
O relaxation / c
0.1
0.0
(d)
-1.0 -0.9 -0.8 -0.7 -0.6 -0.5
potential/ V
Figure 5. The structural parameters obtained from modelling the CTR data are plotted as a function of
potential: (a) the coverage of the surface Cu layer and the adsorbed oxygen layer; (b) the relaxation of
the top two copper layers; (c) the roughness as modelled through a β-roughness model; and (d) the
Cu-O layer Figure
separation.
5. The structural parameters obtained from modelling the CTR data are plotted as a function
of potential: (a) the coverage of the surface Cu layer and the adsorbed oxygen layer; (b) the relaxation
of the top two copper layers; (c) the roughness as modelled through a β-roughness model; and (d) the
Cu-O layer separation.
As noted above, the morphology of the surface depends crucially on the surface preparation
and transfer into the electrochemical system. For the above case following the electropolishing of theSurfaces 2018, 1, x FOR PEER REVIEW 9 of 16
Surfaces 2019, 2 152
(01)
-800 mV:
model
Intensity /arb. units
data
103 -500 mV:
model
data
102
non-twinned
(model and data
101 at -800 mV)
(1 0) 1 2 3 4 5
Intensity /arb. units
103
102
101
1 2 3 4 5
L /c*
Figure 6. CTR data measured from a different Cu surface preparation at −0.8 V (blue symbols) and
Surfaces 2018, 1, x FOR PEER REVIEW 10 of 16
−0.5 V (black symbols) together with the calculated fits to the data (solid lines) according to the
structural model described in the text. In comparison to the CTR data presented in Figure 4, additional
peaks arising from Cu nano-islands can be observed.
0.5
0.4 2nd
beta
Figure 6. CTR data measured from a different Cu surface preparation at −0.8 V (blue symbols) and
−0.5 V (black symbols) together with the calculated fits to the data (solid lines) according to the
2nd
structural model described in the text. In comparison to the CTR data presented in Figure 4,
0.3
additional peaks arising from Cu nano-islands can be observed.
0.2 (a)
0.004 2nd layer
1st layer
relaxation /c
0.003
0.002
0.001
0.000
-0.001
(b)
-0.8 -0.7 -0.6 -0.5
potential / V
Figure 7. The structural parameters obtained from modelling the CTR data in Figure 6 are plotted as
a function of potential: (a) the β-roughness factor; and (b) the relaxation of the two topmost atomic
Figure 7. The structural parameters obtained from modelling the CTR data in Figure 6 are plotted as
Cu layers. The data obtained after having stepped the potential to the positive limit are shown in red
a function of potential: (a) the β-roughness factor; and (b) the relaxation of the two topmost atomic
symbols. Although theThe
Cu layers. potential-induced
data obtained afterchange
havinginstepped
structure is similar,
the potential tothe
the roughness ofare
positive limit theshown
surface
in red
has increased.symbols. Although the potential-induced change in structure is similar, the roughness of the surface
has increased.Surfaces 2018, 1, x FOR PEER REVIEW 11 of 16
Surfaces 2019, 2 153
-0.5
0.4
potential / V
FWHM / °
-0.6
-0.7
0.2
-0.8
0.8
Intensity /(arb. units)
0.6
0.4
0.2
0.0
0 100 200 300
scannumber
Figure 8. The surface stability of the Cu sample, which showed additional peaks arising from the
presence of Cu nano-crystals, i.e., equivalent to the data shown in Figure 3: (a) the FWHM; and (b)
Figure 8. The
the integrated surface
intensity stabilityfrom
obtained of therocking
Cu sample,
scanswhich
at theshowed additional
(0, 1, 0.5) positionpeaks arising from
as a function the scan
of the
presence of Cu nano-crystals, i.e. equivalent to the data shown in Figure 3: (a) the FWHM;
number during the experiment. The potential is also shown in red. The peak width is increasing and (b) the
integrated intensity obtained from rocking scans at the (0, 1, 0.5) position as a function of the scan
and the integrated intensity is not recovering after having held the potential positively, indicating a
number during the experiment. The potential is also shown in red. The peak width is increasing and
change in surface morphology with increased roughness and smaller domain size during the course of
the integrated intensity is not recovering after having held the potential positively, indicating a
the experiment.
change in surface morphology with increased roughness and smaller domain size during the course
of the experiment.
4. Discussion
4. Discussion
In this paper, we present a structural investigation of the Cu(111) electrode surface in
phosphate-containing
In this paper,neutral electrolyte
we present solution.
a structural We have found
investigation of the two different
Cu(111) surface
electrode behaviours
surface in
depending on the initialneutral
phosphate-containing morphology and
electrolyte defectWe
solution. density of the
have found twosurface observed
different directly after
surface behaviours
preparation and on
depending transfer into the
the initial X-ray electrochemical
morphology cell. In
and defect density of both cases, however,
the surface observed a clear structural
directly after
preparation
transition and transfer
with potential wasintofound
the X-ray
at −electrochemical
0.6 V, which cell. In bothwith
coincides cases,ahowever,
current apeak
clear in
structural
the anodic
scan. transition with potential
The discussion was found at
of the structural −0.6 V,iswhich
results basedcoincides with a current
on the dataset peak in
presented in the anodic
Figures scan.
4–6, which
The discussion of the structural results is based on the dataset presented in Figures 4–6, which gave
gave the most concise insight into the underlying surface processes. At potentials negative of the
the most concise insight into the underlying surface processes. At potentials negative of the
observed transition, the coverage of the copper is constant and no potential dependent relaxation is
observed transition, the coverage of the copper is constant and no potential dependent relaxation is
observed. An increase in roughness can, however, be observed for increasingly cathodic potentials.
observed. An increase in roughness can, however, be observed for increasingly cathodic potentials.
The structural transition
The structural occurring
transition occurringatatpotentials −0.7VVcan
potentials>>−0.7 canbebeattributed
attributedto to
an an increased
increased surface
surface
roughness combined
roughness withwith
combined adsorption of an
adsorption of oxygenated
an oxygenatedspecies, followed
species, followedbybythethe
formation
formation of of
a mixed
a
copper-oxygen layer at positive
mixed copper-oxygen layer potentials. This transition
at positive potentials. is accompanied
This transition by an inward
is accompanied by anrelaxation
inward of
relaxation
the surface Cu of the and
layer surface Cu layer
a slight and a slight
outward outward
relaxation relaxation
of the secondofatomic
the second atomic Cu layer.
Cu layer.
Cyclic voltammograms were recorded at two different pH values and different phosphate
concentrations to get an estimate of the charge transfer and possible coverage of an anionic layer
and/or oxygenated species. For all electrolyte solutions, an anodic peak with a shoulder could be
observed indicating a slow two-step adsorption process. The charge under the anodic and cathodic
current peaks in the cyclic voltammetry corresponded to 0.2 electron transferred per surface atom. TheSurfaces 2019, 2 154
in situ X-ray structural analysis of the Cu(111) surface at −0.5 V gave an oxygen coverage θO = 0.6.
It is known that phosphate species have a tetrahedral structure with a P-O bond length of the order
dP-O ~ 1.5–1.6 Å, thus the corresponding O-O distance is dO-O ~ 2.44–2.62 Å [26–28]. The atomic
distance of the copper atoms at the Cu(111) surface is 2.556 Å, which is similar to the O-O distance in
the phosphate, thus making the adsorption of phosphate or hydrogen phosphate with three oxygen
atoms sitting in the same adsorption site likely. This suggests that the adsorbate species at −0.5 V can
be either hydrogen phosphate or phosphate and not dihydrogen phosphate. The exact nature of the
phosphate species and the adsorption process is, however, not fully understood. From the structural
analysis at −0.6 V, it is clear that the difference between the data recorded at the two most positive
potentials is not just due to a change in coverage of the adsorbed oxygenated species. The change
in relaxation of the topmost copper layer and the change in the distance of the oxygen atoms to the
Cu surface indicate an intermediate structure at this potential. This is also evident from the XRV and
potentiostatic measurements presented in Figure 2.
To further elucidate the adsorption process, the peak positions in the cyclic voltammetry measured
in 0.1 M phosphate solution at pH = 6 and pH = 8 are shown as a function of the logarithm of the
scan rate in Figure 9. The cathodic peak and the first anodic peak (corresponding to the shoulder in
the cyclic voltammogram) did not show a scan rate dependence, indicating a fast adsorption process,
whereas the second anodic peaks showed a slope of approximately 0.12 V/log (scan rate/(V/s)),
independent of the pH of the electrolyte, indicating is a slow process. The rate determining step in
the adsorption process is thus associated with the second anodic peak. The surface X-ray diffraction
data show that at the corresponding potentials a substantial rearrangement of the surface atomic
structure took place. The X-ray voltammetry obtained in-situ shows a large hysteresis consistent with a
slow mass transfer process. Static CTR measurement indicate the incorporation of oxygen/phosphate
into the Cu surface resulting in mixed surface copper-oxide and increased surface roughness in this
potential region. Structural rearrangements of the surface Cu layer with similarly slow kinetics have
been observed
Surfaces 2018,in
1, xalkaline
FOR PEERelectrolytes
REVIEW [29,30]. In that case, the slow kinetics were associated with
13 of 16
formation of a single Cu(I) oxide layer and a decrease of the Cu atomic density by 30% [31].
Figure 9. Peak potentials obtained from cyclic voltammograms are shown as function of the log of the
Figure 9. Peak potentials obtained from cyclic voltammograms are shown as function of the log of
scan rate: (A) pH = 6; and (B) pH = 8. The black and red symbols correspond to the first and second
the scan rate: (A) pH = 6; and (B) pH = 8. The black and red symbols correspond to the first and
anodicsecond
peaks,anodic
respectively. The green symbols correspond to the cathodic peak.
peaks, respectively. The green symbols correspond to the cathodic peak.
With the acid dissociation constant pKa(H2PO4-/HPO42−) = 7.2, at pH = 8 a proportion of 6%
H2PO4− and 94% HPO4− is expected, thus mostly hydrogen phosphate. At pH = 6 a proportion of 87%
H2PO4− and 13% HPO42− is expected in the electrolyte solution. On gold and platinum surfaces, the
adsorbed phosphate species has been found to be pH- and potential-dependent [32,33]. In contrast,
on copper surfaces, phosphate dihydrogen was found to adsorb for acidic electrolyte solutions (pH <Surfaces 2019, 2 155
With the acid dissociation constant pKa(H2 PO4 - /HPO4 2− ) = 7.2, at pH = 8 a proportion of 6%
H2 PO4 − and 94% HPO4 − is expected, thus mostly hydrogen phosphate. At pH = 6 a proportion of
87% H2 PO4 − and 13% HPO4 2− is expected in the electrolyte solution. On gold and platinum surfaces,
the adsorbed phosphate species has been found to be pH- and potential-dependent [32,33]. In contrast,
on copper surfaces, phosphate dihydrogen was found to adsorb for acidic electrolyte solutions (pH < 5)
but not in alkaline solution (pH > 9) [34]. Although we cannot totally exclude that dihydrogen is
adsorbing in the first step on the Cu surface, the fact that the two adsorption steps were observed at
pH = 6 and pH = 8 in the electrochemical data and did not show a difference in the kinetics of the
processes, suggest that the adsorption process occurred through a similar mechanism. In addition, a
more covalent bonding between the oxygen of the phosphate and copper was found, in comparison
to silver and gold [34], and this could lead to the atomic rearrangement and slow mass transport
observed in the X-ray measurements.
By combining the structural and electrochemical results, we propose the following adsorption
mechanism: The first peak observed in the cyclic voltammograms corresponds to adsorption of
hydrogen phosphate to the surface (either directly or through the deprotonation of dihydrogen
phosphate depending on the pH). This is supported by the structural data where a small amount of
oxygen was found to be specifically adsorbed into three-fold hollow sites on the Cu surface. The second
anodic peak is associated with the deprotonation of the hydrogen phosphate and the adsorption of the
phosphate anion which forms a strong bond with the Cu surface leading to an atomic rearrangement
involving the incorporation of three oxygen atoms from the phosphate into the surface Cu layer. This
process is totally reversible, as also confirmed by the electrochemical characterization which gives the
same charge under the peak in the cyclic voltammogram for the anodic and cathodic process.
The elucidation of the adsorption process helps in understanding the differences in stability of
the Cu(111) electrodes during adsorption process and the dependence on the details of Cu surface
preparation. The in-situ X-ray diffraction data enable three main properties of the surface contributing
to the morphology to be distinguished: (a) the domain size of the atomic terraces present at the
surface; (b) the presence of Cu nano-crystals at the surface; and (c) the overall atomic roughness,
described through the β-model and hereafter referred to as rugosity. We have shown that, even
though the Cu(111) surfaces exhibit identical terrace lengths, the rugosity of the surface at terrace
level might be different. The Cu(111) surface with large rugosity shows a reversible adsorption
process of phosphates and oxygen incorporation into the crystalline structure. On the other hand,
the Cu(111) surface with copper nano-crystals present on the surface showed degradation upon
phosphate adsorption/desorption driven by the potential cycling. Surprisingly the rugosity was larger
on the surface showing reversible adsorption, the reversible nature of the adsorption/desorption
being evident from the stable intensity at the anti-Bragg position of the CTRs. The oxygen induced
reconstruction of the Cu(111) surface at room temperature have shown the formation of a disordered
surface overlayer, with O and Cu atoms at different heights [35]. It has been proposed that the
formation of this disorder overlayer favours the oxygen diffusion on Cu (111) leading to fast nucleation
of a large number of oxide islands. We propose a similar process in electrochemical media through the
oxygens of the adsorbed phosphates.
As the adsorption of phosphate increases the rugosity of the surface, we associate the differences
in stability of the two surfaces to the presence of surface defects acting as nucleation sites for Cu
ad-atoms created during the phosphate incorporation into the surface Cu layer. Depending on the
surface morphology, these atoms can be incorporated into the nano-crystals present on the surface,
thus leading to further roughening and decrease in the surface domain size, i.e., the Cu surface is
unstable. On a Cu electrode surface with high rugosity, no single nucleation sites stand out and
the formation of nano-crystals is prevented. This is a more stable Cu electrode surface exhibiting a
reversible phosphate adsorption process.Surfaces 2019, 2 156
5. Conclusions
In this paper, we present electrochemical and in-situ surface X-ray diffraction measurements
of phosphate adsorption onto Cu(111) electrodes. The underlying mechanism of the phosphate
adsorption and deprotonation of the (di)-hydrogen phosphate was accompanied by a roughening of
the Cu surface. We report for the first time the roughening of the Cu surface through the formation of a
mixed copper–oxygen layer, where the oxygen from an adsorbed phosphate species was incorporated
into the surface Cu layer. The stability of the Cu(111) surface and the change of rugosity upon potential
cycling strongly depend on the preparation method and history of the electrode. It was shown that
the presence of Cu islands on the Cu(111) surface leads to a 3D nucleation and growth mechanism
which causes irreversible changes in surface morphology. The results demonstrate the importance
of controlling the surface preparation of copper catalysts, as this determines the stability of the
catalyst under operation conditions for the electrochemical CO2 reduction reaction. The incorporation
of oxygen into the metal surface from the adsorbed phosphate anion is a process that could also
be relevant to the study of similar oxoanions, such as sulphate, and their role in the stability of
electrocatalysts during oxidation processes.
Author Contributions: P.R. and Y.G. conceived the experiments. All authors contributed to the experimental
measurements. Y.G., J.B. and C.A.L. performed the analysis of the in-situ X-ray measurements. All authors
contributed to the discussion, writing and revision of the manuscript. All authors have given approval to the final
version of the manuscript.
Funding: This research received no external funding.
Acknowledgments: We thank the Diamond Light Source for supplying the beamtime necessary to conduct the
measurements presented in this paper. In particular we would like to thank our local contacts, Jonathan Rawle
and Hadeel Hussain, and the Diamond I07 team for their support during the experiment. AK acknowledges
the University of Birmingham for financial support through Ph.D. scholarships at the School of Chemistry.
P.R. acknowledges the University of Birmingham for financial support through the Birmingham fellowship
program. Y.G. acknowledges the Royal Society for funding through a Royal Society Research Fellowship.
Conflicts of Interest: The authors declare no conflict of interest. The funders had no role in the design of the
study; in the collection, analyses, or interpretation of data; in the writing of the manuscript, or in the decision to
publish the results.
References
1. Larrazábal, G.O.; Martín, A.J.; Pérez-Ramírez, J. Building blocks for high performance in electrocatalytic CO2
reduction: materials, optimization strategies, and device engineering. J. Phys. Chem. Lett. 2017, 8, 3933–3944.
2. Arán-Ais, R.M.; Gao, D.; Roldan cuenya, B. structure- and electrolyte-sensitivity in CO2 electroreduction.
Acc. Chem. Res. 2018, 51, 2906–2917. [CrossRef] [PubMed]
3. Engstfeld, A.K.; Maagaard, T.; Horch, S.; Chorkendorff, I.; Stephens, I.E.L. Polycrystalline and Single-Crystal
Cu Electrodes: Influence of Experimental Conditions on the Electrochemical Properties in Alkaline Media.
Chem. A Eur. J. 2018, 24, 17743–17755. [CrossRef] [PubMed]
4. Grosse, P.; Gao, D.; Scholten, F.; Sinev, I.; Mistry, H.; Roldan Cuenya, B. Dynamic Changes in the Structure,
Chemical State and Catalytic Selectivity of Cu Nanocubes during CO2 Electroreduction: Size and Support
Effects. Angew. Chem. 2018, 130, 6300–6305. [CrossRef]
5. Mistry, H.; Varela, A.S.; Bonifacio, C.S.; Zegkinoglou, I.; Sinev, I.; Choi, Y.-W.; Kisslinger, K.; Stach, E.A.;
Yang, J.C.; Strasser, P.; et al. Highly selective plasma-activated copper catalysts for carbon dioxide reduction
to ethylene. Nat. Commun. 2016, 7, 12123. [CrossRef] [PubMed]
6. Resasco, J.; Chen, L.D.; Clark, E.; Tsai, C.; Hahn, C.; Jaramillo, T.F.; Chan, K.; Bell, A.T. Promoter Effects
of Alkali Metal Cations on the Electrochemical Reduction of Carbon Dioxide. J. Am. Chem. Soc. 2017, 139,
11277–11287. [CrossRef] [PubMed]
7. Le Duff, C.S.; Lawrence, M.J.; Rodriguez, P. Role of the Adsorbed Oxygen Species in the Selective
Electrochemical Reduction of CO2to Alcohols and Carbonyls on Copper Electrodes. Angew. Chem. Int. Ed.
2017, 56, 12919–12924. [CrossRef] [PubMed]Surfaces 2019, 2 157
8. Kas, R.; Kortlever, R.; Milbrat, A.; Koper, M.T.M.; Mul, G.; Baltrusaitis, J. Electrochemical CO2 reduction on
Cu2 O-derived copper nanoparticles: controlling the catalytic selectivity of hydrocarbons. Phys. Chem. Chem.
Phys. 2014, 16, 12194–12201. [CrossRef] [PubMed]
9. Mandal, L.; Yang, K.R.; Motapothula, M.R.; Ren, D.; Lobaccaro, P.; Patra, A.; Sherburne, M.; Batista, V.S.;
Yeo, B.S.; Ager, J.W.; et al. Investigating the Role of Copper Oxide in Electrochemical CO2 Reduction in Real
Time. ACS Appl. Mater. Interfaces 2018, 10, 8574–8584. [CrossRef] [PubMed]
10. Verdaguer-Casadevall, A.; Li, C.W.; Johansson, T.P.; Scott, S.B.; McKeown, J.T.; Kumar, M.; Stephens, I.E.L.;
Kanan, M.W.; Chorkendorff, I. Probing the Active Surface Sites for CO Reduction on Oxide-Derived Copper
Electrocatalysts. J. Am. Chem. Soc. 2015, 137, 9808–9811. [CrossRef] [PubMed]
11. Lee, S.; Kim, D.; Lee, J. Electrocatalytic Production of C3-C4 Compounds by Conversion of CO2 on a
Chloride-Induced Bi-Phasic Cu2 O-Cu Catalyst. Angew. Chem. Int. Ed. 2015, 54, 14701–14705. [CrossRef]
[PubMed]
12. Eilert, A.; Cavalca, F.; Roberts, F.S.; Osterwalder, J.; Liu, C.; Favaro, M.; Crumlin, E.J.; Ogasawara, H.;
Friebel, D.; Pettersson, L.G.M.; et al. Subsurface Oxygen in Oxide-Derived Copper Electrocatalysts for
Carbon Dioxide Reduction. J. Phys. Chem. Lett. 2017, 8, 285–290. [CrossRef] [PubMed]
13. Friebel, D.; Broekmann, P.; Wandelt, K. Electrochemical in situ STM study of a Cu(111) electrode in neutral
sulfate containing electrolyte. Phys. Status Solidi 2004, 201, 861–869. [CrossRef]
14. Lucas, C.A.; Markovic, N.M. Structure Relationships in Electrochemical Reactions. In Encyclopedia of
Electrochemistry; Wiley-VCH Verlag GmbH & Co. KGaA: Weinheim, Germany, 2007; ISBN 9783527610426.
15. Gründer, Y.; Lucas, C.A. Surface X-ray diffraction studies of single crystal electrocatalysts. Nano Energy 2016,
29, 378–393. [CrossRef]
16. Lucas, C.A.; Thompson, P.; Gründer, Y.; Markovic, N.M. The structure of the electrochemical double layer:
Ag(111) in alkaline electrolyte. Electrochem. Commun. 2011, 13, 1205–1208. [CrossRef]
17. Sisson, N.; Gründer, Y.; Lucas, C.A. Structure and Stability of Underpotentially Deposited Ag on Au(111) in
Alkaline Electrolyte. J. Phys. Chem. C 2016, 120, 16100–16109. [CrossRef]
18. Nicklin, C.; Arnold, T.; Rawle, J.; Warne, A. Diamond beamline I07: A beamline for surface and interface
diffraction. J. Synchrotron Radiat. 2016, 23, 1245–1253. [CrossRef] [PubMed]
19. Vlieg, E. A (2 + 3)-Type Surface Diffractometer: Mergence of the z-Axis and (2 + 2)-Type Geometries. J. Appl.
Crystallogr. 1998, 31, 198–203. [CrossRef]
20. Schlepütz, C.M.; Herger, R.; Willmott, P.R.; Patterson, B.D.; Bunk, O.; Brönnimann, C.; Henrich, B.; Hülsen, G.;
Eikenberry, E.F. Improved data acquisition in grazing-incidence X-ray scattering experiments using a pixel
detector. Acta Crystallogr. Sect. A Found. Crystallogr. 2005, 61, 418–425. [CrossRef] [PubMed]
21. Schlepütz, C.M.; Mariager, S.O.; Pauli, S.A.; Feidenhansl, R.; Willmott, P.R. Angle calculations for a (2+3)-type
diffractometer: Focus on area detectors. J. Appl. Crystallogr. 2011, 44, 73–83. [CrossRef]
22. Robinson, I.K. Crystal truncation rods and surface roughness. Phys. Rev. B 1986, 33, 3830–3836. [CrossRef]
23. Platzman, I.; Brener, R.; Haick, H.; Tannenbaum, R. Oxidation of Polycrystalline Copper Thin Films at
Ambient Conditions. J. Phys. Chem. C 2008, 112, 1101–1108. [CrossRef]
24. Pérez León, C.; Sürgers, C.; Löhneysen, H. Formation of copper oxide surface structures via pulse injection
of air onto Cu(111) surfaces. Phys. Rev. B 2012, 85, 035434.
25. Matsumoto, T.; Bennett, R.A.; Stone, P.; Yamada, T.; Domen, K.; Bowker, M. Scanning tunneling microscopy
studies of oxygen adsorption on Cu(1 1 1). Surf. Sci. 2001, 471, 225–245. [CrossRef]
26. Gamoke, B.; Neff, D.; Simons, J. Nature of PO Bonds in Phosphates. J. Phys. Chem. A 2009, 113, 5677–5684.
[CrossRef] [PubMed]
27. Pye, C.C.; Rudolph, W.W. An ab Initio, Infrared, and Raman Investigation of Phosphate Ion Hydration.
J. Phys. Chem. A 2003, 107, 8746–8755. [CrossRef]
28. Rose, J.; Flank, A.M.; Masion, A.; Bottero, J.Y.; Elmerich, P. Nucleation and Growth Mechanisms of Fe
Oxyhydroxide in the Presence of PO4 Ions. 2. P K-Edge EXAFS Study. Langmuir 1997, 13, 1827–1834.
[CrossRef]
29. Maurice, V.; Strehblow, H.H.; Marcus, P. In situ STM study of the initial stages of oxidation of Cu(111) in
aqueous solution. Surf. Sci. 2000, 458, 185–194. [CrossRef]
30. Kunze, J.; Maurice, V.; Klein, L.H.; Strehblow, H.H.; Marcus, P. In situ scanning tunneling microscopy study
of the anodic oxidation of Cu(111) in 0.1 M NaOH. J. Phys. Chem. B 2001, 105, 4263–4269. [CrossRef]Surfaces 2019, 2 158
31. Kunze, J.; Maurice, V.; Klein, L.H.; Strehblow, H.-H.; Marcus, P. In situ STM study of the anodic oxidation of
Cu(0 0 1) in 0.1 M NaOH. J. Electroanal. Chem. 2003, 554–555, 113–125. [CrossRef]
32. Yaguchi, M.; Uchida, T.; Motobayashi, K.; Osawa, M. Speciation of Adsorbed Phosphate at Gold Electrodes:
A Combined Surface-Enhanced Infrared Absorption Spectroscopy and DFT Study. J. Phys. Chem. Lett. 2016,
7, 3097–3102. [CrossRef] [PubMed]
33. Gisbert, R.; García, G.; Koper, M.T.M. Adsorption of phosphate species on poly-oriented Pt and Pt(1 1 1)
electrodes over a wide range of pH. Electrochim. Acta 2010, 55, 7961–7968. [CrossRef]
34. Niaura, G.; Gaigalas, A.K.; Vilker, V.L. Surface-Enhanced Raman Spectroscopy of Phosphate Anions:
Adsorption on Silver, Gold, and Copper Electrodes. J. Phys. Chem. B 1997, 101, 9250–9262. [CrossRef]
35. Jensen, F.; Besenbacher, F.; Lægsgaard, E.; Stensgaard, I. Oxidation of Cu(111): two new oxygen induced
reconstructions. Surf. Sci. Lett. 1991, 259, L774–L780.
© 2019 by the authors. Licensee MDPI, Basel, Switzerland. This article is an open access
article distributed under the terms and conditions of the Creative Commons Attribution
(CC BY) license (http://creativecommons.org/licenses/by/4.0/).You can also read


