Intercomparisons of Long-Term Atmospheric Temperature and Humidity Profile Retrievals - MDPI
←
→
Page content transcription
If your browser does not render page correctly, please read the page content below
remote sensing
Article
Intercomparisons of Long-Term Atmospheric
Temperature and Humidity Profile Retrievals
Jessica L. Matthews 1, *        and Lei Shi 2
 1   North Carolina State University, Cooperative Institute for Climate and Satellites—North Carolina
     (CICS-NC), 151 Patton Avenue, Asheville, NC 28801, USA
 2   NOAA’s National Centers for Environmental Information (NCEI), 151 Patton Avenue, Asheville, NC 28801,
     USA; lei.shi@noaa.gov
 *   Correspondence: jlmatthe@ncsu.edu; Tel.: +1-828-257-3055

 Received: 12 February 2019; Accepted: 3 April 2019; Published: 9 April 2019

 Abstract: This study builds upon a framework to develop a climate data record of temperature and
 humidity profiles from high-resolution infrared radiation sounder (HIRS) clear-sky measurements.
 The resultant time series is a unique, long-term dataset (1978–2017). To validate this long-term
 dataset, evaluation of the stability of the intersatellite time series is coupled with intercomparisons
 with independent observation platforms as available in more recent years. Eleven pairs of satellites
 carrying the HIRS instrument with time periods that overlap are examined. Correlation coefficients
 were calculated for the retrieval of each atmospheric pressure level and for each satellite pair.
 More than 90% of the cases examining both temperature and humidity have correlation coefficients
 greater than 0.7. Very high correlation is demonstrated at the surface and two meter levels for both
 temperature (>0.99) and specific humidity (>0.93). For the period of 2006–2017, intercomparisons are
 performed with four independent observations platforms: radiosonde (RS92), constellation observing
 system for meteorology ionosphere and climate (COSMIC), global climate observing system (GCOS)
 reference upper-air network (GRUAN), and infrared atmospheric sounding interferometer (IASI).
 Very close matching of surface and two meter temperatures over a wide domain of values is depicted
 in all presented intercomparisons: intersatellite matches of HIRS retrievals, HIRS vs. GRUAN, and
 HIRS vs. IASI.

 Keywords: temperature; humidity; HIRS; retrieval algorithms and methods; satellite observation

1. Introduction
      Since 1978, the high-resolution infrared radiation sounder (HIRS) instruments have been making
observations of the atmosphere from the surface to the stratosphere. The instruments are carried by
both the National Oceanic and Atmospheric Administration (NOAA) polar orbiting satellite series
and the meteorological operational satellite program (Metop) A and B satellites operated by the
European Organization for the Exploitation of Meteorological Satellites (EUMETSAT). Among all
satellite sounders, the HIRS observations have provided the longest period of record for measurements
of global temperature and humidity.
      The HIRS instrument has 20 channels, of which channels 1–12 are longwave channels ranging
from 6.5–15 µm, channels 13–19 are shorter wavelengths between 3.7 and 4.6 µm, and channel 20 is
a visible channel (0.69 µm). The sounder is a discrete stepping, line-scan instrument, with a nadir
diameter of approximately 20 km for HIRS/2-3 instruments and 10 km for HIRS/4 (NOAA polar
orbiter data user’s guide and NOAA KLM user’s guide, available at https://www1.ncdc.noaa.gov/
pub/data/satellite/publications/podguides/). Together with other sounder measurements, HIRS
data have been used in various applications. For example, an improved initialization inversion (3I)

Remote Sens. 2019, 11, 853; doi:10.3390/rs11070853                        www.mdpi.com/journal/remotesensing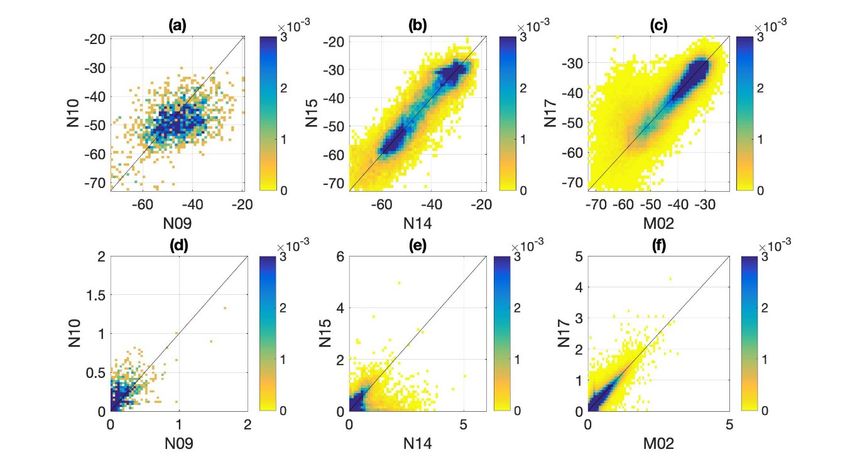
Remote Sens. 2019, 11, 853                                                                             2 of 15

method was built based on physical–statistical algorithms [1] to retrieve meteorological variables
from NOAA polar orbiting satellites. An international advanced television and infrared observation
satellite operational vertical sounder (ATOVS) processing package (IAPP) was developed for real-time
users to retrieve atmospheric temperature and moisture profiles and other parameters [2]. HIRS data
were used to construct surface temperature data over both land [3,4] and sea [5]. HIRS derived upper
tropospheric water vapor data were used as one of the datasets to study the feedback mechanism for
amplifying anthropogenic climate change [6]. HIRS measurements supported other observations in
examining the Walker circulations [7] and expansion of the tropical zone [8]. HIRS measurements were
also used in studies of the El Niño–Southern Oscillation (ENSO) [9–13]. HIRS is one of the sounders
processed in the NOAA product system [14].
      Previous work involved preliminary algorithm development using HIRS to build an atmospheric
profile dataset suitable for climate applications [15]. In that study, global comparisons with RS92
radiosonde and global positioning system radio occultation (GPS RO) observations showed mean
biases within +/−0.3 ◦ C for temperature and within +/−0.2 g/kg for specific humidity at standard
pressure levels (850, 700, 600, 500, 400, 300, 200, 100, and 50 hPa).
      Along with the homogeneous observations provided by RS92 radiosonde and GPS RO
observations, several other atmospheric profile measurement platforms exist including: the high-quality
measurements from radiosondes in the global climate observing system (GCOS) reference upper-air
network (GRUAN) and retrievals based on the infrared atmospheric sounding interferometer (IASI)
instrument. Observations from these four platforms are compared to the HIRS-based retrieval in this
study. It should be noted that none of these available alternative data sets provide nearly the long-term
time series available based on HIRS. However, assessing the quality of the HIRS retrieval in recent
years where these platforms overlap in conjunction with an evaluation of the stability of the complete
time series provides a long-term picture of the quality of the full dataset.
      This study builds upon the initially presented framework [15]. In Section 2 we describe the use of
HIRS observations for a long-term retrieval of atmospheric temperature and humidity profile data.
We then examine the stability of the time series, which is based on input from twelve different satellite
platforms, in Section 3.1. Finally, in Section 3.2, we present multiple intercomparisons as independent
validation of the data set. The discussion and conclusion sections follow.

2. Materials and Methods
    Much of the basis for the retrieval algorithm has been previously described [15]. We briefly
summarize the approach in Section 2.1, highlighting in particular changes to the implementation
applied herein. The independent data sets used for bias correction of the retrieval and comparison
purposes presented in Section 3 are described in Section 2.2.

2.1. Retrieval Algorithm
     The main components of the retrieval included: neural network training, cloud-screening, and
bias calibration.

2.1.1. Neural Network Training
     At higher elevations, a few channels, such as channels 6 and 7 that normally measure temperatures
in the 700–1000 hPa layer, start to intersect the surface. To account for the influence of surface elevation,
separate neural networks with inputs for HIRS channel data, emissivity, and CO2 were trained and
applied based on surface pressure to connect long-wave HIRS observations to atmospheric profile
information. Using Metop-A as the reference satellite, limb-corrected HIRS data were inter-calibrated
as a function of brightness temperatures to be used as input into a three-layer feed-forward neural
network [16–20]. This approach also accounts for the spectral changes in the HIRS sensor during the
period of record.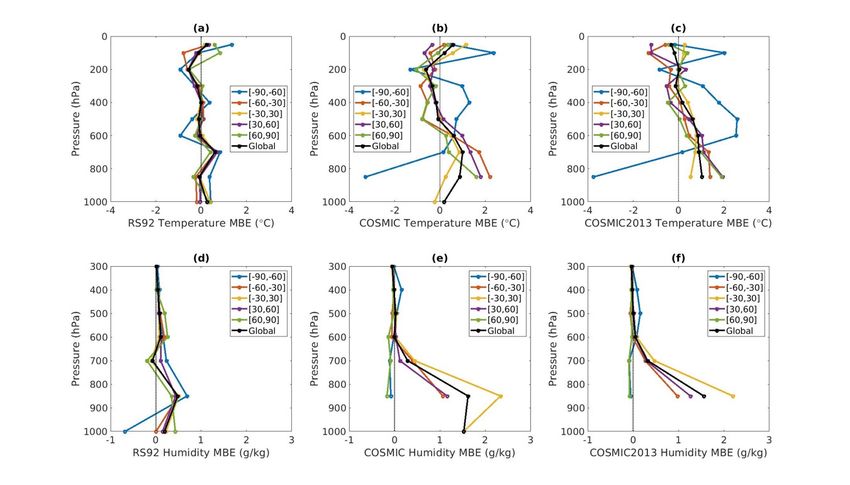
Remote Sens. 2019, 11, 853                                                                        3 of 15

      The neural networks were trained using data produced by a radiative transfer model, radiative
transfer for TOVS (RTTOV) [21]. RTTOV was specifically developed to simulate satellite sounder
measurements, including HIRS. More than 62,000 clear-sky ECMWF sampled profiles covering all
latitudes and longitudes provided the input to RTTOV, which output the simulated HIRS channel
brightness temperatures for Metop-A’s HIRS instrument.
      Due to the impact of CO2 on brightness temperatures [15], neural networks were trained with
profile data produced under six different RTTOV modeling scenarios: 330, 350, 370, 390, 410, and
430 ppm. Monthly Mauna Loa observations were used as an input of the retrieval [22]. Surface
emissivity has been shown to have an impact on surface skin and air temperatures. Surface emissivity
values as defined in the International Satellite Cloud Climatology Project (ISCCP) dataset were used as
an input of the retrieval for surface and near-surface variables [23].

2.1.2. Cloud-Screening
      As an infrared sounder, HIRS can only sense the top of clouds when clouds are present. Therefore,
the temperature and humidity profile retrievals are based only on clear-sky pixels. A two-tiered
approach was used to identify cloudy pixels. The first pass, which filters the majority of clouds, was
based on a cloud detection procedure used in ISCCP [24]. The second procedure used optimized cloud
fraction and cloud probability values from the AVHRR pathfinder atmospheres-extended (PATMOS-x)
climate data record (CDR) to identify remaining cloudy pixels [25].

2.1.3. Bias Calibration
     GPS RO derivations yielded stratospheric temperatures with high accuracy while spatially and
temporally homogenous radiosonde observations provided highly accurate tropospheric temperature
and humidity data. These two platforms were used in combination for bias correction. GPS RO
(specifically, COSMIC2013) data from 2008–2010 was used for correction of the HIRS temperature data
for the stratosphere (50–300 hPa levels). Global RS92 data from 2008–2010 was used for correction of
the remaining pressure levels for temperature data and all pressure levels for humidity data.
     HIRS pixels determined as clear or only possibly partially cloudy were matched to COSMIC2013
and RS92 data within 0.1◦ latitude and longitude and one hour of measurement at each pressure level.
A multiple linear regression was performed for each pressure level with dependencies on latitude and
the HIRS observed values. Further details may be found in [15].

2.1.4. Significant Changes from Previous Studies
     In all, these changes detailed below have resulted in an improved dataset from previous versions.
By removing inputs deemed unstable, the resulting retrieval is more consistent as a long-term data
record. In comparison to validation results shown with the previous version in [15], the agreement of
the HIRS retrieval with COSMIC and RS92 in recent years appears to be similar if not slightly more
in agreement.
     Removed channel 10 as a neural network input: based on the conclusions of channel 10 instability
over the long-term, this version did not include channel 10 as an input [19]. Temperature retrievals for
standard pressure levels from 1000 hPa to 50 hPa used channels 2–9 and 11–12 (in addition to CO2
inputs). Humidity retrievals for standard pressure levels from 1000 hPa to 300 hPa used channels 4–8
and 11–12 (in addition to CO2 inputs). Surface skin and 2 m temperature retrievals used channels 7–8
(in addition to CO2 and emissivity inputs). Two meter humidity retrievals used channels 7–8 and 11
(in addition to CO2 and emissivity inputs).
     Removed unreliable Metop-02 data: analysis revealed instability in HIRS measurements on
Metop-02 beginning May 2011 and lasting through March 2013. Figure 1 illustrates the instability.
These data have been omitted as inputs to the retrieval algorithm as any derived data would be suspect.
Most of this time period was covered by NOAA-17, so the omission did not adversely impact the
overall time series continuity.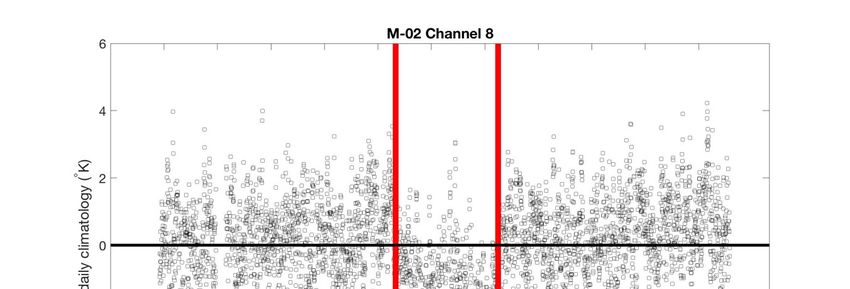
identified as the mean ±1.5 standard deviations. Additionally, the ECMWF training data set was
examined to ensure all training data fell within these limits established by RS92 data, and if not, the
bounds were adjusted to contain the extremes of the training data set as well. The fraction of extreme
outliers from the HIRS retrieval excluded by this methodology amounts to less than 1% of
temperature
Remote          data
       Sens. 2019,      and less than 0.7% of humidity data.
                   11, 853                                                                        4 of 15

     Figure 1. Anomalies of daily mean MetOp-02 high-resolution infrared radiation sounder (HIRS)
     channel
     Figure 1.8 brightness
                Anomaliestemperatures    as compared
                              of daily mean   MetOp-02tohigh-resolution
                                                             a 2007–2017 climatology. Vertical red
                                                                            infrared radiation     lines indicate
                                                                                                sounder   (HIRS)
     the period
     channel     of instability
              8 brightness      removed asasancompared
                            temperatures        input to this
                                                          to a retrieval.
                                                               2007–2017 climatology. Vertical red lines indicate
     the period of instability removed as an input to this retrieval.
      Using only two neural networks instead of three: separate neural networks were developed for
groupings   by surface
      Additional       pressure.
                   quality        Previously,
                            control            there
                                     flags: there waswere  three groups
                                                        a quality         of surface pressure
                                                                    flag indicating  (0) clear,(Ps): Ps < 700 hPa,
                                                                                                (1) possibility of
700  hPa ≤cloudiness,
partially   Ps < 850 hPa,
                        (2) and
                            likely   ≥ 850 hPa.
                                 Pscloudy,    and Because   the vast
                                                  (3) no cloud         majority of the globe
                                                                  fraction/probability        has Ps ≥available.
                                                                                         information     850 hPa,
we  simplified the
Additionally,       groupings
                in this version,toatwo:  Ps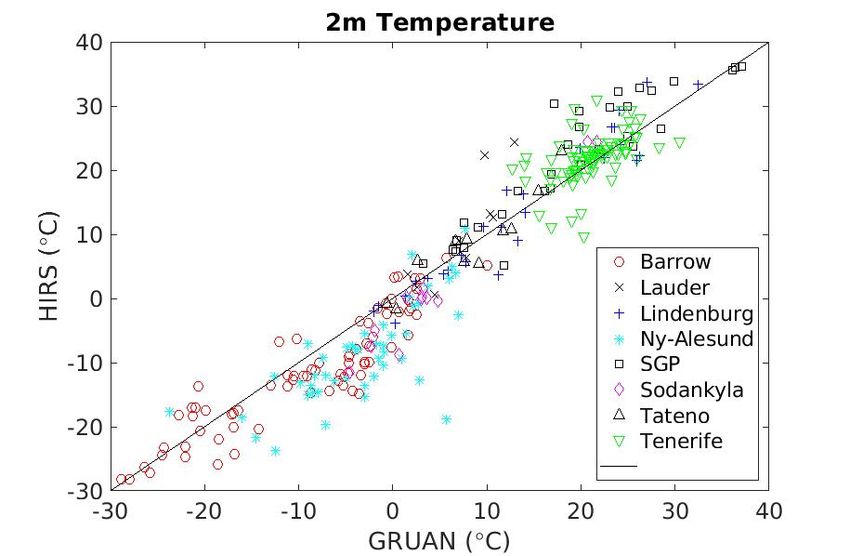
Remote Sens. 2019, 11, 853                                                                       5 of 15

humidity inversion, and (2) corrected humidity inversion. If humidity inversion was detected, it was
corrected if the location is non-polar (considered here as latitude below/above −60/60◦ N). If the
location was polar it was left as it was. The assumption here was that humidity inversion was possible
over the poles but typically not over the rest of the globe. Any correction applied to 2 m values was
assigned the humidity closest to the surface. Other profile corrections were assigned the humidity at
the adjacent standard level closer to the surface.

2.2. Data

2.2.1. RS92
     Global RS92 data [26] from 2008–2010 was used for bias correction of the HIRS data, as described
in Section 2.1.3. Data from 2013–2017 was used for validation purposes in Section 3.2.1. During this
intercomparison effort, outlier RS92 temperature values were noted. To filter out the rogue RS92
outliers, we used the limiting bounds established with the RS92 and training data, as described in
Section 2.1.4.

2.2.2. COSMIC
     GPS RO measurements from Constellation Observing System for Meteorology Ionosphere and
Climate (COSMIC) were used both as part of the retrieval process and for validation purposes.
Two versions of COSMIC data were used in this study: the original COSMIC as well as COSMIC2013,
the re-processed version of GPS RO derived profiles. COSMIC and COSMIC2013 data were obtained
from University Corporation for Atmospheric Research COSMIC Data Analysis and Archive Center
(CDAAC) [27]. Previous studies comparing COSMIC and multiple types of radiosonde temperature
measurements in the upper troposphere and lower stratosphere indicate that RS92 agrees well with a
mean bias close to zero [28].
     COSMIC2013 data from 2008–2010 was used for bias correction of the HIRS temperature data
for the stratosphere (50–300 hPa levels), as detailed in Section 2.1.3. Global COSMIC2013 data from
2013-2014 and COSMIC data from 2014–2017 was used for validation purposes.

2.2.3. GRUAN
     The GCOS GRUAN measurements included high-quality RS92 measurements for the surface
to the stratosphere (https://www.gruan.org). Data from eight sites located across the globe with
observations ranging from 2006–2017 were used for validation purposes [29]. Note that although
GRUAN uses RS92 radiosondes, they apply their own unique calibration procedure and this data was
not a subset of the RS92 data described in Section 2.2.1.

2.2.4. IASI
     On board the MetOp series of polar orbiting satellites (including MetOp-02, which also carries a
HIRS instrument) is the IASI [30]. This hyperspectral instrument was designed to measure temperature
and humidity profiles in the troposphere and lower stratosphere, and be the successor to HIRS in this
regard. Given that both instruments are on the same satellite, the number of matches was substantial.
To examine any seasonality in comparisons, both January and July observations were examined
for 2014.
     Level 2 IASI products included profile observations of both temperature and atmospheric water
vapor approximate to the standard levels of the HIRS product, as well as surface skin temperatures.
Previous studies, limited to regional analysis, evaluating the IASI temperature and moisture retrievals
as compared to radiosonde observations have shown consistent behavior with the exception of near
surface temperatures over land and humidity values under dry atmospheric conditions [31–33].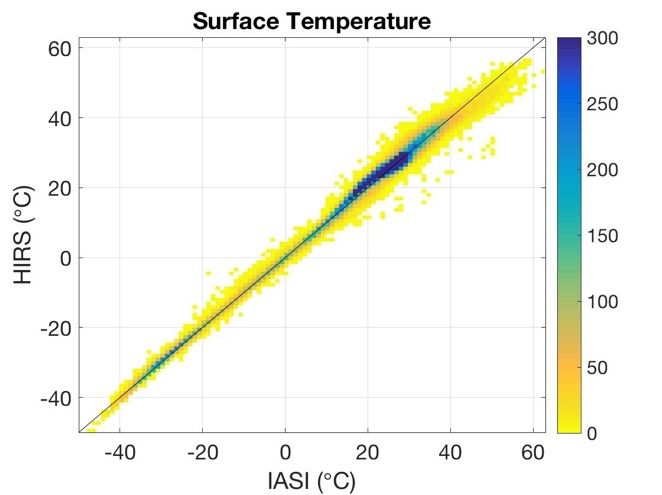
Remote Sens. 2019, 11, 853                                                                                        6 of 15

3. Results
     The consistency of the retrieval, as determined through intersatellite comparison, is examined in
Section 3.1. Independent validation and intercomparisons with five different datasets are presented in
Section 3.2.

3.1. Intersatellite Comparisons
      Twelve polar orbiting satellites with the HIRS instrument were used to produce the retrievals: N-6,
N-7, N-8, N-9, N-10, N-11, N-12, N-14, N-15, N-16, N-17, and Metop-2. The first eleven items of this
list are from the operational NOAA polar orbiting series. The last satellite is from the meteorological
operational satellite program (Metop) series operated by EUMETSAT. From this list, there are eleven
pairs of satellites with time periods that overlap. Table 1 summarizes the associated matchups where
data were within 0.02◦ latitude and longitude and one hour of measurement.

      Table 1. Eleven satellite pairs with temporal overlap. Satellite pairs, date range of overlap, number of
      profile matchups, and coverage characteristics are described. Data were considered a match if within
      0.02◦ latitude and longitude and one hour of measurement.

           Satellite Pair                   Date Range                 No. Profile Matchups          Coverage 1
             N-7/N-8                16 May 1983–30 May 1984                      1117                   polar
            N-9/N-10                 17 Nov 1987–18 Oct 1988                     1629                   polar
            N-10/N-11                8 Nov 1988–16 Sept 1990                     3147                   polar
            N-11/N-12               16 Sept 1991–27 Aug 1994                     6597                   polar
            N-12/N-14               9 Feb 1995–31 March 1997                     3788                   polar
            N-14/N-15                31 Oct 1998–25 July 2002                   31,826                  global
            N-14/N-16               20 Mar 2001–25 July 2002                     3491                   polar
            N-15/N-16                20 Mar 2001–26 Oct 2003                     6452                   polar
            N-15/N-17               24 Aug 2002–30 Mar 2005                      6864                   polar
            N-16/N-17               24 Aug 2002–31 Dec 2003                      9049                   polar
            M-02/N-17                29 June 2007–10 Jan 2009                  211,176                  global
              1   Coverage is considered “polar” if the majority of matchups occur above 60◦ N or below −60◦ N.

     Correlation coefficients were calculated for each atmospheric pressure level and for each satellite
pair. Figure 2 illustrates the correlation coefficients which may be interpreted as a measure of the
agreement between the two set of observations. When evaluating all cases for both temperature and
humidity (11 satellite pairs × (8 humidity levels + 12 temperature levels) = 220 cases), correlation
coefficients greater than 0.7 was achieved more than 90% of the time.
     Where the correlation coefficients were below 0.7, the comparisons between temperature retrievals
showed two satellite pairs with poorer correlations at the 500 hPa level and eight satellite pairs at the
300 hPa level. There were two satellite pairs that had sufficient agreement for temperature at all levels,
N-14/N-15 and M-02/N-17, which were particularly significant as they were the two comparisons
with globally located matchups. There were six satellite pairs that had sufficient agreement for specific
humidity at all levels. The remaining five satellite pairs had correlation coefficients below 0.7 at 500 hPa
(N-7/N-8, N-9/N-10, N-14/N-15), 400 hPa (N-7/N-8, N-9/N-10, N-11/N-12, N-12/N-14, N-14/N-15),
and 300 hPa (N-9/N-10, N-11/N-12, N-14/N-15). Normalized histograms of a sample of these results
are presented in Figure 3. For this figure, three representative satellite pairs were selected: N-9/N-10
to show a case where matches were only in the polar region, N-14/N-15, and M-02/N-17 to show the
cases where matches occurred globally. The particular levels were chosen to visualize cases of both
sufficient and insufficient intersatellite correlation.
     Of particular note was the very high correlation at the surface and 2 m levels for both temperature
and specific humidity. This was of interest because the retrieval at these levels uses only HIRS data
from Channels 7–8 for temperature and Channels 7–8 and 11 for specific humidity. Conversely,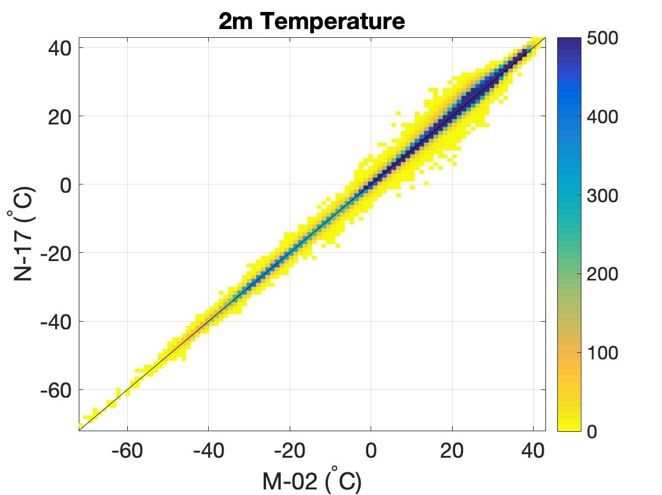
Remote Sens. 2018, 10, x FOR PEER REVIEW 7 of 16
Remote
Remote Sens.
Sens. 2018,
2019, 11,10,
853x FOR PEER REVIEW 7 7ofof
15 16
Conversely, the profile retrievals used ten and seven HIRS channels as inputs for temperature and
Conversely, the profile retrievals used ten and seven HIRS channels as inputs for temperature and
specific
the humidity,
profile respectively.
retrievals used ten and seven HIRS channels as inputs for temperature and specific
specific humidity, respectively.
humidity, respectively.
(a) (b )
(a) (b ) 1
1
50 hPa
50 hPa 300 hPa
300 hPa
100 hPa
0.9
100 hPa
0.9
200 hPa 400 hPa
200 hPa 400 hPa
300 hPa
300 hPa 500 hPa 0.8
500 hPa 0.8
400 hPa
400 hPa
Pressure level
Pressure level
600 hPa
500 hPa
Pressure level
Pressure level
600 hPa
500 hPa
0.7
0.7
600 hPa
600 hPa 700 hPa
700 hPa
700 hPa
700 hPa
850 hPa 0.6
850 hPa 850 hPa 0.6
850 hPa
1000 hPa
1000 hPa 1000 hPa
1000 hPa
2m 0.5
2m 0.5
2m
Surface 2m
Surface
0.4
0.4
8
0
1
2
4
5
6
6
7
7
7
8
09 1 8 0
10 1 0 1
11 1 1 2
12 1 2 4
14 1 4 5
14 1 5 6
15 1 6 6
15 1 6 7
16 0 7 7
02 7 7
N N -N0
N N 0-8N1
N N 1-0N1
N N 1-1N1
N N 12N1
N N 1-4N1
N N 1-5N1
N N 1-6N1
N N 1-6N1
N M 1-7N1
M N1-7N1
N N -N0
N NN0-N1
N NN1-N1
N NN1-N1
N NN1-N1
N NN1-N1
N N 1 1
N NN1-N1
N NN1-N1
N M N1-N1
M N1-N1
-N4-N
17
17
-N2-
07
-N9
-N0
-N1
-N4
-N4
-N5
-N5
-N6
-2
07
-9
0
-1
-2
-4
-5
-5
-6
2
-N
07 0
09 1
10 1
11 1
12 1
14 1
14 1
15 1
15 1
16 0
-N
07 0
N
-
-
N
02
Satellite pair Satellite pair
Satellite pair Satellite pair
Figure 2. Correlation coefficients by standard atmospheric pressure level of eleven satellite pairs for
Figure
Figure 2. 2. Correlation
Correlation coefficients
coefficients byby standard
standard atmospheric
atmospheric pressure
pressure level
level of of eleven
eleven satellite
satellite pairs
pairs forfor
(a) temperature and (b) specific humidity.
(a)(a) temperature
temperature andand
(b)(b) specific
specific humidity.
humidity.
Figure 3.
Figure Histograms(normalized
3. Histograms (normalizedbybycount)
count)ofof temperature
temperature (◦ C)
(°C) at 300
at 300 hPahPafor for
(a) (a)
N-9N-9
vs. vs.
N-10,N-10,
(b)
Figure
(b) N-14 3. Histograms (normalized by count) of temperature (°C) at 300 hPa for (a) N-9 vs. N-10,
(g/kg)(b)
N-14 vs. vs.
N-15,N-15,
andand
(c) (c)
M-02M-02
vs.vs. N-17.
N-17. Histograms
Histograms (normalizedbybycount)
(normalized count)ofofspecific
specific humidity
humidity (g/kg)
N-14
at 400 vs. for
400 hPa
hPa N-15, and
(d) N-9 (c)
vs. M-02
N-9 vs. N-10,vs. N-17.
(e) N-14 Histograms
N-14 vs.
vs. and(normalized
N-15, and (f) M-02
M-02 vs. by count) of specific humidity (g/kg)
vs. N-17.
N-17.
at for (d) N-10, (e) N-15, (f)
at 400 hPa for (d) N-9 vs. N-10, (e) N-14 vs. N-15, and (f) M-02 vs. N-17.RemoteSens.
Remote Sens.2019,
2018,11,
10,853
x FOR PEER REVIEW 88 of 16
of 15
3.2. Independent Validation
3.2. Independent Validation
In this section, comparisons were made only to data derived from Metop-2 HIRS observations.
TableIn2this
summarizes the pressurewere
section, comparisons levels where
made only comparisons
to data derivedwerefrom
madeMetop-2
with theHIRS
independent data
observations.
sets. In
Table general, datathe
2 summarizes were considered
pressure levelsa where
match comparisons
if within 0.1° were
latitude andwith
made longitude and one hour
the independent of
data
measurement,
sets. In general,the HIRS
data werecloud flag was
considered 0 or 1 if(clear
a match or 0.1
within ◦
possibility
latitudeofand
partially cloudiness),
longitude and the
and one hour of
HIRS data were
measurement, thenot corrected
HIRS for temperature
cloud flag inversion.
was 0 or 1 (clear or possibility of partially cloudiness), and the HIRS
data were not corrected for temperature inversion.
Table 2. Pressure levels where comparisons with high-resolution infrared radiation sounder (HIRS)
retrievals
Table are available
2. Pressure and performed.
levels where comparisonsTwith
andhigh-resolution
Q indicate temperature and specific
infrared radiation humidity
sounder (HIRS)
retrievals
comparisons,are respectively.
available and performed. T and Q indicate temperature and specific humidity
comparisons, respectively.
1000 850 700 600 500 400 300 200 100 50
Data set Surface 2m
Data set Surface 2m
hPa
1000 hPa
850 hPa
700 hPa
600 hPa
500 hPa
400 hPa
300 hPa
200 hPa
100 hPa
50
RS92 hPa
T,Q hPa
T,Q hPa
T,Q hPa
T,Q hPa
T,Q hPa
T,Q hPa
T,Q hPa
T hPa
T hPaT
RS92 1
COSMIC T,Q
T,Q T,Q
T,Q T,Q
T,Q T,Q
T,Q T,Q
T,Q T,Q
T,Q T,Q
T,Q TT T
T TT
COSMIC 1 T,Q T,Q T,Q T,Q T,Q T,Q T,Q T T T
GRUAN T,Q T,Q T,Q T,Q T,Q T,Q T,Q T,Q T T T
GRUAN T,Q T,Q T,Q T,Q T,Q T,Q T,Q T,Q T T T
IASI
IASI TT T,Q
T,Q T,Q
T,Q T,Q
T,Q T,Q
T,Q T,Q
T,Q T,Q
T,Q T,Q
T,Q TT T
T TT
1 COSMIC and
1 COSMIC andCOSMIC2013 comparisons
COSMIC2013 comparisons areare at the
at the same
same levels.
levels.
3.2.1. RS92
3.2.1. RS92
RS92 provides water vapor pressure values which were transformed to specific humidity for
RS92 provides water vapor pressure values which were transformed to specific humidity for
comparison with HIRS-based retrievals. Results from matches between 2013–2017 are presented in
comparison with HIRS-based retrievals. Results from matches between 2013–2017 are presented in
Figure 4a,d where there were at least 10 matchups for a pressure level. Global mean bias errors (MBE),
Figure 4a,d where there were at least 10 matchups for a pressure level. Global mean bias errors (MBE),
where MBE = HIRS_value − other_value, averaged across all pressure levels from 1000 hPa to 50 hPa
where MBE = HIRS_value − other_value, averaged across all pressure levels from 1000 hPa to 50 hPa
is close to zero for temperature (0.0005 °C). Similar global MBE averaged for humidity were 0.12 g/kg,
is close to zero for temperature (0.0005 ◦ C). Similar global MBE averaged for humidity were 0.12 g/kg,
the magnitude of which was driven by larger errors seen at the 850 hPa level.
the magnitude of which was driven by larger errors seen at the 850 hPa level.
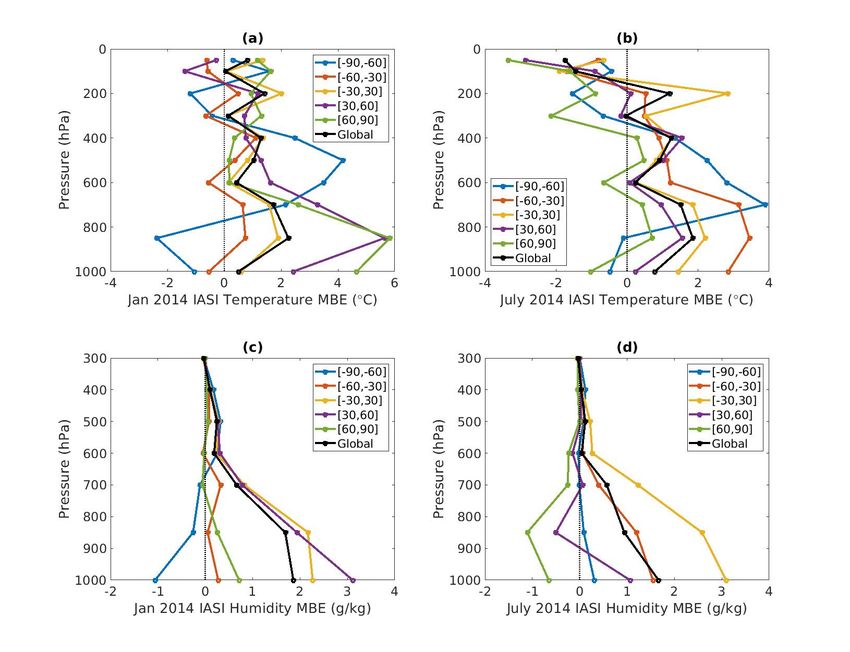
Figure 4. Mean bias errors (MBE) between HIRS and other retrievals (HIRS–other) at standard
Figure 4. Mean
atmospheric bias errors
pressure levels,(MBE) between
subdivided by HIRS andranges.
latitude other retrievals
Temperature(HIRS–other)
MBE (◦ C)at for
standard
HIRS
atmospheric with
comparisons pressure levels, subdivided
(a) radiosonde by latitude observing
(RS92); (b) constellation ranges. Temperature MBE (°C)ionosphere
system for meteorology for HIRS
comparisons
and with (a) and
climate (COSMIC); radiosonde (RS92); (b)
(c) COSMIC2013. constellation
Humidity observing
MBE (g/kg) system forwith
for comparisons meteorology
(d) RS92;
ionosphere and climate (COSMIC);
(e) COSMIC; and (f) COSMIC2013. and (c) COSMIC2013. Humidity MBE (g/kg) for comparisons with
(d) RS92; (e) COSMIC; and (f) COSMIC2013.Remote Sens. 2019, 11, 853 9 of 15
3.2.2. COSMIC and COSMIC2013
COSMIC and COSMIC2013 data flagged with quality control issues were not used. COSMIC
and COSMIC2013 provide water vapor pressure values which were transformed to specific humidity
for comparison with HIRS. Results for where there were at least 10 matchups for a pressure level are
presented in Figure 4b,c,e,f. Data from 2014–2017 was matched with COSMIC and data from 2013–2014
was matched with the reprocessed COSMIC2013.
High accuracy was assumed for these GPS RO observations of stratospheric temperatures,
which is why COSMIC2013 data were used for bias correction of 50–300 hPa temperature retrievals.
The comparisons with HIRS-based retrievals do match closer at these levels than in the troposphere,
albeit measurements in the southern-most latitudinal band exhibits notable variability for both COSMIC
and COSMIC2013. For COSMIC, global MBE averaged across all pressure levels from 1000 hPa to
50 hPa was 0.18 ◦ C for temperature. Similar global MBE averaged for humidity were 0.49 g/kg, the
magnitude of which was driven by larger errors seen at the 850 hPa level. For COSMIC2013, it was
0.33 ◦ C for temperature and 0.31 g/kg for humidity. In general, the GPS RO humidity observations at
700–1000 hPa appeared to be significantly lower than the HIRS-based retrievals.
3.2.3. GRUAN
Launch location and time was used for matching of 2 m temperature and humidity observations
(although GRUAN refers to these as surface observations). GRUAN pressure levels nearest to the
standard HIRS pressure levels were matched with actual latitude and longitude locations, incorporating
drift for profile temperature and humidity observations. GRUAN provides relative humidity values
which were transformed to specific humidity for comparison with HIRS-based retrievals. Specific
GRUAN sites used for comparisons and the number of matches at each are indicated in Table 3.
Comparison results are presented in Figure 5, where there were at least 10 matchups for a pressure level.
Table 3. Reference upper-air network (GRUAN) sites and locations. The number of matches count
each pressure level independently, for observations between 2006 and 2017.
Latitude
GRUAN Site Surface Elevation (m) No. Matches
(◦ N)/Longitude (◦ E)
Barrow 1 71.32/−156.61 8 798
Lauder −45.05/169.68 370 10
Lindenberg 52.21/14.12 98 403
Ny-Ålesund 78.92/11.93 5 525
SGP 1 36.60/−97.49 320 57
Sodankylä 67.37/26.63 179 53
Tateno 36.06/140.13 27 129
Tenerife 1 28.32/−16.38 115 311
1 These sites are not yet fully certified by GRUAN.
In Figure 5a, the Ny−Ålesund station is an outlier root mean square error (RMSE) at both the 2 m
and 1000 hPa levels, but this may be an artifact of the matchup there because the surface pressure is very
close to 1000 hPa. The outlier at 400 hPa is the Tateno station, where HIRS is slightly overestimating
temperature. Similarly, the outlier at 300 hPa is from the Barrow station where HIRS is slightly
underestimating temperature.
Overall, in Figure 5c there are many levels showing coverage of zero MBE, indicative of good
temperature estimation with HIRS. Both the 1000 hPa and 850 hPa levels show all matched stations
have negative MBEs, indicating an underestimation by HIRS. Conversely, the 700, 600 and 500 hPa
levels had primarily positive MBEs, indicating an overestimation by HIRS. The outliers occurring at
850 hPa (SGP) and 700 hPa (Tenerife) showed a better agreement with HIRS as the values are closer toRemote Sens. 2019, 11, 853 10 of 15
zero. However, the outlier at the 600 hPa level, Ny-Ålesund, is more positive indicating that HIRS may
be especially overestimating temperature at this level for this station.
The specific humidity RMSEs shown in Figure 5b are consistently decreasing with increasing
altitude. Further, as shown in Figure 5d, all levels show coveraged of zero MBE, indicating good
agreement between HIRS and the GRUAN measurements.
Remote Sens. 2018, 10, x FOR PEER REVIEW 10 of 16
Figure 5. Boxplots of comparisons between HIRS and reference upper-air network (GRUAN) stations
Figure 5. Boxplots of comparisons between HIRS and reference upper-air network (GRUAN) stations
for temperature and specific humidity, root mean square error (RMSE) and MBEs. Along the horizontal
for temperature and specific humidity, root mean square error (RMSE) and MBEs. Along the
axis delineates the profile height from 2 m to 50 hPa. The central mark in each box indicates the
horizontal axis delineates the profile height from 2 m to 50 hPa. The central mark in each box indicates
median value amongst all GRUAN stations. The edges of the box are the 25th (Q1) and 75th (Q3)
the median value amongst all GRUAN stations. The edges of the box are the 25th (Q1) and 75th (Q3)
percentiles, while the whiskers extend to values within Q3+W*(Q3-Q1) and Q1-W*(Q3-Q1) (roughly
percentiles,
99.3 coveragewhile the whiskers
of normally extendvalues)
distributed to values within
where W =Q3+W*(Q3-Q1) and Q1-W*(Q3-Q1)
1.5. The plus signs indicate outlier(roughly
values.
99.3 coverage of normally
◦ distributed values) where W = 1.5. The plus signs indicate
◦ outlier
(a) Temperature RMSE ( C); (b) specific humidity RMSE (g/kg); (c) temperature MBE ( C); (d) specific values.
(a) Temperature
humidity MBE (g/kg).RMSE (°C); (b) specific humidity RMSE (g/kg); (c) temperature MBE (°C); (d) specific
humidity MBE (g/kg).
3.2.4. IASI
In Figure 5a, the Ny−Ålesund station is an outlier root mean square error (RMSE) at both the 2
For each of the two months examined, January and July of 2014, there were more than
m and 1000 hPa levels, but this may be an artifact of the matchup there because the surface pressure
50,000 matches at the surface and for each standard pressure level with the exception of 1000 hPa
is very close to 1000 hPa. The outlier at 400 hPa is the Tateno station, where HIRS is slightly
where there were on the order of 16,000 matches in July and 24,000 in January due to matches in high
overestimating temperature. Similarly, the outlier at 300 hPa is from the Barrow station where HIRS
terrains where the surface pressure was less than 1000 hPa. Data were considered a match if within
is slightly underestimating temperature.
0.05◦ latitude and longitude of the same orbit, the HIRS cloud flag was 0 or 1, and the HIRS data were
Overall, in Figure 5c there are many levels showing coverage of zero MBE, indicative of good
not corrected for temperature inversion. IASI pressure levels nearest to the standard HIRS pressure
temperature estimation with HIRS. Both the 1000 hPa and 850 hPa levels show all matched stations
levels were matched, ultimately within 3% of the standard levels.
have negative MBEs, indicating an underestimation by HIRS. Conversely, the 700, 600 and 500 hPa
HIRS specific humidity was compared directly to IASI atmospheric water vapor. Figure 6c,d show
levels had primarily positive MBEs, indicating an overestimation by HIRS. The outliers occurring at
that the humidity comparisons are fairly similar in both January and July, although the global MBEs
850 hPa (SGP) and 700 hPa (Tenerife) showed a better agreement with HIRS as the values are closer
are slightly lower across all pressure levels in July.
to zero. However, the outlier at the 600 hPa level, Ny-Ålesund, is more positive indicating that HIRS
The temperature comparisons are more seasonally complex. At the 100 and 50 hPa levels in
may be especially overestimating temperature at this level for this station.
July the global MBEs are negative versus positive in January (Figure 6a,b). The average MBE for all
The specific humidity RMSEs shown in Figure 5b are consistently decreasing with increasing
latitudinal bands examined were negative in July, indicating that either HIRS is too cool or IASI is too
altitude. Further, as shown in Figure 5d, all levels show coveraged of zero MBE, indicating good
warm at these levels during the summer. In January the global response was mixed, with positive
agreement between HIRS and the GRUAN measurements.
3.2.4. IASI
For each of the two months examined, January and July of 2014, there were more than 50,000
matches at the surface and for each standard pressure level with the exception of 1000 hPa where
there were on the order of 16,000 matches in July and 24,000 in January due to matches in high terrainsRemote Sens. 2019, 11, 853 11 of 15
MBEs along the equator and both poles at 100 and 50 hPa, but overall much better matching between
HIRS and IASI. The near surface levels (1000 and 850 hPa) appear to have much better MBEs in July,
particularly for the ◦ N latitude region. So, in the winter HIRS is too warm (or IASI is too cool),
Remote Sens. 2018, 10, x30–90
FOR PEER REVIEW 12 of 16
but the estimates seem closer in July.
Figure 6. MBE between HIRS and infrared atmospheric sounding interferometer (IASI) retrievals
(HIRS-IASI) at standard
Figure 6. MBE betweenatmospheric
HIRS andpressure
infraredlevels, subdivided
atmospheric by latitude
sounding ranges. Temperature
interferometer MBE
(IASI) retrievals
(◦(HIRS-IASI)
C) in (a) January 2014; and (b) July 2014. Humidity MBE (g/kg) in (c) January 2014; and (d) July
at standard atmospheric pressure levels, subdivided by latitude ranges. Temperature 2014.
MBE (°C) in (a) January 2014; and (b) July 2014. Humidity MBE (g/kg) in (c) January 2014; and (d)
4. Discussion
July 2014.
The results presented from the intersatellite comparison yield insight into both the quality of the
retrieval
relativeattodifferent
the lower levels as well
specific as the quality
humidity values,of the intersatellite
leading calibrationcorrelations
to lower calculated performed external to
in the cases
this study.
where Sufficient
matchups areagreement
not global.between retrievals on separate but overlapping satellites, as measured
by correlation coefficients
By comparing being greater
correlation than 0.7,
coefficients is achieved
amongst thesefor more than
satellite pairs,90% weof are
the cases for both
assuming that
conditions are
temperature andfairly similar
humidity. during
Some these different
differences time periods
are expected becauseofthe overlap.
matches However, in Figures3b,c,
are not exact in space
both
and pairs
time which0.02
(within toutdegrees
global latitude/longitude
matchups, the normalized and onedistributions
hour). Weakofcorrelations
values lookcan quite
be adifferent
result
ofalthough
either poor both are well-correlated.
calibration for some orItallisHIRS possible that itormay
channels, a poornotretrieval
be fair algorithm.
to directly Ifcompare the
all inputs
correlations
were seen between,
not calibrated for example,
well, all retrieval levelsN-7/N-8 in 1983 poor
would exhibit to M-02/N-17
correlation.in 2008 when
This is very
not the different
case here.
Inenvironmental conditions
particular extremely highcould be prevailing.
correlation is foundThis
in all situation
pairs forissurface
unlikely,andbut2 is
msomething
observations.to consider
These
when interpreting
retrievals are based on thechannels
results presented
7, 8, and 11, inand
Figure
it is 2.
fair to conclude these channels are well-calibrated.
However, GPSweak
RO humidity
correlationobservations at 700–1000
is seen for several satellitehPa areattoo
pairs dry given
varying the levels.
pressure resultsSince
of COSMIC2013
the profile
compared
retrievals to RS92,
include which
inputs hasamore
from wider reliability
range of in the troposphere.
HIRS channels (2–9,GPS RO humidity
11–12), we concludeobservations
that someat
of700–1000 hPa arehave
these channels significantly
room forlower than the HIRS-based
improvement retrievals,
in their calibration andwith
thatthetheexception
retrievalsofarethemore
polar
regions to
sensitive (Figure 4e,f).
different However,
channels HIRS retrievals
at different pressurecompare
levels. fairly well with RS92 at these same levels
(Figure 4d). 1,
In Table Given that RS92 if
it is indicated is the
assumed to havematches
intersatellite high accuracy in the troposphere,
occur globally or only in thethispolar
suggests that
region.
both
The of these GPS
“polar-only” RO humidity
matching occursdatasets
becausemay be too dry
the satellite pairatisthe 700–1000athPa
measuring levels.times of the day,
different
Global MBE
and therefore of humidity
the orbits do not meetdatatheis significantly higher in IASI
matching requirements in theone
of within 700–1000 hPa levels.
hour except Given
in the polar
the reliability of RS92, and how well HIRS-based retrievals match (Figure 4d), this suggests that IASI
is possibly too dry at these levels. The phenomenon is similar for both January and July, although the
effect appears to be greater in January. The globally averaged dryness seems to be driven by the
region between −30 and 60° N in January and the region between −60 and 30° N in July.
Temperature comparisons with IASI (Figure 6a,b) have much more variability than comparisonsRemote Sens. 2019, 11, 853 12 of 15
region. This is an important consideration because, in general, the pairs with only polar matches have
both fewer matchups and a much smaller range of values. The very dry conditions over the poles
especially limits the range of specific humidity values in the “polar-only” matched pairs (e.g., Figure 3
shows a representative polar matchup in Figure 3d and global matching in Figure 3e,f). There is more
variability relative to the lower specific humidity values, leading to lower calculated correlations in the
cases where matchups are not global.
By comparing correlation coefficients amongst these satellite pairs, we are assuming that
conditions are fairly similar during these different time periods of overlap. However, in Figure 3b,c,
both pairs which tout global matchups, the normalized distributions of values look quite different
although both are well-correlated. It is possible that it may not be fair to directly compare the
correlations seen between, for example, N-7/N-8 in 1983 to M-02/N-17 in 2008 when very different
environmental conditions could be prevailing. This situation is unlikely, but is something to consider
when interpreting the results presented in Figure 2.
GPS RO humidity observations at 700–1000 hPa are too dry given the results of COSMIC2013
compared to RS92, which has more reliability in the troposphere. GPS RO humidity observations at
700–1000 hPa are significantly lower than the HIRS-based retrievals, with the exception of the polar
regions (Figure 4e,f). However, HIRS retrievals compare fairly well with RS92 at these same levels
(Figure 4d). Given that RS92 is assumed to have high accuracy in the troposphere, this suggests that
both of these GPS RO humidity datasets may be too dry at the 700–1000 hPa levels.
Global MBE of humidity data is significantly higher in IASI in the 700–1000 hPa levels. Given the
reliability of RS92, and how well HIRS-based retrievals match (Figure 4d), this suggests that IASI is
possibly too dry at these levels. The phenomenon is similar for both January and July, although the
effect appears to be greater in January. The globally averaged dryness seems to be driven by the region
between −30 and 60◦ N in January and the region between −60 and 30◦ N in July.
Temperature comparisons with IASI (Figure 6a,b) have much more variability than comparisons
with RS92 (Figure 4a) across all latitudinal bands. RS92 MBEs at all levels seem to be well contained
within a one-degree margin, whereas IASI MBEs vary from nearly −4 to +6 degrees. Focusing on
the global average MBE, IASI is cooler than HIRS at all levels in January. Triangulating these results
with the RS92 comparisons, it suggests that the IASI retrieval may be too cool at all studied levels in
January. The results in July are slightly more complex. All latitudinal bands show a negative MBE at
the 50–100 hPa levels. Comparing to the good agreement between RS92 and HIRS, this suggests that
IASI may be too warm at these levels in July, especially in the Northern Hemisphere.
Perhaps the most striking intercomparisons of this study are those of surface and two meter
temperatures. The intersatellite correlation of both of these measurements was extremely high in all
matched pairs (Figure 2a). Further, examining the scatterplots show great agreement for a large range
of possible values. Figure 7a presents, as an example, the global matchups of two meter temperatures
between Metop-2 and NOAA-17. Results for the surface temperatures and for the other 10 pairs are
similar. Of particular note is the continued close agreement found in the extreme values. Table 2
indicates that GRUAN measured (approximate) two meter temperatures and IASI measured surface
temperatures. The GRUAN sites are geographically diverse and provide a wide range of observations
(Figure 7c). Surface temperatures from IASI matched to HIRS-based retrievals in January 2014 are
shown in Figure 7b. Despite the variability of the comparisons at other levels, the surface temperatures
are remarkably aligned.Remote Sens. 2019, 11, 853 13 of 15
Remote Sens. 2018, 10, x FOR PEER REVIEW 14 of 16
(a) (b)
(c)
Figure 7.7.(a)
Figure (a)Histogram
Histogramofof2 2mmtemperature
temperatureforfor
M-02M-02vs.vs. N-17.
N-17. Matches
Matches represent
represent locations
locations all over
all over the
the globe
globe duringduring the time
the time period
period of 2007–2009;
of 2007–2009; (b) histogram
(b) histogram of surface
of surface temperature
temperature for for
IASIIASI
vs. vs.
HIRSHIRS
in
in January
January 2014;
2014; (c) histogram
(c) histogram of 2ofm2temperature
m temperature for for GRUAN
GRUAN vs. vs.
HIRSHIRS during
during 2006–2017.
2006–2017.
5. Conclusions
Author Contributions: conceptualization, L.S. and J.M.; methodology, J.M. and L.S.; software, J.M.; writing, J.M.
and L.S.
This study builds upon the initially presented framework to develop a climate data record of
temperature
Funding: J.M.andwashumidity
supportedprofiles
by NOAA from HIRS the
through clear-sky measurements
Cooperative [15].
Institute for The resultant
Climate time series
and Satellites—North
Carolina
is under
a unique, Cooperative
long-term Agreement
dataset NA14NES432003.
(1978–2017). Although important as a stand-alone data record, this
time series also serves
Acknowledgments: as a critical
We thank input
Shu-peng Hofor
for several
providingother climate
the RS92 data used
datasets sets including: ISCCP [23] and
in this study.
the NASA/GEWEX Surface Radiation Budget [34]. Both of these reach thousands of users, so the
Conflicts of Interest:
downstream impactThe authors
of this inputdeclare no conflict of interest.
is significant.
Updates which improve the quality of the retrieval algorithm have been described. To validate
References
this long-term dataset, evaluation of the stability of the intersatellite time series is coupled with
intercomparisons
1. withN.A.;
Chedin, A.; Scott, independent observation
Wahiche, C.; Moulinier, platforms as available
P. The Improved in more
Initialization recent Method—A
Inversion years. Previous,
high-
resolution physical method for temperature retrievals from satellites of the Tiros-N series. J. Clim. Appl.
Meteorol. 1985, 24, 128–143.Remote Sens. 2019, 11, 853 14 of 15
current, and future efforts are all in support of developing a Climate Data Record of temperature and
humidity profiles from HIRS clear-sky measurements.
Correlation coefficients greater than 0.7 is achieved for more than 90% of the eleven different
intersatellite overlapping cases for both temperature and humidity. However, it is noted that some of
the channels have room for improvement in their calibration and that the retrievals are more sensitive
to different channels at different pressure levels, a potential area for future research.
Evaluation of the surface and two meter temperature retrievals demonstrate universally high
consistency between all satellite pairs as well as with independent data platforms. The retrieval
for these variables is dependent on only two HIRS channels while profile retrievals use 10 HIRS
channels. This may suggest one of two possibilities: (1) these two channels are incredibly well-suited
for describing the surface temperature while no combination of channels can describe the profile
temperatures as well, or (2) using fewer and more specific channels is a better methodology for each
individual profile level. Exploring these possibilities is another potential area for future research.
Author Contributions: Conceptualization, L.S. and J.M.; methodology, J.M. and L.S.; software, J.M.; writing, J.M.
and L.S.
Funding: J.M. was supported by NOAA through the Cooperative Institute for Climate and Satellites—North
Carolina under Cooperative Agreement NA14NES432003.
Acknowledgments: We thank Shu-peng Ho for providing the RS92 datasets used in this study.
Conflicts of Interest: The authors declare no conflict of interest.
References
1. Chedin, A.; Scott, N.A.; Wahiche, C.; Moulinier, P. The Improved Initialization Inversion Method—A
high-resolution physical method for temperature retrievals from satellites of the Tiros-N series. J. Clim. Appl.
Meteorol. 1985, 24, 128–143. [CrossRef]
2. Li, J.; Wolf, W.W.; Menzel, W.P.; Zhang, W.J.; Huang, H.L.; Achtor, T.H. Global soundings of the atmosphere
from ATOVS measurements: The algorithm and validation. J. Appl. Meteorol. 2000, 39, 1248–1268. [CrossRef]
3. Coccia, G.; Siemann, A.L.; Pan, M.; Wood, E.F. Creating consistent datasets by combining remotely-sensed
data and land surface model estimates through Bayesian uncertainty post-processing: The case of land
surface temperature from HIRS. Remote Sens. Environ. 2015, 170, 290–305. [CrossRef]
4. Siemann, A.L.; Coccia, G.; Pan, M.; Wood, E.F. Development and analysis of a long-term, global, terrestrial
land surface temperature dataset based on HIRS satellite retrievals. J. Clim. 2016, 29, 3589–3606. [CrossRef]
5. Peng, G.; Shi, L.; Stegall, S.T.; Matthews, J.L.; Fairall, C.W. An evaluation of HIRS near-surface air temperature
product in the arctic with SHEBA data. J. Atmos. Ocean Tech. 2016, 33, 453–460. [CrossRef]
6. Chung, E.S.; Soden, B.; Sohn, B.J.; Shi, L. Upper-tropospheric moistening in response to anthropogenic
warming. Proc. Natl. Acad. Sci. USA 2014, 111, 11636–11641. [CrossRef] [PubMed]
7. Sohn, B.J.; Park, S.-C. Strengthened tropical circulations in past three decades inferred from water vapor
transport. J. Geophys. Res. 2010, 115, D15112. [CrossRef]
8. Mantsis, D.F.; Sherwood, S.; Allen, R.; Shi, L. Natural variations of tropical width and recent trends.
Geophys. Res. Lett. 2017, 44, 3825–3832. [CrossRef]
9. Bates, J.J.; Jackson, D.L.; Breon, F.M.; Bergen, Z.D. Variability of tropical upper tropospheric humidity
1979–1998. J. Geophys. Res. Atmos. 2001, 106, 32271–32281. [CrossRef]
10. Shi, L.; Bates, J.J. Three decades of intersatellite-calibrated high-resolution infrared radiation sounder upper
tropospheric water vapor. J. Geophys. Res. Atmos. 2011, 116. [CrossRef]
11. McCarthy, M.P.; Toumi, R. Observed interannual variability of tropical troposphere relative humidity. J. Clim.
2004, 17, 3181–3191. [CrossRef]
12. Shi, L.; Schreck, C.J.; John, V.O. HIRS channel 12 brightness temperature dataset and its correlations with
major climate indices. Atmos. Chem. Phys. 2013, 13, 6907–6920. [CrossRef]
13. Shi, L.; Schreck, C.J.; Schroder, M. Assessing the pattern differences between satellite-observed upper
tropospheric humidity and total column water vapor during major el nino events. Remote Sens. 2018, 10,
1188. [CrossRef]Remote Sens. 2019, 11, 853 15 of 15
14. Reale, A.; Tilley, F.; Ferguson, M.; Allegrino, A. NOAA operational sounding products for advanced TOVS.
Int. J. Remote Sens. 2008, 29, 4615–4651. [CrossRef]
15. Shi, L.; Matthews, J.L.; Ho, S.-P.; Yang, Q.; Bates, J.J. Algorithm development of temperature and humidity
profile retrievals for long-term HIRS observations. Remote Sensing 2016, 8, 280. [CrossRef]
16. Jackson, D.L.; Wylie, D.P.; Bates, J.J. The HIRS pathfinder radiance data set (1979–2001). In Proceedings of the
12th Conference on Satellite Meteorology and Oceanography, Long Beach, CA, USA, 10–13 February 2003.
17. Cao, C.; Weinreb, M.; Xu, H. Predicting simultaneous nadir overpasses among polar-orbiting meteorological
satellites for the intersatellite calibration of radiometers. J. Atmos. Ocean. Technol. 2004, 21, 537–542. [CrossRef]
18. Cao, C.; Jarva, K.; Ciren, P. An improved algorithm for the operational calibration of the high-resolution
infrared radiation sounder. J. Atmos. Ocean. Technol. 2007, 24, 169–181. [CrossRef]
19. Shi, L.; Bates, J.J.; Cao, C. Scene radiance-dependent intersatellite biases of hirs longwave channels. J. Atmos.
Ocean. Technol. 2008, 25, 2219–2229. [CrossRef]
20. Shi, L. Intersatellite differences of HIRS longwave channels between NOAA-14 and NOAA-15 and between
NOAA-17 and METOP-A. IEEE Trans. Geosci. Remote 2013, 51, 1414–1424. [CrossRef]
21. Saunders, R.; Matricardi, M.; Brunel, P. An improved fast radiative transfer model for assimilation of satellite
radiance observations. Q. J. R. Meteorol. Soc. 1999, 125, 1407–1425. [CrossRef]
22. NOAA ESRL Global Monitoring Division. 2017, Updated Annually. Atmospheric Carbon Dioxide Dry Air Mole
Fractions from Quasi-Continuous Measurements at Mauna Loa, Hawaii; Thoning, K.W., Kitzis, D.R., Crotwell, A.,
Eds.; National Oceanic and Atmospheric Administration (NOAA), Earth System Research Laboratory
(ESRL), Global Monitoring Division (GMD): Boulder, CO, USA, 2017; Version 2018-10.
23. Rossow, W.B.; Dueñas, E.N. The international satellite cloud climatology project (ISCCP) web site: An online
resource for research. Bull. Am. Meteorol. Soc. 2004, 85, 167–172.
24. Rossow, W.B.; Garder, L.C. Cloud detection using satellite measurements of infrared and visible radiances
for ISCCP. J. Clim. 1993, 6, 2341–2369. [CrossRef]
25. Heidinger, A.K.; Foster, M.J.; Walther, A.; Zhao, X.P. The Pathfinder atmospheres-extended AVHRR climate
dataset. Bull. Am. Meteorol. Soc. 2014, 95, 909. [CrossRef]
26. Ho, S.-P.; Ho, S.-P.; Kuo, Y.-H.; Schreiner, W.; Zhou, X. Using si-traceable global positioning system radio
occultation measurements for climate monitoring. Bull. Am. Meteorol. Soc. 2010, 91, S36–S37.
27. University Corporation for Atmospheric Research COSMIC Data Analysis and Archive Center (CDAAC).
Available online: https://cdaac-www.cosmic.ucar.edu/cdaac/products.html (accessed on 21 August 2018).
28. He, W.; Ho, S.-P.; Chen, H.; Zhou, X.; Hunt, D.; Kuo, Y.-H. Assessment of radiosonde temperature
measurements in the upper troposphere and lower stratosphere using COSMIC radio occultation data.
Geophys. Res. Lett. 2009, 36, L17807. [CrossRef]
29. Thorne, P.W.; Vomel, H.; Bodeker, G.; Sommer, M.; Apituley, A.; Berger, F.; Bojinski, S.; Braathen, G.;
Calpini, B.; Demoz, B.; et al. GCOS reference upper air network (GRUAN): Steps towards assuring future
climate records. AIP Conf. Proc. 2013, 1552, 1042–1047.
30. Eumetsat. IASI Level 2: Product Guide 11 July 2017; EUM/OPS-EPS/MAN/04/0033; Eumetsat: Darmstadt,
Germany, 2017.
31. Pougatchev, N.; August, T.; Calbet, X.; Hultberg, T.; Oduleye, O.; Schlussel, P.; Stiller, B.; St. Germain, K.;
Bingham, G. Validation of the IASI temperature and water vapor profile retrievals by correlative radiosondes.
Proc. SPIE. 2008, 7081, 70810J.
32. Pougatchev, N.; August, T.; Calbet, X.; Hultberg, T.; Oduleye, O.; Schlussel, P.; Stiller, B.;
St. Germain, K.; Bingham, G. IASI temperature and water vapor retrievals—Error assessment and validation.
Atmos. Chem. Phys. 2009, 9, 6453–6458. [CrossRef]
33. Kwon, E.-H.; Sohn, B.J.; Smith, W.L.; Li, J. Validating IASI temperature and moisture sounding retrievals
over East Asia using radiosonde observations. J. Atmos. Ocean. Technol. 2012, 29, 1250–1262. [CrossRef]
34. National Aeronautics and Space Administration (NASA) Global Energy and Water Exchanges (GEWEX)
Surface Radiation Budget. Available online: https://gewex-srb.larc.nasa.gov/index.php (accessed on
23 January 2019).
© 2019 by the authors. Licensee MDPI, Basel, Switzerland. This article is an open access
article distributed under the terms and conditions of the Creative Commons Attribution
(CC BY) license (http://creativecommons.org/licenses/by/4.0/).You can also read


