Advanced Commercial Clothes Dryer Technologies Field Test - Minnesota.gov
←
→
Page content transcription
If your browser does not render page correctly, please read the page content below

Advanced Commercial Clothes
 Dryer Technologies Field Test
                                                               01/15/2018

                                                         Contract # 86409

              Conservation Applied Research and Development (CARD) FINAL Report

     Prepared for: Minnesota Department of Commerce, Division of Energy Resources
                                             Prepared by: Gas Technology Institute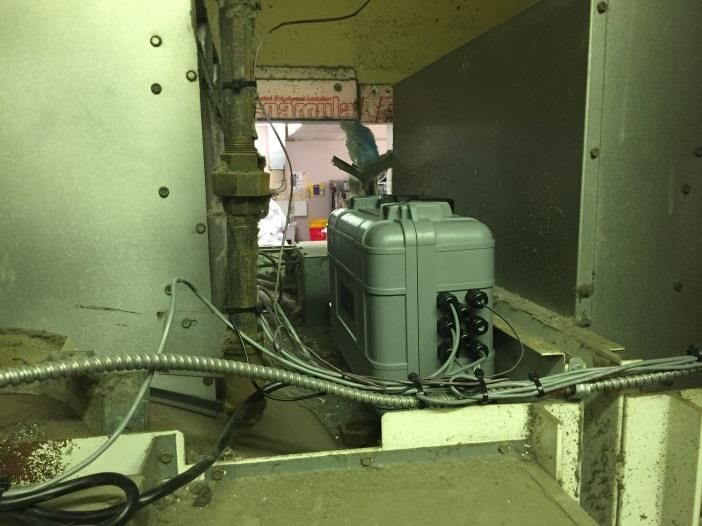
Prepared by:
Shawn Scott

Gas Technology Institute
1700 S Mount Prospect Rd.
Des Plaines, IL 60018
Phone: 847-768-0500
website: www.gastechnology.org
Project Contact: optional

© 2018 Gas Technology Institute. All rights reserved.

Contract Number: 86409

Prepared for Minnesota Department of Commerce, Division of Energy Resources:
Jessica Looman, Commissioner, Department of Commerce
Bill Grant, Deputy Commissioner, Department of Commerce, Division of Energy Resources
Anthony Fryer, Project Manager
651-539-1858
anthony.fryer@state.mn.us

                                           ACKNOWLEGEMENTS

This project was supported in part by a grant from the Minnesota Department of Commerce, Division of
Energy Resources, through the Conservation Applied Research and Development (CARD) program, which
is funded by Minnesota ratepayers.

The authors would also like to acknowledge the following for their financial, in-kind, or other contributions
to the project: CenterPoint Energy, EZ-Efficiency, and Self Propelled Scientific

                                               DISCLAIMER

This report does not necessarily represent the view(s), opinion(s), or position(s) of the Minnesota
Department of Commerce (Commerce), its employees or the State of Minnesota (State). When applicable,
the State will evaluate the results of this research for inclusion in Conservation Improvement Program
(CIP) portfolios and communicate its recommendations in separate document(s).

Commerce, the State, its employees, contractors, subcontractors, project participants, the organizations
listed herein, or any person on behalf of any of the organizations mentioned herein make no warranty,
express or implied, with respect to the use of any information, apparatus, method, or process disclosed
in this document. Furthermore, the aforementioned parties assume no liability for the information in this
report with respect to the use of, or damages resulting from the use of, any information, apparatus,
method, or process disclosed in this document; nor does any party represent that the use of this
information will not infringe upon privately owned rights.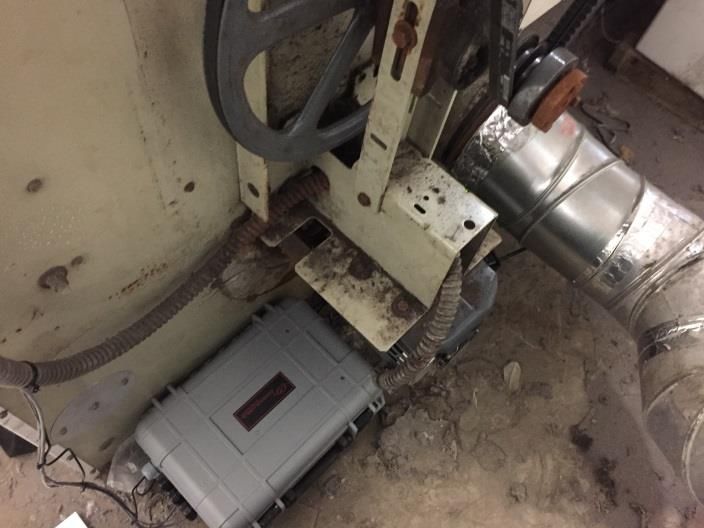
Table of Contents
Table of Contents ...............................................................................................................................1

List of Figures.....................................................................................................................................3

List of Tables ......................................................................................................................................4

Executive Summary............................................................................................................................1

   Background................................................................................................................................................ 1
   Results ....................................................................................................................................................... 2
Project Background ............................................................................................................................5

   Project Overview ....................................................................................................................................... 5
       Dryer Technology .................................................................................................................................. 5
       Site Selection ......................................................................................................................................... 5
       Monitoring ............................................................................................................................................ 6
   Previous Study Results .............................................................................................................................. 6
   Technology and Market Overview ............................................................................................................ 6
       Moisture Sensors .................................................................................................................................. 6
       Modulating Technology ........................................................................................................................ 7
Objective ...........................................................................................................................................9

Methodology ................................................................................................................................... 10

   Experimental Design and Procedure ....................................................................................................... 10
   Site Installation and Commissioning Requirements................................................................................ 10
   Analytical Methods.................................................................................................................................. 11
       Long-Term Monitoring ........................................................................................................................ 13
       Short-Term Monitoring ....................................................................................................................... 13
Results............................................................................................................................................. 15

   Installation and Commissioning .............................................................................................................. 15
   Energy Savings and Economic Performance ........................................................................................... 17
       Modulating Valve Results ................................................................................................................... 17
       Moisture Sensor Results ..................................................................................................................... 20
       Modulating Valve and Moisture Sensor Results ................................................................................. 23

Advanced Commercial Clothes Dryer Technologies Field Test
Gas Technology Institute                                                                                                                                          1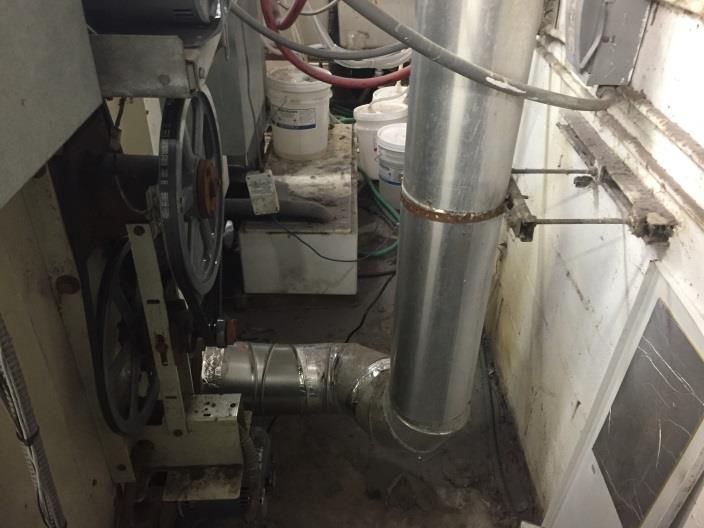
Stakeholder Acceptance .......................................................................................................................... 26
Conclusions and Recommendations.................................................................................................. 27

   Implications for MN State Gas Energy Efficiency Programs .................................................................... 27
   Lessons Learned ...................................................................................................................................... 28
   Recommendations for Further Study ...................................................................................................... 29
References....................................................................................................................................... 30

Appendix A: Test and Monitoring Plan .............................................................................................. 31

Appendix B: Detailed Site Results ..................................................................................................... 35

   Site #1 – Laundromat Detailed Results ................................................................................................... 35
   Site #2 – Dry Cleaner Detailed Results .................................................................................................... 37
   Site #3 – University Detailed Results ....................................................................................................... 38
   Site #4 – Hotel #1 Detailed Results ......................................................................................................... 39
   Site #5 – Health Care Site Detailed Results ............................................................................................. 41
   Site #6 – Hotel #2 Detailed Results ......................................................................................................... 42
Appendix C: End User Survey and Results ......................................................................................... 45

Advanced Commercial Clothes Dryer Technologies Field Test
Gas Technology Institute                                                                                                                                  2
List of Figures
Figure 1: DrySmart RMC Technology..................................................................................................... 7
Figure 2: EZ Efficiency BIO-Therm Dryer Modulating Kit .................................................................. 7
Figure 3: Data Collection Monitoring Diagram ................................................................................... 12
Figure 4: Site #1 –Laundromat - 2-Speed Queen 30 lb. Dryers, 2- Speed Queen 45 lb. Dryers .... 15
Figure 5: Site #2 – Dry Cleaner - Cissell 50 lb. Dryer .......................................................................... 16
Figure 6: Site #3 - University - 1-75 lb. Huebsch Dryer ...................................................................... 16
Figure 7: Site #4 - Hotel – 2- 75 lb. UniMac Dryers ............................................................................. 16
Figure 8: Site #5 – Healthcare - 2 – 75 lb. Huebsch Dryers................................................................. 17
Figure 9: Site #6- Hotel - Two Huebsch 120 lb. Dryers (Labeled #4 and #5 in Picture) ................ 17
Figure 10 Moisture Sensor Retrofit ........................................................................................................ 31
Figure 11 Modulating Gas Valve Retrofit ............................................................................................. 31
Figure 12: Data Collection Monitoring Diagram ................................................................................. 33
Figure 13: Site #1, Dryer #1 Gas/Cycle versus Make up Air Temperature .................................... 37
Figure 14: Site #2, Dryer #1 Gas/Cycle versus Make up Air Temperature .................................... 38
Figure 15: Site #3, Dryer #1 Gas/Cycle versus Make up Air Temperature .................................... 39
Figure 16: Site #4, Dryer #1 Gas/Cycle versus Make up Air Temperature .................................... 40
Figure 17: Site #5, Dryer #1 Gas/Cycle versus Make up Air Temperature .................................... 42
Figure 18: Site #5, Dryer #2 Gas/Cycle versus Make up Air Temperature .................................... 42
Figure 19: Site #6, Dryer #1 Gas/Cycle versus Make up Air Temperature .................................... 43
Figure 20: Site #6, Dryer #2 Gas/Cycle versus Make up Air Temperature .................................... 44

Advanced Commercial Clothes Dryer Technologies Field Test
Gas Technology Institute                                                                                                                    3
List of Tables
Table 1. Summary Results Long-Term Monitoring............................................................................... 2
Table 2. Summary Results Standard Testing ......................................................................................... 3
Table 3: Site List ........................................................................................................................................ 10
Table 4: Data Collection Monitoring Equipment................................................................................. 12
Table 5: May 2016 Modulating Dryer Standard Test Loads .............................................................. 13
Table 6: August 2016 All Four Mode Standard Test Loads ............................................................... 14
Table 7: Test Dates ................................................................................................................................... 15
Table 8: Modulating Valve Long Term Monitoring Results .............................................................. 18
Table 9: Modulating Valve Short-Term, Standardized Testing Annualized Results Test #1 (May
2016) ........................................................................................................................................................... 19
Table 10: Modulating Valve Short-Term, Standardized Testing Annualized Results Test #2
(August 2016) ............................................................................................................................................ 20
Table 11: Moisture Sensor Long Term Monitoring Results ............................................................... 21
Table 12: Moisture Sensor Short-Term, Standardized Testing Annualized Results....................... 22
Table 13: Moisture Sensor and Modulating Valve Long Term Monitoring Results....................... 24
Table 14: Laundromat Long Term Savings Across All Technologies ............................................... 24
Table 15: OPL Long Term Savings Across All Technologies on Two dryers .................................. 24
Table 16: Moisture Sensor and Modulating Valve Short-Term, Standardized Testing Annualized
Results........................................................................................................................................................ 25
Table 17: Laundromat Standard Test Savings Across All Technologies .......................................... 25
Table 18: OPL Standard Test Savings Across All Technologies on 2 Dryers .................................. 25
Table 19: Estimated Annual Therm Savings across the State of MN................................................ 28
Table 20: Data Collection Monitoring Equipment............................................................................... 34
Table 21: Site #1 Summary Data ............................................................................................................ 36
Table 22: Site #2 Dryer #1 Summary Data ........................................................................................... 38
Table 23: Site #3 Dryer #1 Summary Data ........................................................................................... 39
Table 24: Site #4 Summary Data ............................................................................................................ 40
Table 25: Site #5 Summary Data ............................................................................................................ 41
Table 26: Site #6 Summary Data ............................................................................................................ 43

Advanced Commercial Clothes Dryer Technologies Field Test
Gas Technology Institute                                                                                                                                          4
Executive Summary

Background
Commercial gas dryer technology has not changed much over the last several decades. While the
majority of residential gas fired dryers have moisture sensors, only a select few commercial models are
sold with moisture sensors. In addition, dryers with modulating capabilities are more common within
the largest, industrial class of dryers (250 lbs. capacity or greater) given the efficiency gains from their
heavy usage and the relatively modest additional cost of this functionality compared to the overall dryer
cost. But again, this functionality has generally not been brought into commercially sized dryers.

It is difficult at times for facilities to approve the expensive purchase of a new dryer, which is why you
tend to see a lot of old dryers that have been continually repaired. It is a lot less expensive to retrofit an
existing dryer with a new technology to improve the efficiency. The goal of this project is to install and
monitor both a modulating dryer and a moisture sensor retrofit technology for commercial clothes
dryers. The Self Propelled Scientific DrySmart mositure sensor saves gas and electricity by determining
when the load is done and stopping the dryer before the load is over dried and more energy is wasted.
The Bio-Therm modulating technology saves energy throughout the drying cycle by reducing the firing
rate around a flue temperature sensor when less heat is needed. This wastes less heat out the flue and
improves the dryer efficiency. Both of these retrofit technologies were only available from these
manufacturers at the time of this study.

Five test sites composed of laundromats, hotels, healthcare, and dry cleaners, were sought, testing a
total of 12 dryers. Baseline dryers were monitored along with the modulating technology on its own, the
moisture sensor on its own, and both technologies operating together. The energy use before and after
each system installation was monitored, including both gas and electricity usage. The final goal was to
work with our partner utility CenterPoint Energy (CPE) to use the data to create a prescriptive rebate for
the advanced dryer technologies. Both of these energy saving technologies – moisture sensors and
modulation – were proposed for the field test to determine if they could offer a low cost retrofit option
at $200-500 (moisture sensor) and $525 (modulating dryer) per dryer, with payback periods expected in
the 1-3 year range depending on the usage, dryer size, and application.

The target market for these new technologies is the commercial sector, specifically laundromats, dry
cleaners, hospitality, and healthcare facilities. Additionally, any other facilities with on-premise laundry
(OPL) may be a suitable fit, such as gyms or even multi-family housing. These facilities often have
commercial dryers sized between 30 and 250 lbs. It was anticipated, based on limited data, that both
technologies could each save 10-30% of the dryer gas energy use.

Advanced Commercial Clothes Dryer Technologies Field Test
Gas Technology Institute                                                                                         1
Results
Table 1 below summarizes the overall results from this demonstration pilot. This included 12 dryers that
had only the modulating valve installed and 6 dryers that had the moisture sensor and modulating
technology installed (with at least two months of monitoring per technology, referred to here as long-
term monitoring). Table 2 summarizes results of the standard load testing for all of the technologies. For
the modulating valve, the standard test results are averaged across all 12 sites.

An early finding from the study was that the moisture sensor and modulating dryer valve do not work
well together and result in increased energy use under normal installation conditions. The modulating
valve caused the dryer heat to cycle off a lot less frequently as it dropped to low firing rate. This led the
moisture sensor to not see as many heat cycles or be able to determine when the clothes were dry. In
addition, when setting up the moisture sensor, the dryer programming is changed to a longer base run
time to eliminate loads stopping that were not dry with the dryer previously. The intent is that this
allows DrySmart to stop the dryer when the load is dry; the dryer does not run for the full base run time.
If the moisture sensor is working properly this will eliminate nuisance rerun of loads that are not
completely dry. With the moisture sensor not operating properly however, due to the presence of the
modulating technology, it leads to increased drying and energy usage.

                               Table 1. Summary Results Long-Term Monitoring
                                                             Annual      %       Annual
                                              % Gas         Savings   Electric   Savings    Cost     Payback
                                             Savings        (Therm)   Savings     (kWh)    Savings   (Years)

      Modulating Valve (12 dryers)            12.3%          161         0         0       $101.73    5.16

      Moisture sensor –
                                              2.5%            28         0         0       $17.75    11.26
      Laundromats (4 dryers)

      Moisture Sensor – OPL (2
                                              30.9%          552      42.5%       560      $403.20    1.24
      dryers)

      MV&MS – Laundromats (4
                                              14.3%          160         0         0       $101.01    7.18
      dryers)

      MV&MS – OPL (2 dryers)                  19.2%          303      18.0%       236      $213.94    4.79

Advanced Commercial Clothes Dryer Technologies Field Test
Gas Technology Institute                                                                                       2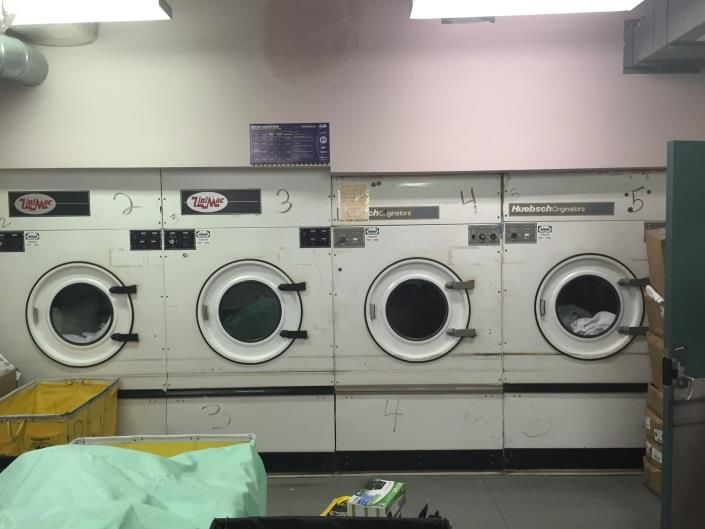
Table 2. Summary Results Standard Testing

                                                             Annual       %       Annual
                                                % Gas       Savings    Electric   Savings    Cost      Payback
                                               Savings      (Therm)    Savings     (kWh)    Savings    (Years)

     Modulating Valve (12 dryers)               14.5%        189          0         0       $119.24      4.4

     Moisture sensor –
                                                  3.7%          42        0         0       $17.75      7.64
     Laundromats (4 dryers)

     Moisture Sensor – OPL (2
                                                14.4%        199        8.9%       117      $137.25     3.64
     dryers)

     MV&MS – Laundromats (4
                                                17.9%        201          0         0       $126.60     5.73
     dryers)

     MV&MS – OPL (2 dryers)                    -25.3%        -350      -55.9%      -736     -$293.10   Never

    Cost Assumptions:
    Installed cost per dryer for OPL MS:                 $499
    Installed cost per dryer for Laundromat MS:          $200
    Installed cost per dryer for modulating valve:       $525
    Natural Gas cost per therm:                          $0.63/therm
    Electricity cost per kWh:                            $0.0988/kWh

GTI determined it is possible to install them together if the dryer cycle timing is not changed. This would
eliminate wasted energy of added drying time if the moisture sensor does not realize it should end the
cycle, but still potentially allow it to stop early for small loads. This would lose the added benefit of the
moisture sensor eliminating not completely dry loads needing reruns from standard operation. It would
essentially provide all the benefits of the modulating valve technology while still potentially saving
additional energy on loads that are extremely over dried. The technologies could also potentially work
together if the moisture sensor manufacturer changes its programming to recognize a dry load under
modulating valve conditions, but it doesn’t sound like they are interested in doing that in the near
future. For this demonstration, the standard testing results were conducted with normal installation of
the moisture sensor in the combined mode, but the cycle settings were changed back to baseline for the
long-term monitoring of both technologies.

GTI conducted long-term monitoring for both technologies with at least two months in baseline
operation mode and two months in technology monitoring modes, and a one-time standard load test
where GTI dried the exact same load in each of the dryers. The pilot demonstrated 552 therms on
average of annualized gas savings as well as 560 kWh electricity per dryer resulting from the retrofit of
the tested moisture sensor technology for On Premise Laundry (OPL) on two dryers. OPL locations

Advanced Commercial Clothes Dryer Technologies Field Test
Gas Technology Institute                                                                                         3
showed much better savings than the laundromat locations. For laundromat locations, the Drysmart
continues to run for the full paid time, but it runs the burners less frequently. It is important in the
laundromat location that a customer gets the full drying time they paid for since they pay for a specific
amount of drying time. It still saved 28 therms of gas annually. The tested modulating valve
demonstrated 161 therms on average across all of the 12 dryers tested. The gas savings appeared to be
more dependent on the number of cycles (loads of laundered items that are dried and the resulting gas
use) instead of the dryer size. For implementation as a measure in an energy efficiency program, it may
make the most sense to provide a flat rebate per dryer based on the average gas savings as opposed to
a rebate based on the capacity of the dryer.

It should be noted that the annual usage of these dryers is quite a bit lower than GTI has seen in similar
testing in the Chicago area. Annual usage between 2,000-4,000 therms per dryer were seen across test
sites at hotels, laundromats and healthcare sites in past testing activities. The lower usage seen in these
test sites, especially the extremely low usage seen at two laundromat dryers and the university, leads to
lower annual savings and thus longer payback periods. GTI believes the savings of 12.3% found across all
of the sites will translate to more than 161 therms on average at most sites. The 30.9% gas savings and
40.3% electric savings found on only two OPL dryers for the moisture sensor, which equates to 552
therms, is probably higher than can be expected across a greater number of sites. If the numbers are
averaged with four dryers from a Nicor Gas study in the Chicago area it would result in 21.7% savings.

The two technologies installed together can actually result in greater energy use if installed according to
normal installation procedures by changing the cycle setting on the OPL dryers, but if that setting is not
changed on the dryer or with laundromats where the cycle is never changed, the two technologies can
be installed together. The limited testing did not show additional savings on two OPL dryers, but did
show some additional savings potential in laundromats. However, the higher installation cost of
installing two technologies doesn’t appear to be offset by the small increase in energy savings.

For conservative market estimating purposes, data was pulled from the Census Bureau 2012 County
Business Patterns to determine the number of residential healthcare facilities (senior living, etc.), hotels
and motels, dry cleaning and laundry services and laundromats in the state of Minnesota. As of 2012,
there were 3,315 nursing and residential healthcare facilities, 860 hotels and motels (excluding casino
hotels), 209 non-coin operated dry cleaning and laundry services, and 98 coin operated laundry services.
It is assumed that two dryers are located at each facility with the exception of laundromats which are
assumed to have 16 dryers each. This represents an opportunity of 10,336 dryers in Minnesota to use
these technologies. Annual savings of 160 therms at a 40% adoption rate would produce 662,000
therms of savings and 550 therms at a 40% adoption rate would produce 2.27 million therms of savings.
The Nicor Gas study of 11 dryers using the modulating technology produced 333 therms of savings on
average and the Nicor Gas study of the moisture sensor at four OPL locations showed 460 therms of
savings on average. Based on all of the studies, GTI believes annual savings in the 300 - 350 therm range
is a good estimate for these technologies, which would translate to 1.2-1.5 million therms saved in the
state of Minnesota at a 40% adoption rate.

Advanced Commercial Clothes Dryer Technologies Field Test
Gas Technology Institute                                                                                    4
Project Background

Project Overview
The purpose of the project was to determine the energy savings and payback period for modulating
dryer technology, moisture sensor technology and both technologies operating together, across a
variety of test sites and dryer sizes. Additionally, we will work with our partner utility CenterPoint Energy
(CPE) to use the data to create a prescriptive rebate for the advanced dryer technologies.

Dryer Technology
Commercial gas dryer technology has not changed much over the last several decades. While the
majority of residential gas fired dryers have moisture sensors, only a select few commercial models are
sold with them. Dryers with modulating capabilities are more common within the largest, industrial class
of dryers (250 lbs. capacity or greater) given the efficiency gains from their heavy usage and the
relatively modest additional cost of this functionality compared to the overall dryer cost. However, this
functionality has generally not been included in commercially sized dryers. Both of these energy-saving
technologies were proposed for this field test to determine if they could offer a low cost retrofit option
at $200-500 for the moisture sensor and $525 for the modulating dryer per dryer, with payback periods
of 1-3 years, depending on the usage, dryer size, and application.

In general, at the start of a dryer cycle the dryer heat will run for a long time before it starts to cycle
more and more as clothes become dry. This emerging moisture sensor retrofit technology comes as a kit
that monitors the dryer cycling throughout the drying process and determines when the clothes are dry
based on cycle timing to stop the load before additional energy is used. For the modulating valve, it
saves energy by reducing the firing rate when less heat is needed. It cycles between low and high fire
around a programmed flue temperature that it monitors. This wastes less heat out the flue and
increases the overall efficiency of the dryer.

Site Selection
GTI installed monitoring equipment and the retrofit technologies at six field test sites. Pilot sites
included two hotels (2 - 75 lb. dryers, 2 – 120lb dryers), one healthcare facility (2 - 75 lb. dryer), one
university (1 - 75 lb. dryers), one dry cleaner (1- 50 lb. dryer) and one laundromat (2 - 45 lb. dryers, 2-30
lb. dryers). These types of sites were selected as they are the most prominent users of on premise
laundry (OPL) and laundromat dryers and provided a good mix of industries, dryer sizes and usage
patterns. In all, 12 dryers were monitored. The plan was initially to monitor both technologies on all of
the dryers, but the moisture sensor manufacturer changed their company policy in the middle of the
demonstration and decided they could no longer install their technology on mechanical timer dryers,

Advanced Commercial Clothes Dryer Technologies Field Test
Gas Technology Institute                                                                                        5
which included 6 of the 12 selected dryers. Therefore, the moisture sensor technology was only installed
on the four laundromat dryers, one of the 75 lb. hotel dryers and the 50 lb. dry cleaner dryer.

Monitoring
GTI conducted monitoring for at least two months in four phases: baseline, modulating valve, moisture
sensor, and both together. In addition, GTI conducted a standard load test at each site where the dryers
were operated in baseline, modulating valve, moisture sensor and both together modes drying the exact
same load of laundry.

Previous Study Results
The modulating valve and moisture sensing technologies have been studied in the Nicor Gas service
territory. In 2015, modulating technology was tested at six test sites, in 11 dryers, showing 13.7% energy
savings. This study led to its inclusion in the Illinois state technical reference manual and an eventual
prescriptive rebate by Nicor Gas in its service territory. The moisture sensor technology was also
demonstrated in Nicor Gas territory, with a report released in May 2017. The demonstration found
across four dryers that the moisture sensor saved 17.1% of natural gas compared to baseline. This study
also tried applying both technologies to three dryers but found that the energy usage actually increased.
The study found that the modulating technology caused less cycling on and off of the dryer as it reduced
to a lower firing rate. The moisture sensor, therefore, wasn’t able to determine when the clothes were
dried based on the cycling pattern of the dryer. This, in addition to the fact that the cycles are setup to
run longer with the moisture sensor to keep clothes from stopping when they are still slightly wet, can
lead to additional energy usage.

Technology and Market Overview
Moisture Sensors
Many commercial dryers offer moisture sensors on their models, but many still do not. Most dryers
already in the field will not have a moisture sensor. This moisture sensor retrofit technology for
commercial dryers appears to be available only from Self Propelled Scientific LLC at this time (Figure 1).
This technology allows a site to change a standard dryer to use a moisture sensor for a cost of $499 per
dryer for On-Premise Laundry (OPL) and $200 per dryer for laundromats. It can be installed in
approximately 10 minutes. Savings in the 20-25% range on gas use are expected as well as similar
savings in electric use. A potential barrier to the adoption of this technology is likely to be helping sites
identify whether their dryers do or do not have moisture sensors already. However, the manufacturer’s
experience indicates many customers still purchase DrySmart units even if they have factory installed
moisture sensors. They indicate that additional savings can be obtained over the manufacturer’s
moisture sensor.

Advanced Commercial Clothes Dryer Technologies Field Test
Gas Technology Institute                                                                                        6
Figure 1: DrySmart RMC Technology

Modulating Technology
At this time, modulating dryer technology is a retrofit technology only available from EZ-Efficiency
(Figure 2). However, new modulating dryers are becoming available directly from some dryer OEMs in
the very large commercial or industrial markets (>250 lb capacity dryers), but at relatively high
equipment cost. Although gas modulation has been around for decades in various appliances such as
boilers and furnaces, and the technology itself is very mature, its application in clothes dryers is a more
recent trend.

                            Figure 2: EZ Efficiency BIO-Therm Dryer Modulating Kit

GTI estimates that the investment of $200-$525 per dryer for the installed cost of each of these
technologies will be paid back in less than 2-3 years. Therefore, widespread market adoption could be
achieved based on these economics alone. After installation, the technology should not require any
incremental maintenance by the end user for the life of the dryer. However, installation would most
likely occur after the original warranty coverage has expired since both these retrofits could void the
dryer manufacturer’s warranty if installed. Retrofitting of dryers is a common practice and both

Advanced Commercial Clothes Dryer Technologies Field Test
Gas Technology Institute                                                                                      7
installations are non-invasive and completely reversible. Most warranties usually cover only the first three years, so the typical commercial dryer life expectancy of 10 to 20 years (depending on duty cycles and maintenance levels) still provides ample time for an attractive return on investment. However, there are significant barriers to the adoption of these technologies due to their emerging status, retrofit nature, and uncertain standard/code treatment. Most end users in the commercial/institutional laundry sector have never seen a conversion technology like this before. They may be hesitant to adopt it given the lack of familiarity as well as the uncertainty regarding the technology and its ability to provide the intended gas and electric savings for their dryers. DrySmart uses patent pending software to accurately determine laundry moisture content with no added probes or sensors. Traditional moisture sensors use a conductivity strip in the drum where the wet clothes will contact the strip, complete the circuit and let the dryer know that additional drying is still required. This technology just connects to the existing controls and overrides them when needed at the end of the cycle. Advanced Commercial Clothes Dryer Technologies Field Test Gas Technology Institute 8
Objective
The objective of this study was to determine the energy savings and payback period for the modulating
dryer technology, the moisture sensor technology and both operating together across a variety of test
sites and dryer sizes. The final goal will be to work with our partner utility CenterPoint Energy (CPE) to
use the data to create a prescriptive rebate for the advanced dryer technologies.

Advanced Commercial Clothes Dryer Technologies Field Test
Gas Technology Institute                                                                                     9
Methodology
Experimental Design and Procedure
A total of six field test sites and 12 dryers were monitored. Pilot sites included two hotels (2 - 75 lb, 2
120 lb. dryers), one healthcare facility (2 - 75 lb. dryer), one university (1 - 75 lb. dryers), one dry cleaner
(1- 50 lb. dryer) and one laundromat (2 - 45 lb. dryers, 2-30 lb. dryers). Table 3 lists the six pilot sites and
the dryers that were monitored at each site.
The gas and electric usage of the dryer, number of cycles, and dryer room makeup air temperature were
monitored. The data was collected by a Logic Beach data logger, which recorded the energy usage, cycle
count, and temperature at minute intervals. GTI accessed the data remotely with a cell modem to
download datasets and look at sensor readings in real time. GTI conducted at least two months of
monitoring for each phase of the monitoring including baseline, modulating valve, moisture sensor and
both working together.
Site Installation and Commissioning Requirements
The selected sites were required to meet the following criteria:
site is representative of the target markets for this technology
site included gas-fired commercial clothes dryers
site owners/operators allow dryer retrofits and installation of data acquisition equipment for
baseline and modulating dryer monitoring periods
Table 3: Site List
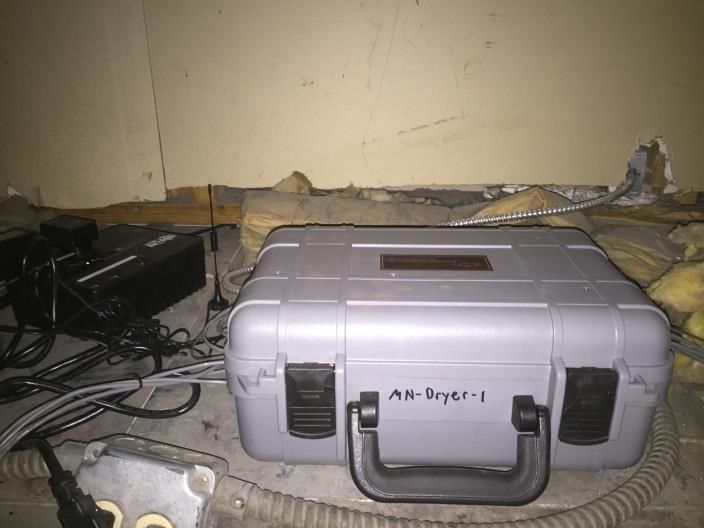
Site Category Dryer #1 Dryer #2 Dryer #3 Dryer #4
Speed Queen Speed Queen Speed Queen Speed Queen
MN-Dryer-1 Laundromat 45lb Dryer - 45 lb Dryer - 30 lb Dryer - 30 lb Dryer -
STT45NBCG2G2 STT45NBCG2G2 STT30NNRB2G1 STT30NNRB2
W05 , W05 , W011, G1W011,
195,000 Btu/hr, 195,000 Btu/hr, 146,000 Btu/hr, 146,000
Btu/hr,
Cissell
MN-Dryer-2 Dry Cleaner 50lb Dryer
CT050NRDF6G1
W02,
120,000 Btu/hr
Advanced Commercial Clothes Dryer Technologies Field Test
Gas Technology Institute 10Site Category Dryer #1 Dryer #2 Dryer #3 Dryer #4
Huebsch
MN-Dryer-3 University JT75CG,
75lb Dryer
165,000 Btu/hr
UniMac – UniMac –
MN-Dryer-4 Hotel #1 75lb Dryer 75lb Dryer
ADG75D, ADG75D,
200,000 Btu/hr, 200,000 Btu/hr,
Huebsch Huebsch
MN-Dryer-5 Healthcare- 75lb Dryer 75lb Dryer
Nursing JT75CG, JT75CG,
Home 165,000 Btu/hr 165,000 Btu/hr
Huebsch – Huebsch – model
MN-Dryer-6 Hotel #2 model #JT120FG #JT120FG
300,000 Btu/hr 300,000 Btu/hr
Analytical Methods
In baseline mode, the gas usage was calculated by monitoring the dryer gas valve on time with a current
switch and multiplying by the nameplate firing rate of the dryer. For dryers with the modulating retrofit
kit valve both the high fire and low fire on times were monitored with separate current switches. The
low firing rate was determined by measuring the manifold pressure setting of the gas valve with a digital
manometer and using the following flow calculation:
New (Low) Firing Rate (Btu/hr) QN = QO * √ ( PN/PO)
Where QN = Low Firing Rate (Btu/hr)
QO = High Firing Rate (Btu/hr)
√ = Square Root
PN = Low Firing Rate Manifold Pressure (inch water column – “WC)
PO = High Firing Rate Manifold Pressure (inch water column – “WC)
A diagram of the monitoring equipment is provided in Figure 3 and a list of the instrumentation is
provided in Table 4. Referring to Figure 3, two current switches were used to monitor the retrofitted
modulating (low and high fire) gas valve. The makeup air temperature in the dryer room was monitored
with a thermocouple to allow comparisons between baseline and modulating monitoring data at similar
dryer room makeup air temperatures. Data collected at a lower makeup air (lower outdoor air)
temperature will show a higher gas use for the dryer because of the greater heat input needed to bring
the air to the appropriate drying temperature.
Advanced Commercial Clothes Dryer Technologies Field Test
Gas Technology Institute 11Figure 3: Data Collection Monitoring Diagram
T
W
Dryer
W Watt Meter
AC
CS
CS Current Switch
Gas Dryer
Gas Inlet T Temperature
GV
Table 4: Data Collection Monitoring Equipment
Sensor Description Equipment Manufacturer/ Model Accuracy
T Dryer room Thermocouple Omega / 5TC-TT-T-24-72 ± 1 oF
makeup air temp
W Dryer electric use Watthour Continental Controls/ WNB-3D-240-P ± 1%
Meter
CS1 Dryer gas use – Current Setra/ CSCGFN015NN -
Switch
Data Records and sends Intellilogger Logic Beach / IL-80
Logger data for dryers
Cell Connects logger Cell Modem Sierra Wireless / Raven XE
Modem to internet
Advanced Commercial Clothes Dryer Technologies Field Test
Gas Technology Institute 12Long-Term Monitoring
For long-term monitoring, the percent gas savings was determined for each dryer by comparing gas use
of the baseline dryer operation to modulating valve and moisture sensor dryer operation. Data was
summarized into daily averages and these were averaged across the whole monitoring period of at least
two months. If the ambient temperature in the dryer room didn’t vary much, a direct comparison can be
made. If there were large swings in the ambient air temperature as the outdoor weather changed then
the daily average gas use per cycle was plotted versus the ambient temperature in the dryer room to
produce a trend which can then be normalized to compare each technology to the baseline. Once the
percent gas savings was determined, an annual therm savings was estimated for each individual dryer
based on the gas use and number of cycles seen in the long-term monitoring, which were extrapolated
to a full year of operation.
Short-Term Monitoring
In addition to the long-term monitoring, a more standardized, short-term test was also conducted
where the exact same load of laundry was washed and dried twice, once in baseline dryer mode and
once in modulating dryer mode. This standardized short-term test happened in May 2016 when the
modulating valves were installed. Although the load was washed in the exact same washer, there is still
some variance in the moisture content of the clothes between each drying. This was accounted for by
measuring the BTUs of natural gas used per pound of water moisture removed during the drying
process. The clothes were weighed before and after drying in each mode. The load size was varied with
each dryer and its respective capacity. Loads that were being laundered at the time of the short-term
test were just washed again. The loads dried in the standard test for the modulating dryer test are
provided in Table 5. Once the percent gas savings was determined from this short-term test, an annual
therm savings was estimated based on the number of dryer cycles from the long-term monitoring
annual gas usage calculation.
Table 5: May 2016 Modulating Dryer Standard Test Loads
Site Category Dryer #1 Dryer #2 Dryer #3 Dryer #4
MN-Dryer-1 Laundromat 15.5 lb wet, 15.3 lb wet, 28.7 lb wet, 28.2 lb wet,
10 lb dry 9.5 lb dry 14.8 lb dry 15 lb dry
Towels Towels Towels Towels/Clothes
MN-Dryer-2 Dry Cleaner 48.3 lb wet,
35.2 lb dry
Uniforms
Advanced Commercial Clothes Dryer Technologies Field Test
Gas Technology Institute 13Site Category Dryer #1 Dryer #2 Dryer #3 Dryer #4
MN-Dryer-3 University 34 lb wet,
15.3 lb dry
Towels
MN-Dryer-4 Hotel #1 55.1 lb wet, 51.6 lb wet,
41.7 lb dry 39.2 lb dry
Sheets Sheets
MN-Dryer-5 Healthcare- 50.0 lb wet, 60.8 lb wet,
Nursing
22.2 lb dry 27.2 lb dry
Home
Towels Towels
MN-Dryer-6 Hotel #2 65.9 lb wet, 66.6 lb wet,
40.9 lb dry 40.8 lb dry
Towels Towels
A standardized, short-term test was also conducted in August 2016 where the exact same load of
laundry was washed and dried four times, once in baseline mode, modulating mode, moisture sensor
mode and both technologies together on all 6 dryers that had a moisture sensor installed. The loads
dried in the standard test for all 4 modes of operation in August 2016 are provided in Table 6. Once the
percent gas savings was determined from this short-term test, an annual therm savings was estimated
based on the number of dryer cycles from the long-term monitoring annual gas usage calculation.
Table 6: August 2016 All Four Mode Standard Test Loads
Site Category Dryer #1 Dryer #2 Dryer #3 Dryer #4
MN-Dryer-1 Laundromat 15.2 lb wet, 13.2 lb wet, 23.5 lb wet, 27.4 lb wet,
9.7 lb dry 8.5 lb dry 14.6 lb dry 14.0 lb dry
Towels Towels Towels Towels
MN-Dryer-2 Dry Cleaner 25.8 lb wet,
20.2 lb dry
Uniforms
MN-Dryer-4 Hotel 51.0 lb wet, 50.0 lb wet,
33.1 lb dry 33.6 lb dry
Towels Towels
Advanced Commercial Clothes Dryer Technologies Field Test
Gas Technology Institute 14Results
Installation and Commissioning
Per the monitoring equipment listed in Table 4, Egan Company, a local HVAC and plumbing contractor,
installed electric meters at the pilot sites and GTI staff installed the current switches and thermocouples.
GTI staff connected all of the sensors to the data logger. Installation dates and monitoring periods for
each of the technologies at all of the test sites are provided in Table 7. Pictures of the dryers at all six
sites are provided in Figure 4 through Figure 9.
Table 7: Test Dates
Site Category Baseline Modulating Moisture Sensor Both MS &MV
MN-Site-1 Laundromat 2/25/16 - 5/4/16 5/5/16 - 7/31/16 8/3/16 - 11/13/16 11/15/16 -
6/17/17
MN-Site-2 Dry Cleaner 3/2/16 - 5/2/16 5/4/16 – 7/30/16 8/4/16 – 11/13/16 11/15/16 – 6/3/17
MN-Site-3 University 2/25/16 - 5/3/16 5/5/16 – 5/2/17 - -
MN-Site-4 Hotel #1 2/24/16 – 5/3/16 #1: 5/5/16 - #1: 8/2/16 - #1: 11/15/16-
7/31/16 11/13/17 6/21/17
#2: 5/5/16 - #2: - #2: -
6/21/17
MN-Site-5 Healthcare- 2/25/16 - 5/2/16 5/4/16 – 6/21/17 - -
Nursing
Home
MN-Site-6 Hotel #2 2/25/16 - 5/1/16 5/3/16 – 5/2/17 - -
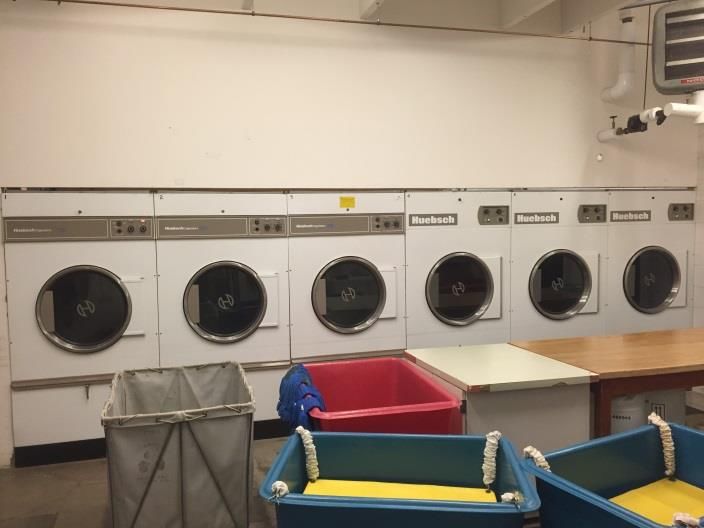
Figure 4: Site #1 –Laundromat - 2-Speed Queen 30 lb. Dryers, 2- Speed Queen 45 lb. Dryers
Advanced Commercial Clothes Dryer Technologies Field Test
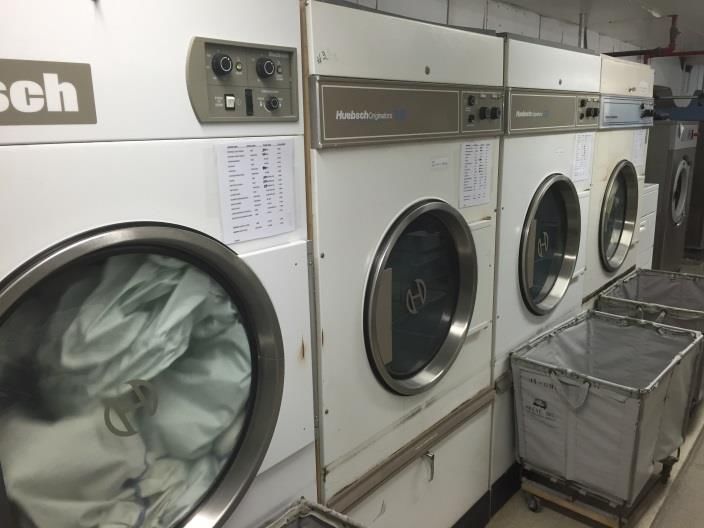
Gas Technology Institute 15Figure 5: Site #2 – Dry Cleaner - Cissell 50 lb. Dryer
Figure 6: Site #3 - University - 1-75 lb. Huebsch Dryer
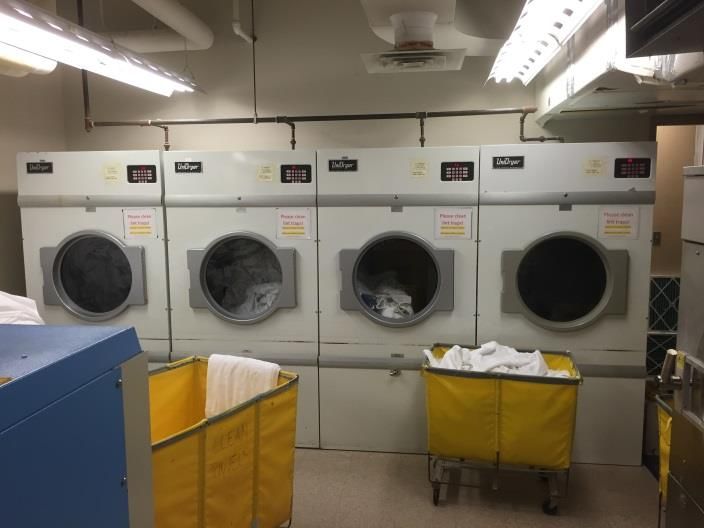
Figure 7: Site #4 - Hotel – 2- 75 lb. UniMac Dryers
Advanced Commercial Clothes Dryer Technologies Field Test
Gas Technology Institute 16Figure 8: Site #5 – Healthcare - 2 – 75 lb. Huebsch Dryers
Figure 9: Site #6- Hotel - Two Huebsch 120 lb. Dryers (Labeled #4 and #5 in Picture)
Energy Savings and Economic Performance
The field demo was conducted in three modes of operation; with the modulating valve alone; with the
moisture sensor alone; and with both technologies operating together. The results below are separated
into sections for each phase of the demonstration.
Modulating Valve Results
Table 8 shows the annualized results from the long-term monitoring of all 12 dryers at the six pilot sites
for the modulating valve compared to baseline. GTI determined the savings by comparing monitored
data from at least two months of baseline dryer operation and at least two months of modulating dryer
operation. For sites that only had the modulation technology installed the monitoring of the modulating
Advanced Commercial Clothes Dryer Technologies Field Test
Gas Technology Institute 17technology was around one complete year. Sites that showed a variance in energy usage with makeup
air dryer room temperature as the outdoor weather changes were corrected for the variance in the data
analysis.
Table 8: Modulating Valve Long Term Monitoring Results
Annual Annual MV % Savings Annual Annual Cost Payback
Baseline Gas Gas Use Savings Savings ($) Period
Use (Therm) (Therm) (Therm) (Years)
Laundromat
Dryer #1 1,522 1,291 15.19% 231 $145.65 3.60
Dryer #2 688 600 12.76% 88 $55.31 9.49
Dryer #3 1,672 1,352 19.16% 320 $201.78 2.60
Dryer #4 604 452 25.08% 151 $95.39 5.50
Dry Cleaner
Dryer #1 781 794 -1.75% -14 -$8.62 Never
University
Dryer #1 501 463 7.65% 38 $24.15 21.74
Hotel #1
Dryer #1 1,516 1,232 18.70% 283 $178.52 2.94
Dryer #2 1,865 1,588 14.84% 277 $174.37 3.01
HealthCare
Dryer #1 1,516 1,265 16.55% 251 $158.06 3.32
Dryer #2 1,191 1,037 12.93% 154 $97.04 5.41
Hotel #2
Dryer #1 1,995 1,931 3.22% 64 $40.46 12.98
Dryer #2 3,057 2,964 3.05% 93 $58.71 8.94
Average 1,409 1,247 12.28% 161 $101.73 5.16
Overall, the results show an average, annualized gas savings per dryer of 12.3%, equating to 161 therms.
At $0.63/therm cost for gas according to 2016 EIA Pricing Data for Minnesota1, that yields $102 in
annual cost savings and a 5.16 year payback at an installed cost of $525 for the modulating dryer retrofit
technology. It should be noted that the annual usage seen in these tested dryers is quite a bit lower than
GTI has seen in similar testing in the Chicago area. Annual usage in the 2,000-4,000 therms per dryer
were seen across test sites at hotels, laundromats and health care sites in that testing. The lower usage
seen in these test sites, especially the extremely low usage seen at two laundromat dryers and the
university leads to lower annual savings and longer payback periods. The 12.3% finding for this
modulating dryer technology is very similar to 13.8% found on this modulating technology in the Nicor
1
US Energy Information Administration, 2016 MN Natural Gas Prices
(https://www.eia.gov/dnav/ng/ng_pri_sum_dcu_SMN_a.htm)
Advanced Commercial Clothes Dryer Technologies Field Test
Gas Technology Institute 18Gas Emerging Technology Program testing2. That 12.3% savings will translate to a much quicker payback
at higher usage sites.
Table 9 and Table 10 show the annualized results from the short-term, standardized testing that was
conducted at each site with the dryers operating in baseline and modulating dryer modes while drying
the exact same load of laundry.
Table 9: Modulating Valve Short-Term, Standardized Testing Annualized Results Test #1 (May 2016)
Annual Annual MV % Annual Annual Payback
Baseline Gas Gas Use Savings Savings Cost Period
Use (Therm) (Therm) (Therm) Savings ($) (Years)
Laundromat
Dryer #1 1,522 781 48.69% 741 $466.77 1.12
Dryer #2 688 568 17.52% 121 $75.96 6.91
Dryer #3 1,672 1,459 12.71% 212 $133.84 3.92
Dryer #4 604 467 22.67% 137 $86.20 6.09
Dry Cleaner
Dryer #1 781 738 5.45% 43 $26.83 19.57
University
Dryer #1 501 421 15.91% 80 $50.23 10.45
Hotel #1
Dryer #1 1,516 1,361 10.23% 155 $97.63 5.38
Dryer #2 1,865 1,748 6.23% 116 $73.22 7.17
HealthCare
Dryer #1 1,516 1,280 15.56% 236 $148.62 3.53
Dryer #2 1,191 1,147 3.72% 44 $27.92 18.80
Hotel #2
Dryer #1 1,995 1,851 7.25% 145 $91.13 5.76
Dryer #2 3,057 2,815 7.92% 242 $152.57 3.44
Average 1,409 1,220 14.49% 189 $119.24 4.40
The initial standard test conducted at all the sites (Table 9) was conducted in May 2016 when the
modulating dryer technology was installed. A second set of tests was conducted at all 3 sites that had
the moisture sensor technology installed in August 2016 (Table 10). On average, the results came in very
similar to long term testing, but slightly higher. Overall, the standard load single point test #1 on all 12
dryers showed annualized gas savings of 14.5%, equating to 189 therms of savings. At $0.63/therm cost
of gas, that yields $119 in annual cost savings and a 4.4 year payback at an installed cost of $525 for the
modulating technology. The second standard test conducted in August 2016 on 7 dryers at sites #1, #2
2
Scott, S, D Kosar, G. Cushman. 2014 “Nicor Gas Emerging Technology Program 1036: Commercial Dryer
Modulation Retrofit Public Project Report.”
Advanced Commercial Clothes Dryer Technologies Field Test
Gas Technology Institute 19and #4 showed very similar results with an average gas savings of 13.3% and 169 therms annually. This
equals $106 in annual savings and a 4.9 year payback.
Table 10: Modulating Valve Short-Term, Standardized Testing Annualized Results Test #2 (August
2016)
Annual Annual MV % Annual Annual Cost Payback
Baseline Gas Gas Use Savings Savings Savings ($) Period
Use (Therm) (Therm) (Therm) (Years)
Laundromat
Dryer #1 1,522 1,305 14.23% 217 $136.44 3.85
Dryer #2 688 649 5.65% 39 $24.50 21.43
Dryer #3 1,672 1,282 23.34% 390 $245.82 2.14
Dryer #4 604 491 18.66% 113 $70.94 7.40
Dry Cleaner
Dryer #1 781 694 11.09% 87 $54.56 9.62
Hotel #1
Dryer #1 1,516 1,377 9.16% 139 $87.49 6.00
Dryer #2 1,865 1,667 10.61% 198 $124.67 4.21
Average 1,409 1,066 13.25% 169 $106.34 4.94
Moisture Sensor Results
Initially GTI had cleared all 12 dryers selected for the field demo with the moisture sensor manufacturer
Self Propelled Scientific, but before installations they changed their company policy to no longer install
on mechanical timer dryers. Six of the 12 dryers in the test are mechanical timer dryers and six have
newer controls that work with Self Propelled Scientific’s new company policy. This change forced GTI to
only install the moisture sensor at the laundromat (site 1), the dry cleaner (site 2), and one of the two
dryers at hotel #1 (site 4). Table 11 shows the annualized results from the long term monitoring of all 6
dryers at Site #1, 2, and 4 for the moisture sensor compared to baseline. GTI determined the savings by
comparing monitored data from at least two months of baseline dryer operation and at least two
months of moisture sensor operation. Sites that showed a variance in energy usage with makeup air
dryer room temperature as the outdoor weather changed were corrected for the variance in the data
analysis.
The moisture sensor technology works differently for On Premise Laundry (OPL) sites and for
laundromat sites. For OPL, the technology stops the load as soon as it determines the load is dry. This
results in gas savings and electric savings by stopping the dryer before more energy is wasted after the
load is dry. It also improves the rate the staff can finish the laundry because they can then start the next
load rather than wait for the dryer to over dry the clothes further. With laundromats though the
customer pays for a specific amount of drying time and they expect to receive that amount of drying
Advanced Commercial Clothes Dryer Technologies Field Test
Gas Technology Institute 20time. If the dryer were to stop early the customer would be upset. Therefore, for laundromats the
moisture sensor technology does not provide electric savings, but it still provides gas savings by cycling
the gas on less frequently than the dryer would on its own. This keeps the clothes dryer feeling warm
and running and the customer happy while still providing gas savings.
Table 11: Moisture Sensor Long Term Monitoring Results
Annual Annual % Annual Annual Annual % Annual Annual Payback
Baseline MS Gas Savings Savings Baseline MS Savings Savings Cost Period
Gas Use Use (Therm) Electric Electric (kWh) Savings (Years)
(Therm) (Therm) (kWh) (kWh) ($)
Laundromat
Dryer#1 1,522 1,531 -0.60% -9 - - - - -$5.74 Never
Dryer #2 688 770 -11.94% -82 - - - - -$51.77 Never
Dryer #3 1,672 1,542 7.77% 130 - - - - $81.87 2.44
Dryer #4 604 530 12.27% 74 - - - - $46.66 4.29
Laundromat 1,121 1,093 2.51% 28 - - - - $17.75 11.26
Average
Dry Cleaner
Dryer #1 803 726 9.60% 77 830 615 25.89% 215 $69.78 7.15
Hotel #1
Dryer #2 1,965 938 52.28% 1,027 1,805 900 50.17% 906 $736.63 0.68
OPL Average 1,384 832 30.94% 552 1,318 757 42.53% 560 $403.20 1.24
Due to the difference between laundromat dryers and OPL dryers GTI calculated the savings of each of
those types of sites out separately. Four of the dryers tested were laundromat dryers at site #1, and only
two dryers were OPL dryers, one at the dry cleaner and one at hotel #1. Overall, at the laundromat the
results show an average, annualized gas savings per dryer of 2.51%, equating to 28 therms. At
$0.63/therm cost for gas, that yields $18 in annual cost savings and an 11.3 year payback at an installed
cost of $200 for the moisture sensor retrofit technology. For the two OPL dryers, the average annualized
gas savings was 30.9%, with 10% savings at the dry cleaner and 52% savings at the hotel. The 30.9%
savings translates to 552 therms annually. The electric savings were 43% averaged at the two sites,
which equates to 560 kWh. The combined annual cost savings is $403 annually at $0.63/ therm and
$0.0988/kWh according to 2016 EIA data for Minnesota. This produces a 1.2 year payback on the $499
installed cost for OPL dryers.
The savings for the hotel seem extremely high and taking a closer look at the data seemed to show a
large number of short cycles. During baseline the hotel site averaged 7.1 cycles per day at 48 minutes of
run time per cycle. During the moisture sensor monitoring period the dryer averaged 13.1 cycles per day
and 24 minutes per cycle. It is possible that the site was busier and ran more loads during the moisture
sensor test, but it is also possible that the site had some cycles needing to be re-run due to the load not
being dry. There are so many variables with dryer loads including remaining moisture content of the
Advanced Commercial Clothes Dryer Technologies Field Test
Gas Technology Institute 21load, type of load being dried, size of the load and more that there will be a lot of variability in results. It
is possible that this site was just really over drying loads, which led to the large savings. Even if you
assume the site had the same daily loads as the baseline period, the modulating technology would still
have saved 11% over baseline. The 30.9% gas and 40.3% electric savings for this modulating dryer
technology is quite a bit higher than the 17.1% gas and 15.1% electric found on this moisture senor
technology in the Nicor Gas Emerging Technology Program testing3 across four OPL test sites. Only
having two test sites, one having very high savings, really pushed the average savings up. If all six sites
(four in Nicor Gas and two in Minnesota) were averaged it would translate to 21.7% gas savings which
appears to be a reasonable number for this technology. The more data that is included in the average,
the more accurate the savings number becomes.
Table 12: Moisture Sensor Short-Term, Standardized Testing Annualized Results
Annual Annual % Annual Annual Annual % Annual Annual Payback
Baseline MS Gas Savings Savings Baseline MS Savings Savings Cost Period
Gas Use Use (Therm) Electric Electric (kWh) Savings (Years)
(Therm) (Therm) (kWh) (kWh) ($)
Laundromat
Dryer#1 1,522 1,470 3.39% 52 - - - - $32.49 Never
Dryer #2 688 736 -6.97% -48 - - - - -$30.20 Never
Dryer #3 1,672 1,513 9.50% 159 - - - - $100.05 2.00
Dryer #4 604 600 0.62% 4 - - - - $2.35 85.12
Laundromat 1,121 1,080 3.70% 42 - - - - $26.17 7.64
Average
Dry Cleaner
Dryer #1 803 755 5.98% 48 830 831 -0.19% -2 $30.12 16.57
Hotel #1
Dryer #2 1,965 1,614 17.85% 351 1,805 1,569 13.09% 236 $244.38 2.04
OPL Average 1,384 1,185 14.41% 199 1,318 1,200 8.91% 117 $137.25 3.64
Table 12 shows the annualized results from the short-term, standardized testing that was conducted at
each site with the dryers operating in baseline and moisture sensor modes while drying the exact same
load of laundry. The average savings from the standard test at the laundromat were very similar to the
long term testing with 3.7% savings across the four dryers, equaling 42 therms of annual savings and a
7.6 year payback on the $200 installed cost. At the two OPL sites, the savings looked very different for
the standard test. The 2 dryers averaged 14.4% gas savings and 8.9% electric savings, compared to
30.9% and 40.3% in the long term testing. Single point testing with the moisture sensor technology can
be difficult to quantify. The potential savings with the moisture sensor technology are very dependent
on how over dried a load of laundry is. If a load is perfectly dried with the standard dryer settings it
3
Scott, S, H Shah, G. Cushman. 2017 “Nicor Gas Emerging Technology Program 1069: Moisture Sensor Retrofit
Public Project Report.”
Advanced Commercial Clothes Dryer Technologies Field Test
Gas Technology Institute 22You can also read