Gas Market Report 2019 - Asia Pacific Energy Research Centre
←
→
Page content transcription
If your browser does not render page correctly, please read the page content below
Gas Market Report 2019

           i
APERC Gas Market Report 2019

PUBLISHED BY:
Asia Pacific Energy Research Centre (APERC)
Institute of Energy Economics, Japan
Inui Building, Kachidoki 11F, 1-13-1 Kachidoki
Chuo-ku, Tokyo 104-0054 Japan
Tel:    (813) 5144-8551
Fax:    (813) 5144-8555
E-mail: master@aperc.ieej.or.jp (administration)
Website: http://aperc.ieej.or.jp/

©2019 Asia Pacific Energy Research Centre

                                                   ii
APERC Gas Market Report 2019
Foreword
Demand for natural gas has been growing globally over the past decade. This growth has
been at even faster rates in the APEC region backed by increasing consumption by emerging
economies such as China. The fact that natural gas produces less pollutant emissions than
other fossil fuels, amid growing concerns about climate change and de-carbonisation, has
reflected positively on gas consumption. Controlling air pollution in fact provides additional
momentum for natural gas demand in APEC. As LNG exports from the United States grow,
the shale revolution is affecting the gas sector well beyond the border of North America,
and this trend is projected to continue.
The release of this second edition of the APERC Gas Market Report reflects both the ongoing
importance of gas to the APEC region and the state of flux the sector currently finds itself in.
This report is part of a series of APERC Market Reports, along with the Coal Market Report
2019 and Oil Market Report 2019. Fossil fuels, and in particular gas, are still an important
pillar of the power and industry sectors and will remain a sizable component of the energy
mix in most APEC economies for many years to come.
I would like to express my sincere gratitude to the authors and contributors for their time
and effort in writing and publishing this report. However, I would also like to note that the
views expressed in this paper are those of the authors and not necessarily of APERC.
Kazutomo IRIE
President
Asia Pacific Energy Research Centre (APERC)
July 2019
iiiAPERC Gas Market Report 2019
Acknowledgements
We are grateful for the full support and insightful advice from Expert Group on Clean Fossil
Energy members. We also wish to thank the administrative staff of APERC and IEEJ, as this
study could not have been completed without their assistance.
Authors and contributors
APERC: James M. KENDELL ● Diego RIVERA RIVOTA● Christopher DOLEMAN
IEEJ: Yoshikazu KOBAYASHI ● Hiroshi HASHMOTO ● Kouichi UENO ●
Yosuke KUNIMATSU ●Kimiya OTANI ●Gen HOSOKAWA ●Monica
NAGASHIMA
ivAPERC Gas Market Report 2019
Contents
Foreword ............................................................................................................................................iii
Acknowledgements ..........................................................................................................................iv
Contents ............................................................................................................................................ v
Abbreviation and acronyms ........................................................................................................ vii
List of tables and figures ................................................................................................................ viii
Executive summary ........................................................................................................................... 1
Section 1. Natural gas updates in APEC economies ............................................................... 3
Section 2. Gas demand ................................................................................................................. 5
2-1. World and APEC natural gas demand ........................................................................... 5
2-1-1 Overview .......................................................................................................................... 5
2-1-2 United States ................................................................................................................... 6
2-1-3 Russia ............................................................................................................................... 6
2-1-4 China ................................................................................................................................ 6
2-1-5 Japan ................................................................................................................................ 7
2-1-6 Mexico .............................................................................................................................. 8
2-2 World LNG demand ............................................................................................................ 8
2-3 Gas demand outlook......................................................................................................... 10
Section 3. Gas production ........................................................................................................... 13
3-1 World and APEC natural gas production ..................................................................... 13
3-1-1 Overview ........................................................................................................................ 13
3-1-2 United States ................................................................................................................. 14
3-1-3 Russia ............................................................................................................................. 14
3-1-4 Canada........................................................................................................................... 15
3-1-5 China .............................................................................................................................. 16
3-1-6 Australia......................................................................................................................... 16
3-2 World LNG supply ............................................................................................................. 17
vAPERC Gas Market Report 2019
3-3 Gas production outlook ................................................................................................... 18
Section 4. Gas trade...................................................................................................................... 21
4-1 Gas Imports in the world and the APEC region ......................................................... 21
4-2 Gas exports in the world and the APEC region .......................................................... 24
4-3 Gas trade outlook in the world and the APEC region ............................................... 25
Section 5. Gas prices ................................................................................................................... 27
5-1 Change in major natural gas prices of the world ...................................................... 27
5-2 Future outlook ................................................................................................................... 28
Section 6. Case study: China’s growing natural gas consumption and impacts on the
Asia Pacific markets...................................................................................................................... 29
6-1 Growing demand and import dependence ................................................................. 29
6-1-1 Overview ........................................................................................................................ 29
6-1-2 Sectoral demand outlook ............................................................................................. 32
6-2 Gas supply shortage in winter 2017/2018................................................................... 34
6-3 Supply security measures ................................................................................................ 36
6-3-1 Gas storage .................................................................................................................... 36
6-3-2 Transmission and distribution measures .................................................................... 37
6-3-3 LNG regasification capacity ......................................................................................... 37
6-4 Key policies ......................................................................................................................... 38
6-4-1 13th Five-Year Plan ...................................................................................................... 38
6-4-2 Winter clean heating in northern China .................................................................... 38
6-4-3 The battle for Blue Sky Policy ...................................................................................... 39
6-4-3 Transport ........................................................................................................................ 39
6-5 Fuel competition ................................................................................................................ 40
6-5-1 Price competitiveness and expansion of “clean coal” ................................................ 40
6-5-2 Coal use policies............................................................................................................ 41
6-6 Impact on international markets ................................................................................... 42
6-7 Conclusion ........................................................................................................................... 43
Section 7. Conclusions and main takeaways ......................................................................... 45
viAPERC Gas Market Report 2019
References ...................................................................................................................................... 47
Abbreviation and acronyms
Abbreviation
bcm billion cubic metres
GW gigawatts
kWh kilo-Watt hour
Mtoe million tonnes of oil equivalent
Mt million tonnes
Mtpa million tonnes per annum
USD US Dollar
Acronyms
APEC Asia-Pacific Economic Cooperation
APERC Asia Pacific Energy Research Centre
EIA Energy Information Administration, USA
EU European Union
IEA International Energy Agency
IEEJ Institute of Energy Economics Japan
NBS National Bureau of Statistics, China
UN Comtrade United Nations Commodity Trade Statistics Database
viiAPERC Gas Market Report 2019
List of tables and figures
Table 2-1 APEC member economies natural gas consumption, 2007-2017 ....................................................... 5
Figure 2-1 Natural gas consumption in APEC economies, 2007-2017 ................................................................. 7
Table 2-2 APEC member economies LNG imports, 2007-2017 ............................................................................... 9
Figure 2-2 APEC member economies LNG imports, 2007-2017........................................................................... 10
Table 2-3 APEC member economies natural gas consumption, 2015-2021 .................................................... 11
Figure 2-3 Outlook for natural gas consumption in APEC, 2016-2021 ............................................................. 12
Table 3-1 APEC member economies natural gas production, 2007-2017 ........................................................ 13
Figure 3-1 Natural gas production of APEC member economies, 2007-2017 ................................................ 14
Table 3-2 APEC LNG exports, 2007-2017 ..................................................................................................................... 17
Figure 3-3 APEC LNG supply, 2007-2017 ..................................................................................................................... 18
Table 3-3 APEC economies natural gas production outlook, 2016-2021.......................................................... 19
Figure 3-3 APEC LNG supply, 2007-2017 ..................................................................................................................... 20
Table 4-1 APEC members' natural gas imports, 2017 .............................................................................................. 22
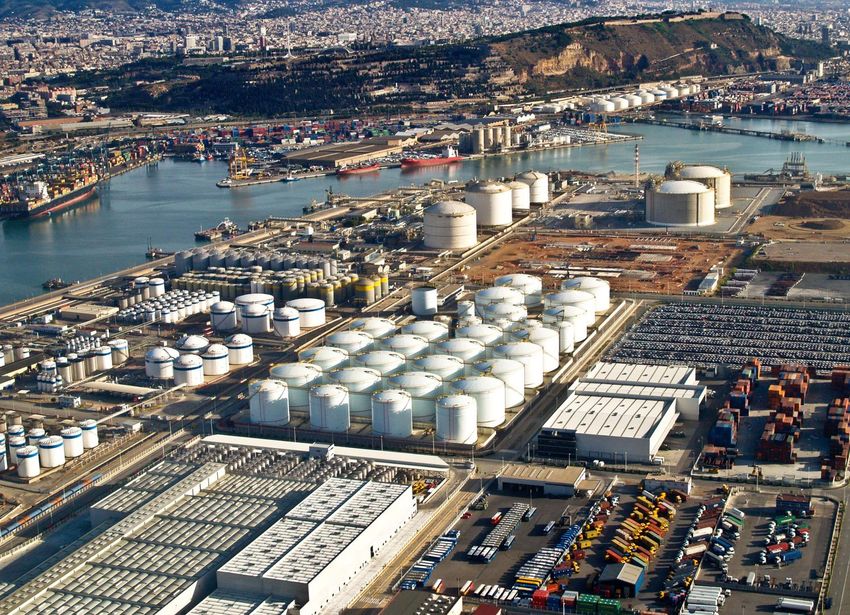
Figure 4-1 Major natural gas trade flows, 2017 ......................................................................................................... 23
Table 4-2 APEC members' natural gas exports, 2017 .............................................................................................. 24
Figure 4-2 Imports and exports of gas, by region, 2016 and 2021 ...................................................................... 26
Figure 5-1 Trends in major natural gas price indexes, 2015-2018 ...................................................................... 27
Figure 6-1 Japan, Korea and China pipeline and LNG imports 2018 (Jan – Oct) .......................................... 30
Figure 6-2 China natural gas supply, 2000-17 ........................................................................................................... 31
Table 6-1 China import pipelines (in operation and under development)........................................................ 31
Figure 6-3 China natural gas supply, 2000-17 ........................................................................................................... 32
Figure 6-4 China natural gas demand for key sectors, 2000-2021 ..................................................................... 34
Figure 6-5 Domestic energy costs for China’s industrial sector, 2014-2018 .................................................... 40
Figure 6-6 China monthly LNG import volumes, 2014-2018 ................................................................................ 42
Figure 6-7 Asia monthly average LNG spot prices, 2015-2018 ............................................................................ 43
viiiExecutive summary
World natural gas demand has grown annually by 2.0% on average in the past 10 years, while gas
demand in the APEC region increased faster, by 2.5% annually. In 2017, about 57% of global gas
consumption took place in the APEC region, more than 10 years ago when this share reached 54% in
2007. Moreover, gas accounted for at least 10% of TPES in all APEC economies, except in three (Chile,
China and Philippines).
In 2017, the US was the main gas consumer in the world, followed by Russia, which has had an
overall sluggish demand growth over the past decade. In the last decade, US gas consumption grew
by 29% (148 Mtoe or 172 bcm) while China increased by 264% (124 Mtoe or 144 bcm). They are the
largest contributors to the APEC region demand growth. While Australia, Russia and Canada also
increased domestic demand from 2012 to 2017, Korea and Japan had an overall decrease in their gas
demand in the same period. Overall, electricity remains the main growth driver in the APEC region,
but industry also increased rapidly. This contrasts with global gas demand growth, where industrial
demand accounted for the largest growth sector.
APEC gas production increased 26% in the last decade, while its share remained stable at around
57% of world’s production. The US surpassed Russia in 2012 as the world’s largest producer. Moreover,
APEC members not only account for most of global gas demand but also three of the world’s four
largest gas producers are APEC members (US, Russia and Canada). During the last decade, the US,
Russia, China and Australia were the largest contributors to APEC production growth. Conversely,
Mexico’s production shrank by 40% (20 bcm) in the same period, the largest production decline of
the 21 APEC member economies.
In terms of natural gas trade, APEC remains a net exporter region, mostly driven by Russian piped
exports to Europe. However, only 25% of gas production in APEC economies is exported outside the
APEC region. Most APEC members have active gas trade with the exception of Viet Nam, Philippines
and New Zealand. Additionally, Russia remains the world’s largest gas exporter. Nevertheless, the US
more than tripled its natural gas exports including pipeline deliveries and LNG exports from 2007 and
2017. At the same time, Canada exported 88 bcm to the US in 2017, 20% lower than in 2007. APEC
gas imports represented 42% of world imports. Japan was the largest natural gas and LNG importer
in the world in 2017. However, China was the fastest growing importer in the world, with LNG
accounting for 57% of its gas imports. While US imports decreased, it still was the third largest gas
importer in APEC in 2017, mainly from Canadian piped gas.
While, globally most natural gas is still traded via pipeline, LNG trade has grown quite fast, and the
APEC region is at the very core of this trend. From 2007-17, APEC LNG exports grew annually by 6.7%
while world LNG exports grew by 6.0%. Australian LNG exports more than tripled in 10 years, leading
growth both in the APEC region and globally. In addition, US LNG exports more than quadrupled
1APERC Gas Market Report 2019
compared with 2016, as most of the first wave of liquefaction projects on the Gulf Coast were
operational in 2017. On the other hand, traditional LNG exporters like Malaysia were stagnant while
Indonesian exports have been decreasing. At the same time, LNG imports to APEC represented 72%
of global imports, with 14 members importing LNG. Japan remains the largest LNG importer, despite
falling demand since 2014. China became the second world’s largest importer in 2017 with an
impressive 47 bcm growth from 2007-17. Unsurprisingly, US LNG imports shrank by 18 bcm since
2007, following increased domestic production. Finally, Korean LNG imports grew for the first time
since 2013, but uncertainty remains about its nuclear and coal-fired power generation policy and its
impact on LNG imports.
According to the results of the APEC Energy Demand and Supply Outlook 7 th Edition, APEC gas
demand increases by an average 1.8% to 2 200 bcm by 2021. This growth is driven by increasing
demand in all APEC economies, with only the exception of New Zealand and Japan. On the other hand,
demand growth continues to be driven mainly by the US and China. On the supply side, APEC gas
production increases to around 2 300 bcm by 2021. Combined production in United States, Russia,
China and Australia increases by more than 267 bcm by 2021. Conversely, gas production in Mexico,
Indonesia and Thailand decreases steadily by 2021. In terms of trade, both piped and LNG imports to
China almost double by 2021, while North-east Asia and South-east Asia see growth in their gas
imports, predominantly via LNG. US natural gas exports more than double from 2017 to 2021, with
most growth in exported via LNG but also steady growth in piped exports to Mexico. Russian gas
exports also increase robustly with volumes to Europe similar to the ones seen in the past five years
and incremental exports going towards China, once the Power of Siberia pipeline is commissioned.
In conclusion, with 57% of global gas consumption and production, APEC members are at the centre
of global natural gas dynamics. China and the US are driving gas demand growth. While the shale
revolution has substantially changed gas demand in the US, the impact of US LNG exports is still
relatively limited compared with its potential. China gas demand will keep growing to become the
world’s largest gas importer and later the biggest LNG importer in the next five years. After sluggish
developments of new LNG projects in recent years, linked to low LNG prices in Asia, the supply and
demand balance could become tight in the early 2020s as demand in China and Southeast Asia
continues to grow. As a result, three dynamics demand special attention in the next years: Russian
piped and LNG exports to China; China’s actions on increasing domestic pipeline infrastructure,
further regasification and storage capacity as well as pricing mechanisms; and US LNG exports and
their competitiveness in global markets, particularly in Northeast Asia and China versus Europe.
2APERC Gas Market Report 2019
Section 1. Natural gas updates in APEC economies
Economy Topic
Australia Start-ups of new liquefaction capacities in Ichthys (November 2018) and
Prelude (December 2018) increased the liquefaction capacity of Australia by
86.6 Mtpa.
Brunei Construction of demonstration plant to produce hydrogen natural gas will
Darussalam be built at Sungai Liang Industrial Park (SPARK), Brunei. The plant will start
operation from the end of 2019. The project is promoted by a consortium
of Japanese companies
Canada Supply growth in new areas, insufficient infrastructure and declining
demand from the US, have put Canadian natural gas prices at a heavy
discount to Henry Hub prices.
In response to these developments, Canada has strived to attract investment
in liquefaction facilities to export LNG to other markets.
LNG Canada and Woodfibre LNG have announced positive final investment
decisions to build new-build LNG export facilities on Canada’s west coast.
Chile Chile resumed natural gas piped imports from Argentina after more than 10
years, as a result of increasing Argentinean production from the Vaca
Muerta field.
China As an effort to manage seasonal demand fluctuation, CNPC plans to
increase its total working capacity of natural gas storage to 15 bcm by 2025,
meeting 10% of the peak seasonal demand. CNPC plans to add seven new
storage sites, as well as to drill more wells and add compression stations at
the existing sites.
Indonesia Pertamina cancelled a planned LNG receiving terminal for 4 Mtpa in
Bojonegara, near Jakarta in July 2018 because of the relative economics of
LNG against coal.
Japan Natural gas consumption decreased slightly after 2015, because of the
restarting of some nuclear power plants, as well as the decline in overall
primary energy consumption. Uncertainty arises in forecasting gas demand
as the government pushes to restart more nuclear power plants and adopt
renewable energies.
Korea Korea expects its natural gas demand will rise to 40 million tonnes of LNG
per annum in 2031, as Korea shifts away from coal and nuclear. It had
previously forecast natural gas demand falling to 34.65 million tonnes.
Malaysia Malaysia’s Petronas filed an application before the Federal Court seeking a
declaration that the Petroleum Development Act 1974 is the law applicable
for the petroleum industry in Malaysia, and that Petronas is the exclusive
owner of the petroleum resources as well as regulator for the upstream
industry throughout Malaysia including Sarawak.
Mexico Gas piped imports from the US have more than quadrupled since 2005,
reaching almost 40 bcm in 2017. This trend seems likely to continue as the
3APERC Gas Market Report 2019
gap between decreasing domestic production and growing demand has
widened in the past decade, mainly driven by power generation.
New The New Zealand government announced in April 2018, that it will not allow
Zealand any new drilling for oil and gas development as a part of climate change
actions. The existing permissions are for a maximum 40-year operation.
Papua New PNG LNG interrupted its operational in March because of an earthquake but
Guinea restarted the operation in April 2018.
Peru Peru LNG also interrupted its operations in March 2018 because of a land
slide that affected a pipeline.
Philippines The Asian Development Bank (ADB) signed an agreement with the
Philippine National Oil Company (PNOC) to act as transaction advisor for
the Philippines’ first LNG regasification project in Batangas. Seven foreign
companies have submitted unsolicited proposals to PNOC for a joint
venture partnership to build an LNG terminal.
Russia Novatek announced that it started to export cargoes from the second train
of Yamal LNG, some 11 Mtpa of capacity is in operation and another 6.4
Mtpa will be added at Yamal LNG.
Singapore Singapore initiated its efforts to be an LNG bunkering hub. The Maritime
and Port Authority of Singapore awarded SGD 6 million to FuelLNG and
Pavilion Gas for the building of two LNG bunker vessels. Total and Pavilion
Gas signed an agreement to jointly develop an LNG bunker supply chain in
the port of Singapore.
Chinese The plan for Chinese Taipei’s third LNG receiving terminal was rejected early
Taipei July by a government environmental committee, which cited a likely “grave
impact” on the ecology of rare algae and coral species.
Thailand PTT started to study the feasibility of an LNG bunkering facility in Map Tha
Phut port with Marubeni Corporation in January 2018.
United U.S. liquefaction capacity expansion is on track. Cove Point LNG started their
States operations in April and other projects will follow. As part of another wave of
liquefaction capacity expansion, Cheniere announced its FID on Train-3 of
its Corpus Christi Project in May targeting the start of operation in 2021.
Viet Nam Given the depletion of domestic production and growing domestic demand,
state-owned PV Gas plans to import natural gas. The company plans to
spend US$4 billion into gas transport, processing, distribution and import
infrastructure until 2020.
4APERC Gas Market Report 2019
Section 2. Gas demand
2-1. World and APEC natural gas demand
2-1-1 Overview
More than half of global natural gas demand takes place in the APEC region. While world natural gas
demand has grown by an average of 2.0% per year since 2007, APEC gas demand has grown at a
slightly faster rate and accounts for 1 760 million tons of oil equivalent (Mtoe) or 2 047 billion cubic
meters (bcm) in 2017 (Table 2-1). As a result, the APEC share of global demand increased from 54%
in 2007 to 57% in 2017. This growth in gas demand in APEC member economies is attributable mainly
to the United States and China, with consumption in these economies alone increasing 223 Mtoe (259
bcm) from 2007 to 2017. This represents about 39% of global demand growth over the same 10-year
period (Figure 2-1).
Table 2-1 APEC member economies natural gas consumption, 2007-2017
Natural Gas Consumption (Mtoe)
Economy 2007 2008 2009 2010 2011 2012 2013 2014 2015 2016 2017
APEC Total 1,368 1,391 1,372 1,472 1,537 1,582 1,639 1,676 1,679 1,722 1,760
Australia 27 29 29 28 30 29 30 32 32 35 35
Brunei Darussalam 3 3 2 3 3 3 2 3 2 2 3
Canada 79 79 78 79 83 83 87 88 87 95 103
Chile 4 2 3 4 5 4 4 4 4 4 4
China 66 76 84 101 124 133 152 166 171 187 197
Hong Kong, China 2 3 3 3 2 2 2 2 3 3 3
Indonesia 28 30 34 39 36 35 37 37 38 39 40
Japan 74 77 72 77 86 95 103 104 102 103 101
Korea 31 32 32 39 42 45 48 43 39 41 43
Malaysia 35 38 32 31 32 32 38 38 38 36 37
Mexico 51 52 54 54 57 59 62 61 65 66 67
New Zealand 4 3 4 4 3 4 4 4 4 4 4
Papua New Guinea 0 0 0 0 0 0 0 0 1 1 1
Peru 3 3 4 5 6 7 6 8 8 8 7
Philippines 3 3 3 3 3 3 3 3 3 3 3
Russia 366 366 350 384 396 387 386 385 364 371 405
Singapore 6 7 7 7 7 8 9 9 9 9 9
Chainese Taipei 10 11 10 13 14 13 13 14 15 15 17
Thailand 28 31 29 33 31 35 38 38 38 37 37
United States 543 541 536 556 569 595 607 628 647 653 635
Viet Nam 5 6 7 8 8 8 9 9 10 9 9
World Total 2,529 2,594 2,537 2,735 2,791 2,844 2,896 2,915 2,944 3,035 3,094
APEC Share 54.1% 53.6% 54.1% 53.8% 55.1% 55.6% 56.6% 57.5% 57.0% 56.7% 56.9%
Sources: International Energy Agency (IEA), World Energy Balances 2018; APEC Expert Group on Energy Data and Analysis,
Energy Balance Table
5APERC Gas Market Report 2019
2-1-2 United States
While primary energy demand in the United States has decreased in absolute terms by around 8.5%
since 2007, its gas demand has increased by almost 17%. This has been mainly driven by the
abundance of inexpensive shale gas production in the Appalachian basin and associated production
in the Permian basin. The Henry-hub benchmark has averaged under 2.83 USD dollars per million
British thermal units ($/MMBtu) from 2015 to 2018, 22% below its 3.62 $/MMBTU average in the
2012-2015 period (EIA, 2019).
These low prices enabled natural gas to displace coal as the main fuel for power generation fuel in
2016. While power generation has led demand growth in the US, demand has also grown in the
industrial and residential sectors. As a result, the share of natural gas in primary energy demand rose
from 23% in 2007 to 30% in 2017. The US is the largest gas consumer in the world, accounting for
635 Mtoe (738 Bcm), which is equivalent to 20% of global demand.
2-1-3 Russia
Russia is the second largest gas consumer and producer in the world and is also the top natural gas
exporter. Power generation is the largest demand sector in Russia, with around 54% of the total, and
gas remains the main fuel for power generation with around 41% of the total. However, other power
generation technologies like nuclear and renewables have increased their share. Consequently,
despite a modest growth in absolute terms, the gas demand share of primary energy demand has
actually dropped from 54% in 2007 to 51% in 2017.
2-1-4 China
Energy consumption in China continues to grow rapidly because of economic development, making
it the world’s largest energy consumer since 2009. The massive quantity of domestically produced
coal is its main source of primary energy, accounting for more than 60% of energy consumption.
However, China gas demand has grown very fast since 2010, almost doubling in 2017 and becoming
the third-largest natural gas consumer in the world in that same year. Nevertheless, the share of
natural gas in China’s primary energy consumption remains small, at around 6% of the total.
The Chinese government launched The Action Plan on Prevention and Control of Air Pollution in 2018
to combat the negative impacts associated with increasingly poor air quality and environmental
pollution levels (Hao, 2018). This plan allocates financial support to assist central and local
governments in replacing coal-fired heating boilers with gas-fired and electrical alternatives. However,
this has increased the demand for natural gas during winter, especially in northern areas, widening
the winter-to-summer demand ratio for natural gas. As there is insufficient major gas storage
infrastructure to service demand peaks, gas imports increased dramatically, both via pipeline and in
form of LNG, driving LNG spot prices in the Asia market upwards. This was particularly acute in the
winter of 2017, but milder temperatures moderated this seasonal effect in 2018.
6APERC Gas Market Report 2019
China’s natural gas imports increased more than five-fold from to 2010 to 2017. However, LNG
imports have been growing even faster, almost doubling from 2015 to 2017, surpassing Korea as the
world’s second-largest LNG importer (IEA, 2018). It is expected that China’s LNG imports will keep
growing as will piped imports following the commissioning of the Sino-Russian Power of Siberia
pipeline by 2020.
Figure 2-1 Natural gas consumption in APEC economies, 2007-2017
(Mtoe)
2,000 Other
1,800 Malaysia
1,600 Thailand
1,400 Indonesia
1,200 Korea
1,000 Mexico
800 Japan
Canada
600
China
400
Russia
200
United States
0
2007 2008 2009 2010 2011 2012 2013 2014 2015 2016 2017
Sources: International Energy Agency (IEA), World Energy Balances 2018; APEC Expert Group on Energy Data and Analysis,
Energy Balance Table
2-1-5 Japan
Japan was still the world’s largest LNG importer in 2017. As Japan has no international pipeline
interconnections and domestic production is limited, LNG imports account for approximately 97% of
total supply. LNG imports are particularly important for power generation, as around 40% of electricity
generation came from gas-fired power plants in 2016.
The shutdown of all of Japan’s nuclear power plants following the Great East Japan Earthquake in
March 2011 dramatically increased the demand for substitute fuels such as coal and, in particular,
natural gas. This resulted in a rapid expansion of the natural gas share of primary energy consumption
from about 17% to at least 23% and a 27% increase on LNG imports from 2010 to 2013. Natural gas
consumption decreased slightly after 2015, because of the restarting of some nuclear power plants,
as well as the decline in the overall primary energy consumption. However, uncertainty arises in
7APERC Gas Market Report 2019
forecasting gas demand as the Japanese government pushes to restart more nuclear power plants
and adopt renewable energies.1
2-1-6 Mexico
Natural gas production peaked in 2009 at 44 Mtoe (51 bcm) but fell to 30 Mtoe (35 bcm) in 2016, a
30% decrease. Moreover, Mexican natural gas production competes with low-cost US natural gas
imports, which have been covering rising demand and compensating for declining production. Lack
of investment in exploration and infrastructure modernisation has been even more significant in the
natural gas sector, since Pemex historically prioritised oil production.
Mexico is currently a net importer of natural gas, as the gap between decreasing domestic production
and growing demand has widened in the past decade, mainly driven by power generation. Natural
gas imports increased from 7.7 Mtoe in 2005 (8.7 bcm) to 36 Mtoe (41 bcm) in 2016, registering a
record high every year from 2008. The vast majority (88%) of these imports are piped from the United
States and the remainder is imported as LNG, mainly from Peru and the United States, to one of
Mexico’s three regasification terminals. However, further increase of both inexpensive gas imports
from the US and domestic gas production is hampered by insufficient infrastructure. Since 2011, 25
new natural gas pipeline projects have been launched in Mexico and 6 in the United States, including
the addition of 8 interconnections with the United States, increasing total natural gas import capacity
to 114 bcm per year (103 Mtoe) by 2019. However, construction on at least six pipelines has been
delayed for more than two years because of opposition from local communities, environmental
groups, or indigenous groups resulting from concerns of surrounding the Free Prior Informed Consent
processes. This may result in stagnant gas imports from inexpensive US Permian shale gas.
2-2 World LNG demand
World LNG imports increased by an average of 5.6% per year from 157 million tons per annum (Mtpa),
(214 bcm) in 2007, to 273 Mtpa (371 bcm), in 2017. APEC LNG imports were below the world’s growth
rate, increasing by an average 4.8% per year from to 196 Mtpa (267bcm) in 2017 (Table 2-2). In
addition, APEC accounted for 72% of global LNG imports in 2017, with the majority of these volumes
produced within the APEC region. However, APEC’s LNG demand as a share of global demand has
decreased by 6.5 percentage points from 78% in 2007. This is the result of increasing LNG demand
outside the APEC region, for example, in India, Pakistan and Bangladesh.
1
As of October 2018, nine nuclear power plants (Takahama, Ohi, Genkai, Sendai, and Ikata) have been restarted and
restarting of other nuclear plants is scheduled.
8APERC Gas Market Report 2019
Table 2-2 APEC member economies LNG imports, 2007-2017
LNG Import (Mtpa)
Economy 2007 2008 2009 2010 2011 2012 2013 2014 2015 2016 2017
APEC Total 122 119 119 140 158 161 176 176 168 177 196
Australia 0 0 0 0 0 0 0 0 0 0 0
Brunei Darussalam 0 0 0 0 0 0 0 0 0 0 0
Canada 0 0 1 1 2 1 1 0 0 0 0
Chile 0 0 0 2 3 3 3 2 3 3 3
China 3 3 5 8 11 14 18 20 20 27 39
Hong Kong, China 0 0 0 0 0 0 0 0 0 0 0
Indonesia 0 0 0 0 0 0 0 0 0 0 0
Japan 68 68 66 71 83 87 88 89 84 85 84
Korea 26 29 26 34 36 37 41 38 33 34 37
Malaysia 0 0 0 0 0 0 5 3 4 4 5
Mexico 2 2 3 4 3 3 5 6 5 4 5
New Zealand 0 0 0 0 0 0 0 0 0 0 0
Papua New Guinea 0 0 0 0 0 0 0 0 0 0 0
Peru 0 0 0 0 0 0 0 0 0 0 0
Phillippines 0 0 0 0 0 0 0 0 0 0 0
Russia 0 0 0 0 0 0 0 0 0 0 0
Singapore 0 0 0 0 0 0 1 2 2 2 2
Chainese Taipei 8 9 9 11 12 12 12 12 13 14 15
Thaliand 0 0 0 0 1 1 1 1 3 3 4
United States 15 7 9 9 7 3 2 1 2 2 1
Viet Nam 0 0 0 0 0 0 0 0 0 0 0
World Total 157 155 174 211 234 229 228 230 235 248 273
APEC Share 78.2% 76.3% 68.7% 66.2% 67.7% 70.4% 77.2% 76.5% 71.4% 71.4% 71.7%
Source: IEA, World Energy Balances 2018; Cedigaz, Natural Gas in the World
In 2007, there were six APEC member economies importing LNG; this number increased to 11 in 2017.
By volume, Japan, China and Korea account for most of the LNG imports among APEC member
economies, with these three economies importing 160 Mtpa of LNG in 2017. This is equivalent to 59%
of worldwide LNG imports and 82% of APEC LNG imports.
Demand for natural gas in China is growing rapidly. As domestic production is not enough to meet
demand, China has continued to import gas via pipeline and LNG. In 2017, 62% of natural gas demand
was supplied with domestic production, 23% with LNG imports and 15% with pipeline imports. The
first domestic LNG receiving terminal in China began operation in 2006 and 20 LNG receiving
terminals were operating as of October 2018. In response to the rapid increase in natural gas demand,
LNG import volume has been increasing in recent years, and in 2017, China became the second largest
LNG importer in the world after Korea (Figure 2-2).
The United States, once a net LNG importer, has seen imports decline because of the increase in
domestic natural gas production. Exports from Sabine Pass LNG, its first large-scale LNG export facility,
started in 2016 and have since been growing rapidly.
Advances in hydraulic fracturing and horizontal drilling technologies have keep Canada’s eastern
markets supplied with low-cost gas from the US and reduced the need for imports at Canaport LNG,
Canada’s only LNG import facility. Imports have fallen by 88% from 2011 to 2017, remaining below
one Mtpa of LNG per year in 2017 (NEB, 2018).
9APERC Gas Market Report 2019
Figure 2-2 APEC member economies LNG imports, 2007-2017
(Mtpa)
200
Other
180
United States
160
Singapore
140
Chile
120
Thaliand
100
Malaysia
80
Mexico
60
Chainese Taipei
40
Korea
20
China
0
Japan
2007 2008 2009 2010 2011 2012 2013 2014 2015 2016 2017
Source: IEA, World Energy Balances 2018; Cedigaz, Natural Gas in the World
New Zealand, the Philippines and Viet Nam are the only APEC economies that do not trade natural
gas. However, the two latter economies are planning the construction of LNG receiving terminals. The
Philippines is expected to start imports around 2019 and Viet Nam after 2020.
Australia became the world’s second largest LNG exporter in 2016. Three LNG export projects in
eastern Australia have started operation. However, this has caused a shortage of natural gas and high
prices for the domestic market in this Australian region. To counter the shortfall, five LNG import
terminal projects have been proposed and are aiming to begin operations in the early 2020s.
2-3 Gas demand outlook
According to the Asia Pacific Energy Research Centre’s (APERC) APEC Energy Demand and Supply
Outlook 7th Edition, APEC total gas demand grows by 13% up to 2021, reaching 1 925 Mtoe by 2021.
The share of natural gas in the APEC fuel mix also grows from 21% in 2016 to 23% in 2021, as coal
demand declines and oil demand shows slow growth. Power generation by natural gas remains the
main driver of natural gas supply growth in this scenario and represents about 41% (793 Mtoe) of
total primary gas supply in 2021. Additionally, every demand sector contributes to this growth, with
industry demand increasing by 21% to reach 339 Mtoe by 2021.
10APERC Gas Market Report 2019
Table 2-3 APEC member economies natural gas consumption, 2015-2021
Natural gas demand by economy (Mtoe) 2016-21
Economy 2016 2017 2018 2019 2020 2021 Change %
Australia 34 37 39 39 39 41 6 19%
Brunei Darussalam 2.5 2.8 2.8 2.6 2.6 2.6 0.1 2%
Canada 95 97 99 99 99 98 3 3%
Chile 4.3 4.0 4.0 4.1 4.1 4.2 -0.2 -4%
China 169 187 206 224 241 253 84 50%
Hong-Kong, China 2.9 2.9 2.9 3.1 3.4 3.7 0.8 26%
Indonesia 39 34 36 39 41 42 3 8%
Japan 105 115 115 111 107 101 -5 -4%
Korea 41 38 41 42 41 41 -1 -2%
Malaysia 33 32 32 32 33 34 1 4%
Mexico 67 65 68 70 72 73 6 9%
New Zealand 4.2 4.3 4.2 4.0 3.8 3.9 -0.3 -7%
Papua New Guinea 1.4 1.5 1.5 1.5 1.5 1.6 0.2 11%
Peru 9.1 10 10 10 10 10 1 12%
Phillipines 3.3 2.2 2.1 0.8 0.8 1.2 -2.1 -65%
Russia 366 373 379 382 383 385 19 5%
Singapore 8.7 8.8 8.9 9.0 9.1 9.2 0.4 5%
Chinese Taipei 16 17 17 16 15 16 1 4%
Thailand 37 36 37 37 37 38 1 3%
USA 652 676 699 716 735 757 106 16%
Viet Nam 10 10 10 10 10 11 1 7%
APEC total 1700 1754 1812 1850 1889 1925 225 13%
Source: APERC, APEC Energy Demand and Supply Outlook 7th Edition (2018).
On a regional basis, the United States and China have historically driven APEC natural gas growth. In
the United States, total primary gas demand grew by 28% from 507 Mtoe in 2005 to 652 Mtoe in
2016. China showed remarkable demand growth of 346% over the same period, from 38 Mtoe to
169 Mtoe, and now have the third-largest gas demand in APEC, behind the United States and Russia.
According to the APEC Energy Demand and Supply Outlook, natural gas represents at least 10% of
TPES in every APEC economy by 2021, with the exception of Chile, China and the Philippines. While
the United States and China dominate growth, 16 of the 21 APEC economies2 show total gas demand
growth from 2016 to 2021. Total primary gas demand in China, mainly driven by increasing demand
from power generation and, to a lesser extent, industry, grows by 50% by 2021, leading gas supply
growth in the APEC region. Natural gas demand in the United States increases by 16% to reach
2
The exceptions are Chile, Korea, Japan, Phillipines and New Zealand.
11APERC Gas Market Report 2019
757 Mtoe in 2050 and is mainly driven by increases in gas-fired power generation. Russia total supply
grows 5%, reaching 385 Mtoe by 2050. South-east Asia gas demand remains at similar levels in the
short term, as a result from modest growth from Indonesia and Thailand and decreasing consumption
in Philippines. Gas demand in North-east Asia stagnate resulting from decreases in demand in Japan
and Korea and timid growth in Chinese Taipei. Elsewhere, gas demand grows by 6% in the Other
Americas, leaded by Mexico and Canada. Finally, gas demand in Oceania grows by 16% from to 2016
to 2021, mainly leaded by power generation in Australia.
Figure 2-3 Outlook for natural gas consumption in APEC, 2016-2021
2 000
→ Projection
1 800 Oceania
1 600 Other Americas
1 400
North-east Asia
1 200
1 000 South-east Asia
800
Russia
600
400 China
200 United States
Mtoe
0
2016 2021
Source: APERC, APEC Energy Demand and Supply Outlook 7th Edition
12APERC Gas Market Report 2019
Section 3. Gas production
3-1 World and APEC natural gas production
3-1-1 Overview
Table 3-1 APEC member economies natural gas production, 2007-2017
Natural Gas Production (Mtoe)
Economy 2007 2008 2009 2010 2011 2012 2013 2014 2015 2016 2017
APEC Total 1,434 1,480 1,432 1,527 1,590 1,600 1,639 1,676 1,710 1,734 1,806
Australia 38 40 42 44 48 46 52 53 56 73 88
Brunei Darussalam 12 12 11 12 12 12 12 11 12 11 10
Canada 150 145 135 132 132 130 130 138 139 146 155
Chile 1 1 2 2 1 1 1 1 1 1 1
China 64 75 79 89 98 98 108 116 120 123 119
Hong Kong, China 0 0 0 0 0 0 0 0 0 0 0
Indonesia 61 63 66 73 69 66 66 65 64 63 65
Japan 3 3 3 3 3 3 3 3 2 4 3
Korea 0 0 0 0 0 0 0 0 0 0 0
Malaysia 52 55 52 47 52 51 53 53 56 52 63
Mexico 43 42 44 43 42 41 40 37 34 30 26
New Zealand 4 3 4 4 3 4 4 4 4 4 4
Papua New Guinea 0 0 0 0 0 0 0 2 8 7 8
Peru 2 3 4 7 10 11 11 12 11 13 16
Philippines 3 3 3 3 3 3 3 3 3 3 3
Russia 522 535 479 540 553 541 554 531 524 538 580
Singapore 0 0 0 0 0 0 0 0 0 0 0
Chinese Taipei 0 0 0 0 0 0 0 0 0 0 0
Thailand 20 23 21 25 22 26 28 32 28 28 25
United States 450 470 480 495 531 558 564 606 637 627 632
Viet Nam 6 7 7 8 8 8 9 9 8 8 9
World Total 2,511 2,615 2,536 2,715 2,791 2,838 2,899 2,942 2,989 3,032 3,142
APEC Share 57.1% 56.6% 56.5% 56.3% 57.0% 56.4% 56.5% 57.0% 57.2% 57.2% 57.5%
Source: International Energy Agency (IEA), World Energy Balances 2018; APEC Expert Group on Energy Data and Analysis,
Energy Balance Table
Over the past decade, the world’s natural gas production has continued to expand following demand.
Table 3-1 shows natural gas production from 2007 to 2017. World gas production increased by an
average 2.3% per year from 2 511 Mtoe (2 920 bcm) in 2007 to 3 142 Mtoe (3 653 Bcm) in 2017. The
production from APEC also increased by an average 2.3% per year from 1 434 Mtoe (1 667 bcm) in
2007 to 1 806 Mtoe (2 100 bcm) in 2017. APEC’s share of world production increased marginally from
57.1% in 2007 to 57.5% in 2017. APEC member economies, where production growth was
concentrated in the United States, China and Australia, accounted for an increase of 254 Mtoe (295
bcm) from 2007 to 2017, which stands for 45% of the world production increase.
13APERC Gas Market Report 2019
Figure 3-1 Natural gas production of APEC member economies, 2007-2017
Source: International Energy Agency (IEA), World Energy Balances 2018; APEC Expert Group on Energy Data and Analysis,
Energy Balance Table
3-1-2 United States
Enabled by advancements in horizontal drilling techniques that allowed the production of shale gas
at very competitive prices, gas production in the US has grown 50% in the past 10 years. In 2012, the
US surpassed Russia to become the world’s largest supplier. Moreover, the production growth led not
only to decrease gas imports, but also to increase exports via pipeline to both Mexico and Canada
and, in the form of LNG, to international markets (EIA, 2019). This culminated with the US becoming
a net gas exporter in 2017.
US LNG exports have grown steadily since 2015, reaching 17 bcm (15 Mtoe) in 2017, and growth
should continue as liquefaction capacity is projected to grows up to 90 bcm per year by 2020 (EIA,
2019). The abundant reserves of the Permian and Appalachian basins, low production costs and the
lack of restrictions on destination have raised expectations for the medium term, particularly in the
Asian and European LNG markets. However, the escalating trade disputes between the US and China
may hinder US LNG exports to the fastest growing gas importer in the world.
3-1-3 Russia
Russia is the second world’s largest gas producer and the largest exporter. Traditionally, Russia
exported most of its gas (around 220 bcm) via pipeline to European importers. Around 30% of Russia’s
gas production is exported to European consumers via pipeline. Recently, its LNG exports have grown
14APERC Gas Market Report 2019
to 15 bcm in 2017 following the commissioning of Yamal LNG.
However, piped gas trade between Russia and Europe has been subject to geopolitical differences
and tensions, particularly with gas volumes transiting through Ukraine. Russia and Ukraine held
disputes on gas prices and transit fees, which resulted in Russia cutting off its European export
through Ukraine in 2006, 2009, and 2015; this resulted in gas cuts and shortages in about 15 countries
in Europe (OIES, 2019). The European Union is still dependent for about 40% of its total supply on
Russian piped imports (BP, 2019).
Considerable uncertainty surrounds the complex Russian-EU gas trade. The EU aims to diminish
dependence on Russian gas by building the South Stream pipeline project that will bring gas from
Azerbaijan, and by increasing LNG imports. However, Russian piped imports have increased by 11%
since 2012, when the Nordsteam pipeline, that bypasses Ukraine, became operational. Some of this
increase is due to stagnant production in Norway and decreasing production in the Netherlands, both
of which were traditional gas suppliers for the EU. Additionally, while there are big expectations for
US LNG exports to Europe, its delivered cost is still more expensive than that of pipeline gas from
Russia. Furthermore, the Nord Stream II and the Turkish Stream pipelines will increase Russian export
capacity to Europe once they become operational.
At the same time, the Russian company Gazprom is also building the Power of Siberia pipeline, which
will link China with 38 bcm per year of Russian natural gas capacity (Gazpom, 2019). This pipeline is
expected to be operational by 2020. Finally, Russia aims to increase its LNG liquefaction capacity by
almost 10-fold, with Novatek alone looking to increase its liquefaction capacity up to 95 bcm
(Boersma and Mitrova, 2018).
3-1-4 Canada
As of 2017, Canada was the world’s fifth-largest natural gas supplier; its production volume has
increased from 150 Mtoe (174 bcm) in 2007 to 155 Mtoe (180 bcm) in 2017. Canada has historically
exported its surplus production by pipeline to the United States. As Canada lost part of its traditional
North American market to the rising production of low-cost shale gas in the United States, net exports
to the United States have stabilised around 69 Mtoe (80 bcm) in recent years.
The technological advancements in hydraulic fracturing that led to the shale revolution in the United
States have renewed the growth potential of Canada’s Western Canadian Sedimentary Basin (WCSB),
particularly in the tight resources known as the Montney formation and Alberta Deep Basin. These
advancements have dropped production costs and have allowed Canada to reverse several years of
production declines. However, this production growth is occurring in new areas of the WCSB, and this
is creating bottlenecks, as infrastructure development has been unable to keep pace with resource
development. This, combined with the declining demand from the US, has put Canadian natural gas
prices at a heavy discount to Henry Hub prices (NEB, 2018e). Several producers are curtailing spending
plans and production guidance in response to sustained low prices, which will limit the short-term
15APERC Gas Market Report 2019
growth prospects for Canadian natural gas production. The prospects of long-term production
growth depend on the successful reconfiguration of WCSB upstream infrastructure and the
diversification of Canada’s export markets.
In response to these developments, Canada has strived to attract investment in liquefaction facilities
to export LNG to Asia and other markets. LNG Canada and Woodfibre LNG have announced positive
final investment decisions to build new LNG export facilities on Canada’s west coast, and the existing
small-scale Tilbury LNG has entered into an agreement to supply China with LNG via ISO shipping
containers (FortisBC, 2019). There is also interested from several other west coast projects and a
couple projects on the east coast.
3-1-5 China
China’s natural gas consumption is forecasted to continue increasing, and the government is
proceeding to expand the production of natural gas along with it. The Chinese government has set a
goal of increasing natural gas consumption so that it will represent at least 10% of primary energy
consumption by 2020, improving energy security and decreasing pollutant emissions.
China’s natural gas supply sources can be roughly divided into domestic production, imports via
pipeline and LNG. With respect to the domestic natural gas production, in October 2013 China’s
National Energy Administration announced its shale gas industry policy, positioning shale gas
development as a national strategic industry, and providing supports such as subsidies, allowances
for producers and tax exemptions for facilities that import gas from abroad as a result of exploration
and development. Based on this policy, Chinese companies are proceeding to develop
unconventional natural gas. In 2017, coalbed methane (CBM) and shale gas combined produced
around 15 bcm (13 Mtoe), with the Chinese government planning to raise this to about 40 bcm (34
Mtoe) by 2020.3 Pipeline imports come from Turkmenistan, Kazakhstan, Uzbekistan and Myanmar.
Piped imports from Russia will begin when the Power of Siberia pipeline, currently under construction,
is completed by the end of 2020, with a maximum import capacity of 38 bcm per year. China has been
importing LNG since 2006, and its LNG imports in 2017 have increased significantly by 53.3%
compared with the previous year.
3-1-6 Australia
In Australia, natural gas production has dramatically increased in the past few years as many
liquefaction projects have recently come online. These large-scale projects include the Gorgon LNG
project and the Australia Pacific LNG project in 2016 and the Wheatstone LNG in 2017. More recently,
the Ichthys LNG led by Inpex has shipped the first LNG in October 2018. Shell’s floating LNG facility,
Prelude is close to delivering the first LNG once fully operational. Australia’s LNG supply is expected
3
Presentation made by the National Energy Administration of China at the 5th Unconventional Natural Gas Forum held in
Brisbane, Australia on 23 February 2017.
16APERC Gas Market Report 2019
to continue to increase in the coming years.
There have been some changes in domestic regulations in Australia in recent years. In August 2016,
the government of the south-eastern state of Victoria announced a policy to indefinitely prohibit
advanced shale gas drilling technology, such as hydraulic fracturing (fracking). The ban applies to
onshore drilling but excludes offshore oilfields, with possibility of future restrictions on new
developments. In July 2017, the Australian government announced it would implement the Australian
Domestic Gas Security Mechanism (ADGSM), which can impose LNG export restrictions if there is an
imminent domestic gas supply shortage. Only one project in eastern Australia could be affected by
this mechanism, and the impact on the international gas market would be limited.
3-2 World LNG supply
World LNG supply has increased by an average 6.0% per year over the past 10 years from 155 Mtpa
(211 bcm) in 2007 to 277 Mtpa (377 bcm) in 2017. APEC’s LNG supply, exceeding the world’s growth
rate, has increased by an average 6.7% per year from 65 Mtpa (88 bcm) in 2007, to 124 Mtpa (169
bcm) in 2017. For both, the world and APEC, the LNG supply growth rate exceeds that of natural gas
production, indicating that LNG transactions have become more active. APEC’s LNG share of global
LNG supply increased from 42% in 2007, to 45% in 2017. APEC’s share is expected to grow as Australia
and the United States are expected to increase their LNG supply.
Table 3-2 APEC LNG exports, 2007-2017
LNG Export (Mtpa)
Economy 2007 2008 2009 2010 2011 2012 2013 2014 2015 2016 2017
APEC Total 65 63 68 81 87 81 86 84 85 99 124
Australia 14 14 15 18 20 19 24 23 25 37 50
Brunei Darussalam 7 7 7 6 6 6 7 6 6 6 6
Canada 0 0 0 0 0 0 0 0 0 0 0
Chile 0 0 0 0 0 0 0 0 0 0 0
China 0 0 0 0 0 0 0 0 0 0 0
Indonesia 22 22 21 23 22 19 18 17 16 16 15
Japan 0 0 0 0 0 0 0 0 0 0 0
Korea 0 0 0 0 0 0 0 0 0 0 0
Malaysia 20 19 20 22 24 22 23 23 23 23 25
Mexico 0 0 0 0 0 0 0 0 0 0 0
New Zealand 0 0 0 0 0 0 0 0 0 0 0
Papua New Guinea 0 0 0 0 0 0 0 0 0 0 0
Peru 0 0 0 2 5 4 5 4 4 5 5
Philippines 0 0 0 0 0 0 0 0 0 0 0
Russia 0 0 4 8 9 10 9 10 10 10 10
Singapore 0 0 0 0 0 0 0 0 0 0 0
Chinese Taipei 0 0 0 0 0 0 0 0 0 0 0
Thailand 0 0 0 0 0 0 0 0 0 0 0
United States 1 1 1 1 1 0 0 0 1 3 12
Viet Nam 0 0 0 0 0 0 0 0 0 0 0
W o r ld To t al 155 155 171 210 228 228 233 234 243 252 277
APEC Share 41.9% 40.7% 39.9% 38.5% 38.1% 35.4% 36.8% 35.8% 35.1% 39.4% 44.7%
Source: IEA, World Energy Balances 2018; Cedigaz, Natural Gas in the World
17APERC Gas Market Report 2019
Australia and the United States are the biggest contributors to LNG supply in the APEC region, as they
combined increased its LNG supply by 47 Mtpa (64 bcm) from 2007 to 2017, accounting for the most
of APEC’s growth in LNG supply. As mentioned, Australian liquefaction projects coming online have
led to an increase in the supply of LNG. In the United States, Cheniere’s Sabine Pass LNG project came
online in 2016, and Dominion’s Cove Point LNG project started its operation in January 2018, leading
to a boost in US LNG exports. On the other hand, LNG supply in Indonesia and Malaysia, traditional
LNG suppliers, declined and remained flat, respectively. While LNG is an important export industry in
both economies, domestic demand for natural gas has also increased in recent years thus diverting
production to their domestic markets. In fact, some LNG import terminals have already started their
operations in both economies. Russia’s LNG supply has been almost flat around 10 Mtpa (14 bcm) in
recent years. However, since the Yamal LNG project launched its operation in December 2017, adding
16.5 Mtpa of capacity, Russia’s LNG supply is likely to grow faster.
Figure 3-3 APEC LNG supply, 2007-2017
Source: IEA, World Energy Balances 2018; Cedigaz, Natural Gas in the World
3-3 Gas production outlook
Natural gas production in APEC has grown robustly over the past 10 years, led by growth in the United
States, China and Australia. US natural gas production rose from 422 Mtoe (491 bcm) in 2005 to 627
Mtoe (729 bcm) in 2016, a 49% increase, becoming the largest natural gas producer in the world (IEA,
2018a). Over the same period, China’s gas production almost tripled (178%) and Australia’s more than
doubled (131%).
18You can also read