SPECIAL REPORT 2019 FAO CROP AND FOOD SUPPLY ASSESSMENT MISSION (CFSAM) TO THE SUDAN
←
→
Page content transcription
If your browser does not render page correctly, please read the page content below
ISSN 2707-2479

SPECIAL REPORT
2019 FAO CROP AND FOOD SUPPLY
ASSESSMENT MISSION (CFSAM) TO
THE SUDAN
                           28 February 2020
SPECIAL REPORT
2019 FAO CROP AND FOOD SUPPLY
ASSESSMENT MISSION (CFSAM) TO
          THE SUDAN

             28 February 2020

FOOD AND AGRICULTURE ORGANIZATION OF THE UNITED NATIONS
                      Rome, 2020
Required citation:
FAO. 2020. Special Report - 2019 FAO Crop and Food Supply Assessment Mission to the Sudan. Rome.
https://doi.org/10.4060/ca7787en

The designations employed and the presentation of material in this information product do not imply the expression of
any opinion whatsoever on the part of the Food and Agriculture Organization of the United Nations (FAO) concerning
the legal or development status of any country, territory, city or area or of its authorities, or concerning the delimitation
of its frontiers or boundaries. Dashed lines on the maps represent approximate borderlines for which there may not yet
be full agreement. The final boundary between the Republic of the Sudan and the Republic of South Sudan has not
yet been determined. The final status of the Abyei area is not yet determined. The mention of specific companies or
products of manufacturers, whether or not these have been patented, does not imply that these have been endorsed or
recommended by FAO in preference to others of a similar nature that are not mentioned.

The views expressed in this information product are those of the author(s) and do not necessarily reflect the views or
policies of FAO.

ISSN 2707-2479 [Print]
ISSN 2707-2487 [Online]

ISBN 978-92-5-132253-6
© FAO, 2020

Some rights reserved. This work is made available under the Creative Commons Attribution-NonCommercial-ShareAlike
3.0 IGO licence (CC BY-NC-SA 3.0 IGO; https://creativecommons.org/licenses/by-nc-sa/3.0/igo/legalcode).

Under the terms of this licence, this work may be copied, redistributed and adapted for non-commercial purposes,
provided that the work is appropriately cited. In any use of this work, there should be no suggestion that FAO endorses
any specific organization, products or services. The use of the FAO logo is not permitted. If the work is adapted, then
it must be licensed under the same or equivalent Creative Commons license. If a translation of this work is created, it
must include the following disclaimer along with the required citation: “This translation was not created by the Food
and Agriculture Organization of the United Nations (FAO). FAO is not responsible for the content or accuracy of this
translation. The original [Language] edition shall be the authoritative edition.

Disputes arising under the licence that cannot be settled amicably will be resolved by mediation and arbitration as
described in Article 8 of the licence except as otherwise provided herein. The applicable mediation rules will be the
mediation rules of the World Intellectual Property Organization http://www.wipo.int/amc/en/mediation/rules and any
arbitration will be in accordance with the Arbitration Rules of the United Nations Commission on International Trade Law
(UNCITRAL).

Third-party materials. Users wishing to reuse material from this work that is attributed to a third party, such as tables,
figures or images, are responsible for determining whether permission is needed for that reuse and for obtaining
permission from the copyright holder. The risk of claims resulting from infringement of any third-party-owned component
in the work rests solely with the user.

Sales, rights and licensing. FAO information products are available on the FAO website (www.fao.org/publications) and
can be purchased through publications-sales@fao.org. Requests for commercial use should be submitted via: www.fao.
org/contact-us/licencerequest. Queries regarding rights and licensing should be submitted to: copyright@fao.org.

Cover photograph: ©FAO/Luigi Castaldi
CONTENTS
ACRONYMS AND ABBREVIATIONS���������������������������������������������������������������� vi
HIGHLIGHTS������������������������������������������������������������������������������������������������������ 2
OVERVIEW�������������������������������������������������������������������������������������������������������� 4
SOCIO-ECONOMIC CONTEXT��������������������������������������������������������������������������� 8
General�������������������������������������������������������������������������������������������������������������������������������������������������������������8
Population������������������������������������������������������������������������������������������������������������������������������������������������������10
Agriculture������������������������������������������������������������������������������������������������������������������������������������������������������10
        Irrigated agriculture�������������������������������������������������������������������������������������������������������������������������������11
        Semi-mechanized rainfed agriculture�����������������������������������������������������������������������������������������������������12
        Traditional rainfed agriculture����������������������������������������������������������������������������������������������������������������12
Livestock���������������������������������������������������������������������������������������������������������������������������������������������������������13

AGRICULTURAL PRODUCTION IN 2019/20���������������������������������������������������� 16
Main factors affecting cereal production in 2019/20���������������������������������������������������������������������������������������16
        Rainfall��������������������������������������������������������������������������������������������������������������������������������������������������16
        Agricultural finance and credit���������������������������������������������������������������������������������������������������������������20
        Agricultural inputs���������������������������������������������������������������������������������������������������������������������������������23
        Crop pests and diseases�������������������������������������������������������������������������������������������������������������������������26
        Area planted and harvested in 2019/20�������������������������������������������������������������������������������������������������27
        Crop yields��������������������������������������������������������������������������������������������������������������������������������������������30
Cereal production estimates����������������������������������������������������������������������������������������������������������������������������32
Other crops�����������������������������������������������������������������������������������������������������������������������������������������������������35
        Sesame��������������������������������������������������������������������������������������������������������������������������������������������������35
        Groundnuts�������������������������������������������������������������������������������������������������������������������������������������������36
        Sunflowers��������������������������������������������������������������������������������������������������������������������������������������������36
        Sugar����������������������������������������������������������������������������������������������������������������������������������������������������37
        Cotton��������������������������������������������������������������������������������������������������������������������������������������������������38
Livestock���������������������������������������������������������������������������������������������������������������������������������������������������������39

CEREAL SUPPLY/DEMAND SITUATION���������������������������������������������������������� 42
Crop and livestock markets�����������������������������������������������������������������������������������������������������������������������������42
Cereal supply/demand balance, 2020��������������������������������������������������������������������������������������������������������������44

RECOMMENDATIONS������������������������������������������������������������������������������������� 48

2019 CFSAM to the Sudan | 28 February 2020				                                                                                                                     iii
ACRONYMS AND ABBREVIATIONS
ABS        Agricultural Bank of Sudan
CBS        Central Bureau of Statistics
CBOS       Central Bank of Sudan
CFSAM      Crop and Food Supply Assessment Mission
DAP        Diammonium Phospate
EBA        Everything But Arms
FAO        Food and Agriculture Organization of the United Nations
FSTS       Food Security Technical Secretariat
FEWS NET   Famine Early Warning Systems Network
GDP        Gross Domestic Product
GIEWS      Global Information and Early Warning System on Food and Agriculture
GMO        Genetically Modified Organism
HAC        Humanitarian Aid Commission
ha         hectares
ILO        International Labour Organization
IMF        International Monetary Fund
LTA        Long-Term Average
mm         millimetres
MoANR      Ministry of Agriculture and Natural Resources
MoARF      Ministry of Animal Resources and Fisheries
NGOs       Non-Governmental Organizations
OIE        World Organization for Animal Health
RVF        Rift Valley Fever
SDG        Sudanese Pound
SRC        Strategic Reserve Corporation
t          tonne
UN         United Nations
UNHCR      United Nations High Commissioner for Refugees
USAID      United States Agency for International Development
USD        United States Dollar
WFP        World Food Programme
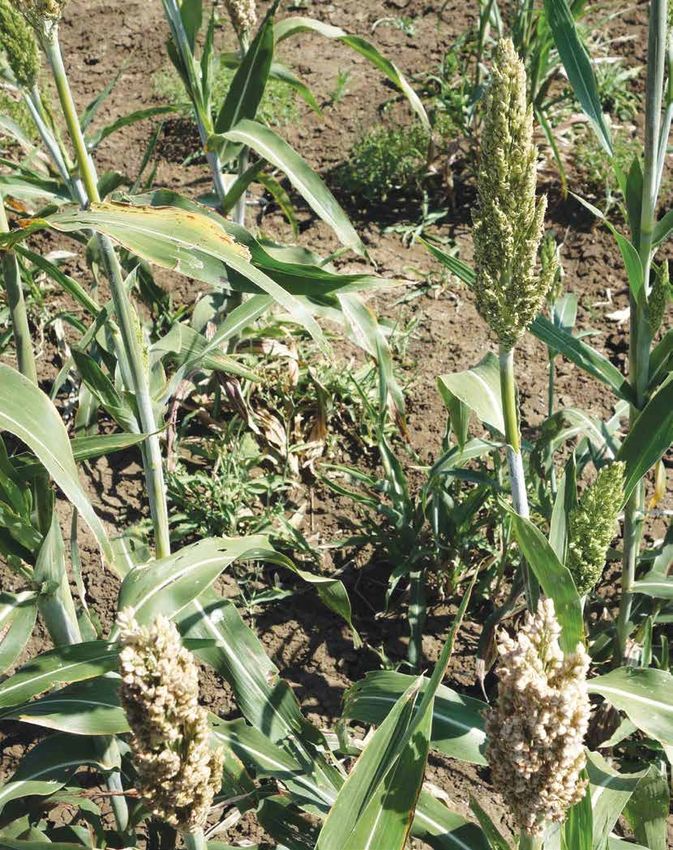
©FAO/Luigi Castaldi
HIGHLIGHTS
HIGHLIGHTS
¾¾   The national total production of sorghum and              of high and increasing inflation, which also led
     millet in 2019/20 is estimated at 5.1 million             to soaring costs of production.
     tonnes, 36 percent below the previous year’s
     record output and 18 percent less than the past      ¾¾   The incidence of pests, diseases and weeds on
     five‑year average.                                        national crop production was significantly higher
                                                               than in the previous years.
¾¾   Sorghum production is forecast at about
     4 million tonnes, 26 percent lower than the level    ¾¾   Abundant rains and improved security situations
     of the previous year and 19 percent less than             increased the availability of pastures and water
     the past five-year average. The national millet           for livestock. However, the expansion of the
     production is estimated at 1.1 million tonnes,            cropped area at the expense of pastures and
     63 percent lower than the record production of            animal routes resulted in growing conflicts
     2018 and 16 percent less than the average of              between farmers and pastoralists in some parts
     the past five years.                                      of the country.

¾¾   The decline in production is mainly due to           ¾¾   Livestock health at the time of the Mission was
     contracted cereal plantings as farmers shifted            good and no major disease outbreaks were
     to more remunerative cash crops (sesame and               observed.
     groundnuts), compounded by lower yields
     resulting from unfavourable weather conditions       ¾¾   The annual vaccination campaign was affected
     and pest infestation.                                     by severe shortages of vaccines and medicines.

¾¾   The 2019 rainy season was characterized by           ¾¾   High and increasing inflation rates have been
     an irregular distribution of rains. After an              recorded in 2019, reaching over 60 percent in
     early onset in May and long dry spells in July,           November. Food/beverage and housing sectors
     torrential rains triggered floods in August.              contributed the most to the upward trend in
     Unusual abundant precipitation was also                   the inflation rate by about 60 and 10 percent,
     recorded in September and October.                        respectively.

¾¾   Production of wheat, to be harvested in March        ¾¾   Although the official exchange rate was
     2020, is forecast at 727 000 tonnes, more than            pegged at SDG 45 per US Dollar since April
     30 percent above the previous five-year average,          2019, USD 1 was traded for up to SDG 88 as
     reflecting enlarged plantings.                            of mid‑December in the parallel market. The
                                                               weakening of the Sudanese Pound consequently
¾¾   Production of sesame and groundnuts is                    put upward pressure on prices, especially those
     estimated to have increased in 2019 to an above           of imported goods, including fuel and wheat.
     average level, on account of expanded plantings
     prompted by higher year-on-year market prices        ¾¾   Prices of locally produced sorghum (feterita)
     and strong demand for exports.                            and millet began to rise from late 2017 and
                                                               continued the increasing trend in 2019. In
¾¾   Constraints on the availability of, and                   December 2019, prices of staple grains were
     accessibility to, inputs were reported as a result        65‑130 percent higher, year on year.

2019 CFSAM to the Sudan | 28 February 2020				                                                                    2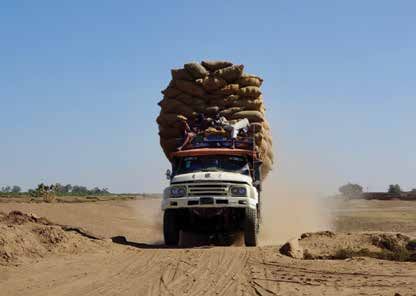
©FAO/Luigi Castaldi
OVERVIEW
OVERVIEW
Between 24 November and 14 December 2019,               production within their domains, including the
assisted by the Food and Agriculture Organization       provision of follow-up-data, where required. The
of the United Nations (FAO) and other partners,         teams cross-checked the official estimates by
the Ministry of Agriculture and Natural Resources       conducting extensive field inspections, rapid case
(MoANR) carried out its annual Assessment               studies with sample farmers and interviews with
Mission to determine crop production and food           herders and traders. The security situation generally
supply situation throughout the 18 states of the        improved compared to previous years and was
country. The Mission consisted of six core teams        less of a constraint to field observation and farmer
comprising members from the MoANR, the Food             interviews.
Security Technical Secretariat (FSTS) of the MoANR,
the Ministry of Animal Resources and Fisheries          At the national and sub-national levels, the teams
(MoARF), the Humanitarian Aid Commission (HAC),         collected the latest available information and data on
the Strategic Reserve Corporation (SRC), FAO,           rainfall amounts and distribution, vegetation cover,
FEWS NET, WFP and USAID.                                crop protection campaigns, cereal reserve stocks
                                                        and prices of the main crops and livestock. Periodic
The teams’ visits were designed to collect data         food security reports were perused and the Central
and information from the State ministries and           Bank of Sudan (CBOS), the Agricultural Bank of
irrigation schemes and to audit it through transects,   Sudan (ABS), the Central Bureau of Statistics (CBS)
field observations and interviews with farmers          and the Strategic Reserve Corporation provided the
and independent key informants. The combined            main socio-economic indicators. Rainfall data was
quantitative and qualitative information, from both     obtained from the Sudan Meteorological Authority
primary and secondary sources, allowed the teams        and from other sources in the field. Satellite
to assess the 2019 cereal (sorghum and millet)          imageries were used to review the evolution of
and other field crop production and to forecast         vegetation cover over the course of the year.
the wheat production to be harvested by March
2020. Upon returning from the field, all teams          The overall performance of the 2019/20 summer
prepared summaries of the information gathered          cropping season was below last year’s record level
for internal discussion and final inclusion in the      and below the previous five-year average, reflecting
Mission report. Data were compiled by State, crop       the contracted area planted of cereals and lower
and sub-sector (irrigated, rainfed mechanized and       yields. Although cumulative seasonal rainfall in 2019
rainfed traditional) to give the overall area and       was above average across the country and the rainy
production estimates. Using these data, a national      season was longer than usual, rains were irregularly
cereal balance sheet was drawn up comparing the         distributed: long dry spells in July and heavy rainfall
total cereal requirement for the coming marketing       in August affected crops across the country, leading
year (January December) with the domestic cereal        to high losses and to the need for repeated sowing.
availability.                                           The unusual length of the rainy season caused also
                                                        the spread of weeds and favoured a high incidence
The six Mission teams received full cooperation         of crop pests and diseases.
by the State authorities. Discussions on the
factors affecting crop and livestock conditions         Constraints to the availability of, and accessibility
were held with representatives from the local           to, agricultural inputs, such as machinery, seeds
Government offices, United Nations (UN) agencies        and fertilizers, owing to higher prices and
and Non‑Governmental Organizations (NGOs).              increasing inflation, were reported. Shortages
Field visits were supported by local specialists from   and the delayed distribution of fuel reduced the
State ministries and irrigation schemes, who also       application of herbicides, pesticides and fertilizers,
provided the latest information on all aspects of       and delayed harvesting operations, particularly in

2019 CFSAM to the Sudan | 28 February 2020				                                                                   4
semi‑mechanized areas. Many farmers resorted by stakeholders to be a major issue in animal
to the parallel market to obtain fuel or opted for production. In response to an announcement of the
manual labour to complete agricultural operations. World Organization for Animal Health (OIE) about
All these constraints increased production costs and documented cases of Rift Valley Fever (RVF) in the
lowered yields. country, Saudi Arabia, in October, banned livestock
imports from the Sudan. In January 2020, the RVF
The production of sorghum and millet in 2019/20 outbreak was declared over.
is estimated at below-average levels of 4 and
1.1 million tonnes, respectively. The overall decline Using the population projection for mid-2020 by the
in cereal production is mainly due to a reduction Central Bureau of Statistics to estimate the food use
in the area planted in favour of more remunerative in 2020, the cereal balance sheet shows that the
crops (sesame and groundnuts), compounded 2019/20 production of locally produced sorghum
by reduced yields. Some tribal clashes in Darfur and millet is expected to cover the country’s
also restricted access to agricultural land. Extreme utilization needs. In case of millet production, it
weather events, such as dry spells and torrential allows a building up of stocks, equivalent to the
rains, led to localized crop failure and reduction of food requirements for three months. With regards
the harvested area. The wheat crop, to be harvested wheat and rice, the cereals that the country mostly
in March 2020, is forecast at an above-average level depend on imports, the structural deficit between
of about 726 000 tonnes. production and consumption is expected to be
covered by the normal levels of commercial imports.
Abundant rains and the extended length of the
rainy season have improved the availability of The prices of locally produced sorghum and millet
pastures and water for livestock. However, the in most markets have been characterized by an
expansion of the cropped area at the expense upsurge during the last 12 months, essentially due
of grazing lands was reported to have blocked to the high costs of production and transportation,
herding routes, leading to conflicts between depreciation of the local currency and increasing
pastoralists and farmers. Animals were generally inflation that started at the end of 2017. In
in good condition and no major disease outbreaks December 2019, prices of sorghum and millet were
were observed during the field visits. However, from 65 to 130 percent higher than their levels of
lack of the availability of vaccines was reported one year before.
2019 CFSAM to the Sudan | 28 February 2020 5SOCIO-ECONOMIC
CONTEXT
©FAO/Luigi CastaldiSOCIO-ECONOMIC CONTEXT
General to take place in late 2022. The new Government
is facing challenges to stabilise the economy,
The country has been facing macro-economic including the high inflation rate, the depreciation
challenges since the secession of South Sudan in of the Sudanese Pound and the widening of fiscal
2011 that took three-quarters of the oil output, and external imbalances.
leaving it with half of fiscal revenues and one‑third
of export earnings. The country also suffers from The CBS estimates the country’s GDP in 2019
a lack of foreign exchange reserves, mainly due at about SDG 1 607 billion (at current prices).
to low foreign investment and limited access to According to the estimates, the agricultural sector
international financing, as well as from fiscal deficits, contributed about 20 percent to the GDP in 2019,
deriving from weak revenue collection and heavy and the contribution of the industrial and services
subsidies on fuel (as high as 8 percent of the GDP, sectors were 22 and 58 percent, respectively. In the
according to the Minister for Finance and Economic agricultural sector, the contribution to the GDP is
Planning). highest in livestock (about 60 percent), followed
by agricultural crops (about 40 percent), while the
Economic conditions significantly worsened since importance of the forestry and fishing sectors is
late 2017, following the sharp devaluation of limited to a marginal level. The GDP has grown by
the currency, as the removal of the international 1.3 percent in 2019 compared to 2.8 percent in
economic sanctions on the country increased 2018. Similarly, the contribution of the agriculture
the demand for imports and, consequently, sector to GDP growth rate has decreased from
for US dollars. This prompted high inflationary 4 percent in 2018 to 1.2 percent in 2019.
pressures and particularly an increase in prices of
imported goods, such as fuel and wheat, which At the end of the third quarter of 2019, the trade
triggered widespread protests from December balance recorded a deficit of about USD 3.7 billion,
2018 to April 2019, when the President was a 35 percent increase from last year’s level.
ousted. Five months later, a new transitional Compared to the same period in 2018, exports of
Government was swore in for a period of crude oil declined by 32 percent, in value terms,
39 months, until the general elections planned due to lower year-on-year international prices. By
Table 1: The Sudan - Exports of crop products, 2018 and 2019
2018 20181/ 20191/
Crop/product Weight Value Weight Value Weight Value
(tonnes) (‘000 USD) (tonnes) (‘000 USD) (tonnes) (‘000 USD)
Cotton (bales) 111 134 159 481 77 892 111 859 88 660 124 823
Gum Arabic 76 394 112 766 55 939 81 543 64 598 82 169
Sesame 704 568 576 155 396 239 370 692 390 826 495 509
Sugar 1 206 2 003 - - 6 473 2 738
Groundnuts 80 768 59 846 59 620 43 532 230 438 155 198
Sorghum 141 152 27 149 118 979 23 159 153 246 32 649
Hibiscus flowers 12 568 15 461 9 626 11 993 6 713 7 934
Watermelon seeds 92 220 61 324 74 149 49 335 60 830 38 208
Source: CBOS.
1/
1 January-30 September.
2019 CFSAM to the Sudan | 28 February 2020 8contrast, imported quantity of petroleum products made imported goods more expensive. Imports
increased significantly, by more than 60 percent, of other food items, such as dairy products and
following the sustained domestic demand for oil. vegetables, were similar to 2018, with a notable
With regard to agricultural commodities, exports exception for imports of animal and vegetable oils
in volume terms in the January-September period that recorded a sharp increase.
were 26 percent higher than the same period
last year. Most notably, exports of groundnut After reaching a record high of 73 percent in
quadrupled both in volume and value terms, with December 2018, when the increase in prices of
an increased demand from China (Mainland) and bread (from SDG 1 to SDG 3) prompted protests,
Indonesia. Exports of sorghum rose by 30 percent the inflation rate dropped sharply in January 2019 in
in volume terms compared to the first nine months response to the Government’s decision to revoke the
of 2018, following the favourable harvest in price increase. Then, inflation increased throughout
2018/19. With regard to sesame, exports in value the year and was over 60 percent in November
terms were higher than a year earlier, mainly due 2019 (Figure 1). According to the CBS, food and
to higher international prices. Exports of hibiscus beverages as well as the housing sectors were the
flower and watermelon seeds contracted year on main drivers of the upward trend of inflation, by
year, despite increased harvests in 2019, mainly 61 and 11 percent, respectively, reflecting higher
due to strong domestic demand. While imported prices of inputs, mostly imported goods. High
quantity of wheat products (grain and flour) in the inflationary pressures have contributed to diminish
three quarters of 2019 were similar to the same the purchasing power of consumers and farmers,
period in 2018, imports in value terms increased by resulting in lower access to food and agricultural
45 percent, due to the weaker local currency that inputs.
Figure 1: The Sudan - Inflation rate (percent) and official exchange rate (SDG for USD 1)
80 50
45
70
40
60
35
50
30
SDG per USD 1
Percentage
40 25
20
30
15
20
10
10
5
0 0
Feb-18
Sep-18
Feb-19
Sep-19
Jan-18
Jul-18
Jan-19
Aug-18
Jul-19
Aug-19
Oct-18
Oct-19
Mar-18
Mar-19
Dec-17
Apr-18
May-18
Jun-18
Dec-18
Apr-19
May-19
Jun-19
Nov-17
Nov-18
Nov-19
Official exchange rate Inflation rate
Source: Central Bureau of Statistics (for inflation rate) and Central Bank of Sudan (for exchange rate).
2019 CFSAM to the Sudan | 28 February 2020 9The upsurge of inflation was triggered by the currency earned to the Bank at the official exchange
sharp devaluation of the Sudanese Pound (SDG) rate, which is far lower than in the parallel market.
from SDG 7 to SDG 18 per US Dollar in January Secondly, the Government extended the oil deal
2018 (and to SDG 47.5 in October) to narrow the with South Sudan until March 2022, which will
increasing gap with the parallel exchange rates. In allow South Sudan to use Sudanese pipelines to
the parallel market, the Sudanese Pound weakened reach the port of Port Sudan to export crude oil. In
following the lift of international sanctions on exchange, the Sudan will receive USD 24 or USD 26
the country in October 2017, which increased per barrel of oil transported. Also, South Sudan will
the demand for US dollars. Although the official supply a refinery facility in the Sudan with 28 000
exchange rate was pegged at SDG 45 per US Dollar barrels of crude oil per day. Lastly, the Government
since April 2019, USD 1 was traded for up to is resorting to foreign aid and has already secured
SDG 88 as of mid December 2019 in the parallel the commitment of USD 3 billion and 540 000
market. The weakening of the Sudanese Pound tonnes of wheat from Saudi Arabia and the United
also exerted upward pressures on prices, especially Arab Emirates in April 2019 and EUR 466 million
those of imported goods, including fuel, wheat from the European Union in October 2019.
and agricultural inputs. Furthermore, the political
uncertainty in 2019 prevented the country from
attracting foreign investments, taking advantage of Population
the depreciation of the Sudanese Pound. The CBOS
The last Population and Housing Census was carried
estimates that foreign investments during the three
out in 2008 and, since then, the CBS extrapolates
quarters of 2019 were about 13 percent lower than
the country’s population size using specific
the same period in 2018, with a negative effect on
growth rates at State level. The total population in
economic growth.
mid‑2020 is officially forecast at 44.4 million. The
most populated states are Khartoum (19 percent of
In an effort to restore economic stability, the new
the total population), Gezira (12 percent) and South
Government agreed, with the World Bank and the
Darfur (9 percent). As of January 2020, the UNHCR
International Monetary Fund (IMF), to implement
estimated the number of refugees and asylum
an economic reform in October 2019. Although
seekers residing in the country at 1.1 million, among
the details still need to be negotiated, the reform
which 811 000 are from South Sudan. Although
is expected to address the liberalization of the
the UNHCR estimates that 1.9 million Sudanese are
exchange rate, the revenue mobilization, the gradual
still internally displaced, there has been a steady
phasing out of fuel subsidies and the enhancement
trend of returns over the past years as the armed
of the business environment by adopting
confrontation in Darfur has subsided.
anti‑corruption measures and improving governance,
as identified by the IMF during the visit carried out
in December 2019. The new Government already Agriculture
made an attempt to reduce fuel subsidies in the
2020 budget, but the manoeuvre was not successful The economy of the Sudan is highly dependent
as a coalition of opposition political groups disagreed on agriculture, which occupies an estimated
with the proposal. 43 percent of its labour force (ILO estimates of
2019) and accounts for about 30 percent of its GDP
The Government’s other measures to stabilise the (World Bank). Its crop portfolio is quite diversified,
economy include the following: Firstly, in January including cereals (such as sorghum, millet, wheat,
2020, the Government plans to allow private traders rice and maize), oilseeds (sesame, groundnuts and
to export gold, which was exclusively traded by sunflowers), industrial crops (cotton and sugarcane),
the Central Bank. However, the new regulation fodder crops (alfalfa, fodder sorghum and Rhodes
stipulates that mining companies sell 30 percent grass), pulses (broad beans and pigeon peas) and
of the gold production to the Central Bank (while horticultural crops (okra, onions, tomatoes, citrus,
exporting the rest 70 percent) and sell any foreign mango, etc.).
2019 CFSAM to the Sudan | 28 February 2020 10Moreover, land in the Sudan is suitable for animal Preferences devised to assist the economies of the
husbandry, with an estimated total livestock Least Developed Countries. The difference between
population in 2019 of about 119 million heads of the Sudan’s annual domestic sugar requirement and
cattle, sheep, goats, camels and others. the sum of its production and imports allows the
country to export substantial amounts.
Crop production in the Sudan is practiced under
three main patterns: Until the 1980s, the Sudan was a major cotton
producer, frequently exporting more than 1 million
1. Irrigated agriculture, which includes: bales (227 kg) per year. Cotton production has
¾¾ Large national irrigation schemes (Gezira, declined dramatically since then due to a significant
Suki, New Halfa and Rahad) using river flow reduction in planted area. However, in 2016
from the Nile and its tributaries. and 2017, high international prices and highly
productive improved seeds provided a new impetus
¾¾ Large spate irrigation schemes (Gash and
to the sector that is now facing a renewed growth.
Tokar) using seasonal floods.
¾¾ Small-scale irrigation along the banks of the Irrigated agriculture
Nile and its tributaries. The area under irrigation in the Sudan is estimated
2. Semi mechanized rainfed agriculture. at about 1.68 million hectares (4 million feddans).
3. Traditional rainfed agriculture. Large scale mechanized federal schemes account
for about 1.26 million hectares (3 million
Crop production in the rainfed sectors exhibits very feddans), including the Gezira Scheme which,
wide annual fluctuations as a result of unreliable at approximately 1 million hectares (2.38 million
rainfall amounts and distribution, which can result feddans), is one of the largest irrigation schemes in
in late sowing, long dry spells, flooding from intense the world. As yield expectations are more reliable,
downpours, the necessity to re-sow and, not the irrigated sector is the principal user of imported
uncommonly, complete crop failure. The situation agricultural inputs. Crop yields in the Federal
in the irrigated sector, however, is much more Irrigated schemes remain low by world standards,
predictable. Nevertheless, viewed globally, yields are largely due to the poor maintenance and silting up
generally low in all sectors for various reasons as well of canals, the shortage of efficient modern pumps
as rainfall. These include, inter alia, a shortage of and the adoption of traditional agricultural practices
efficient, well-maintained farm machinery, a shortage that do not allow to make the most efficient use
of credit and working capital, the use of low yielding of the constant water resource and exploit the full
crop varieties with scarce availability of improved potential of more intensive farming.
seeds, inadequate maintenance of irrigation canals,
inefficient irrigation pumps and poor agricultural Irrigation water is mainly obtained from the River
practices such as weed and pest control. Nile and its tributaries by means of gravity or pumps,
or from spate flow from seasonal rivers at Gash and
Regarding commercial crops, the country is the Tokar deltas. The principal crops of the irrigated sector
third major producer of sugarcane in Africa, after include sugar cane, cotton, sorghum, groundnuts,
Egypt and South Africa, with a total planted area wheat, vegetables, fruits and green fodders. According
of about 82 000 hectares. The country is also a to the season, the sector also takes advantage of
significant importer of sugar, especially from India rains, especially during the establishment of summer
and Thailand. Unlike India and Thailand, and other crops. For example, rain is estimated to provide about
major sugar producers such as Brazil, the Sudan 40 percent of the water requirements of crops on the
is allowed, as part of the Everything But Arms Suki Irrigation Scheme. Rain is especially important for
(EBA) agreement, to export unlimited amounts of reducing production costs on privately-owned irrigated
its own sugar production to the European Union smallholdings along the banks of the Nile and its
without paying taxes. The EBA is a component tributaries that depend on diesel-powered pumps.
of the European Union’s Generalized Scheme of In recent years, several large private enterprises
2019 CFSAM to the Sudan | 28 February 2020 11have emerged, producing fodder crops such as standing crop to pastoralists for grazing.
alfalfa and Rhodes grass for export, mainly to the
Gulf countries. These enterprises are usually highly Traditional rainfed agriculture
mechanized, use efficient irrigation systems such as The traditional rainfed sector covers about 9 million
centre pivots and other forms of sprinkler irrigation hectares and occupies the largest number of
and generally achieve high yields of good quality farmers. The sector is made up of small family units
fodder. farming from 2 to 50 hectares for both income
and subsistence. On the larger units, there may
Semi-mechanized rainfed agriculture be a modicum of mechanization in the form of
Semi mechanized rainfed agriculture is so called land preparation, but most operations are carried
because mechanization is usually limited to land out manually. The traditional sector predominates
preparation and seeding. Other field operations, in the west of the country, in Darfur and in much
including harvesting, are usually carried out of Kordofan State, where the main cereal crops
manually, although combined harvesting is are millet and sorghum. Input levels are low and
becoming less rare. Semi mechanized rainfed yields are especially vulnerable to unfavourable
agriculture is practiced in a broad belt of 6.7 million rainfall. Other important crops in this sector include
hectares and receives, on average, more than groundnuts, sesame, hibiscus (karkadé), watermelon
500 mm of rainfall annually. It runs through and Gum Arabic.
Kassala, Gadarif, Blue Nile, Sennar, White Nile and
South Kordofan states. This belt is effectively the
granary of the country, with sorghum accounting Livestock
for about 80 percent of the cultivated land and
usually producing about 45 percent of the country’s Livestock is raised in almost all parts of the country
requirements. Other crops include sesame, and animals are owned primarily by nomadic tribes.
sunflowers, millet and cotton. In 2019, the livestock population was estimated
at about 109 million heads, comprising about
Farms in the semi-mechanized sector are frequently 31 million cattle, 40 million sheep, 32 million
very large, even above 50 000 hectares. Given goats and 4.9 million camels (Table 2). Pastoralists
the erratic nature of rainfall and, therefore, the in the Sudan efficiently use natural resources,
possibility that yields could be very low, the system moving herds around the country in response to
may be considered as opportunistic and operations weather conditions and availability of forage. The
are carried out as economically as possible. Standard major problem faced by pastoralists is the loss of
crop varieties are sown using wide disc seeders with rangeland to mechanized farming. The traditional
up to 30 discs and no fertilizer is applied. If the rains practice of farmers allowing herds to graze crop
are favourable, yields of up to 1 tonne/hectare can residues, with animals simultaneously fertilizing
be achieved, otherwise crops may be sold off as a land, is declining as farmers prefer to sell their
Table 2: The Sudan - Estimates of livestock population, 2019
Livestock Quantity (‘000 heads)
Cattle 31 489
Sheep 40 896
Goats 32 032
Camels 4 895
Total 109 312
Source: MoARF.
2019 CFSAM to the Sudan | 28 February 2020 12residues for cash. Clashes between pastoralists and 2018. This is due to a ban on importing livestock
farmers are common, even in years of good rainfall, from the Sudan by the Saudi Arabian Ministry
prompting the Government to set up committees in of Environment, Water and Agriculture as a
each State to resolve disputes. response to the announcement of the OIE about
documented cases of RVF.
Livestock accounts for about 60 percent of
the Sudan’s agricultural GDP. Exports of sheep, Compared with live animal exports, meat exports
mainly to Saudi Arabia, are reported at about were relatively modest with a total value of about
2.8 million heads in the first nine months of USD 36 million (Table 3). The country exports also
2019. In the same period, around 90 000 camels considerable quantities of animal hides. In the
were exported mainly to Egypt. About 112 000 first nine months of 2019, a total value of about
goats were exported in the same period of 2019 USD 7 million of fresh hides were exported.
with a marked decline of about 60 000 heads in
Table 3: The Sudan - Exports of live animals and hides and skins, 2018 and 2019
January-September 2018 January-September 2019
Livestock
Quantity Value Quantity Value
(heads) (‘000 USD) (heads) (‘000 USD)
Sheep 2 663 664 337 258 2 854 741 373 496
Goats 178 237 13 151 112 452 11 986
Cattle 61 563 38 360 65 169 53 483
Camels 141 902 156 707 90 173 119 439
Hides and skins - 12 349 - 7 687
Meat (tonnes) 12 091 50 500 - 36 219
Source: CBOS.
2019 CFSAM to the Sudan | 28 February 2020 13AGRICULTURAL
PRODUCTION IN 2019/20
©FAO/Luigi CastaldiAGRICULTURAL PRODUCTION IN 2019/20
Main factors affecting cereal the Long-Term Average (LTA). Compared to 2018,
rainfall volumes were similar or just slightly higher
production in 2019/20 in the states of Kassala, Gezira, Gadarif and West
Darfur, while they were about 20-30 percent higher
Rainfall in the states of Blue Nile, Sennar, North Kordofan,
With rainfed agriculture accounting for about South Kordofan, and North and South Darfur.
90 percent of the area under cultivation in the
Sudan, rainfall is the most important driver of The rainy season was characterized by exceptionally
national food crop production. Precipitation is high cumulative amounts of rain, but with irregular
crucial also in the irrigated sector as it supplements distribution in space and time. The early onset
irrigation water and supports crop establishment of the rains in May, over all key producing areas,
and development. and adequate precipitation received in June, were
followed by long dry spells in July and torrential
In all the key cropping areas of the country, rains in August. Unusual abundant precipitation
cumulative rainfall between June and November was also recorded in September and October, with
2019 was between 50 and 100 percent above occasional showers until November.
Figure 2: The Sudan - Cumulative rainfall comparison in selected states
1400
+5% +24%
+31% +8%
1200 +24%
+17%
+46%
+5% +44% -3% +15% +29% +47% +69%
1000 +71%
+25% +41%
800 +73% +77% +71%
+99%
+75%
600
400
200
0
Gezira Gadarif Kassala Blue Nile Sennar White Nile North Kordofan South Kordofan North Darfur West Darfur South Darfur
2018 2019 LTA
Source: FAO/GIEWS.
2019 CFSAM to the Sudan | 28 February 2020 16The early onset of the rains in May (Figure 3: left) the exceptions of Blue Nile, Sennar and East Darfur
improved overall soil moisture, bringing water states, where rains continued at average levels, in
content to suitable levels for land preparation. most cropping areas of the country precipitation
Adequate rains in June fostered some early sowing ceased in July (Figure 3: centre). In North, West
of sesame, groundnuts and millet in the Great Darfur and South Darfur, during most of July a prolonged
Region. In early July, under overall favourable weather dry spell negatively impacted the establishment of
conditions, typical planting operations began to take millet, the local main food crop, and sesame and
place across most of the country. However, with groundnuts were replanted in substitution.
Figure 3: The Sudan - Precipitation anomaly: Relative difference to LTA dekads
Difference to LTA
< -80%
< -60%
< -40%
< -20%
< -10%
Normal
> 10%
< 20%
> 40%
> 60%
> 80%
LTA=0
desert
Source: FAO/GIEWS. Conforms to UN World map, February 2019.
Millet and sesame crops were severely affected not able to financially sustain the extra costs of
by dry weather conditions also in White Nile seeds and labour needed to replant crops. The
and West Kordofan states and in eastern parts dry spell also affected some rainfed areas in key
of South Kordofan State, where the dry spell cereal producing states of Kassala, Gezira and
lasted up to three weeks. In the region of Barah Gadarif (Figure 4). In the northern part of Gadarif
of North Kordofan State, no rains were received State, planting activities had to be interrupted and
for four weeks. Several smallholder farmers were postponed.
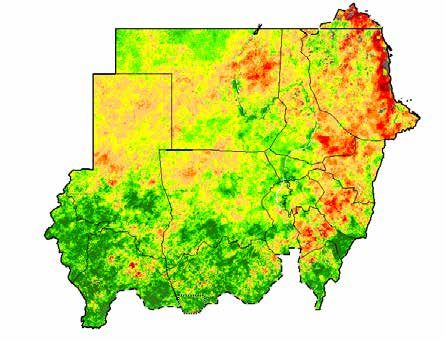
Figure 4: The Sudan - Vegetation Health Index, July 2019
VHI
< 0.15
0.15 - 0.25
0.25 - 0.35
0.35 - 0.45
0.45 - 0.55
0.55 - 0.65
0.65 - 0.75
0.75 - 0.85
> = 0.85
missing
clouds
snow
Source: FAO/GIEWS. Conforms to UN World map, February 2019.
2019 CFSAM to the Sudan | 28 February 2020 17Following dry weather conditions, agricultural After the extreme variability of July and August,
activities were affected also by exceptionally heavy rainfall was consistently above average for the
rains in August. In Gadarif and Gezira states, remainder of the season, registering record
planting was further delayed due to floods and cumulative levels during both September and
waterlogging. Some of the early sown sorghum October, when normally rains taper off and subside
and sesame crops had to be replanted or replaced (Figure 3: right). The late-season heavy rains had a
by short cycle crops such as watermelon. Crops beneficial impact on late planted crops, but it also
in White Nile State were particularly affected by favoured the spread of diseases, weeds and pests.
flooding, with about 300 000 hectares reported to Owing to farmers’ limited control capacity, the
be damaged in the traditional rainfed sector. About negative impact on yields was severe in several cases,
60 000 hectares of sesame and 30 000 hectares particularly for sorghum crops that were replanted
of sorghum were replanted in Sennar and Kassala at the end of August. The unusual October rains
states, respectively. In the New Halfa Scheme, (Figure 5) were received when most crops were at
nearly 60 000 hectares of sorghum, groundnuts milling stage, when grains begin forming and filling
and cotton, 15 percent of the total area planted, and are more prone to pest attacks. The excess
were severely damaged. Farming operations were moisture favoured the spread of Sorghum midge,
disrupted and crops damaged in Blue Nile, South which led to total crop failure in several fields. In
Kordofan and West Kordofan states. Heavy rains in addition, the excessive late season rains delayed
August also hit the Darfur Region, affecting crops, harvesting operations and reduced the quality of
causing damage to key infrastructure, destroying sorghum, by darkening the colour of the grains, and
farms and killing animals. groundnuts, by favouring the growth of mould.
Figure 5: The Sudan - Rain distribution in Sennar State
Sennar
100
90
80
70
60
50
40
30
20
10
0
1 2 3 1 2 3 1 2 3 1 2 3 1 2 3 1 2 3 1 2 3 1 2 3 1 2 3 1 2 3 1 2 3 1 2 3
Jan Feb Mar Apr May Jun Jul Aug Sept Oct Nov Dec
LTA 2018 2019
Source: FAO/GIEWS.
Despite the impact of erratic rains, the performance waterlogging due to the lack of efficient drainage
of the irrigated sector in 2019 was better than in systems. Finally, the heavy rains of September and
2018. Normally, rainfall assists in the establishment October contributed to reduce to a minimum level
of crops, which reduces the burden on the irrigation the use of irrigation.
system in July and August, while in September and
October the required amount of water is supplied by In the Gezira and Suki schemes, where silting of
a number of scheduled irrigations. While the effects canals has significantly reduced the efficiency of
of the prolonged dry spell in July were mitigated by irrigation systems, rains played a crucial role in
irrigation, the flooding in August led to widespread providing sufficient water for crops. Shortages of
2019 CFSAM to the Sudan | 28 February 2020 18water were reported especially at the beginning mesquite trees were reported to be obstructing
of the season and at the final end of the canals. several canals in both Gash and Tokar schemes.
For winter crops, which are entirely dependent
on irrigation, major complications are expected if In New Halfa and Rahad schemes, on the other
de‑silting of canals is not carried out. hand, regular maintenance of canals ensured
efficient irrigation in 2019. In Rahad Scheme, two
In the Gash Scheme, which uses river floodwaters, old pumps were replaced and five pumps were
flooding began early in the season and was repaired. Nevertheless, the drainage system has yet
characterized by a stable and persistent water to be completely rehabilitated and water logging in
flow. The total amount of water received in 2019 August could not be avoided. After the heavy rains
was 1 750 million cubic metres, an increase of in irrigated areas of White Nile State, some pumps
35 percent compared to the previous season and were reported to be entirely under water and large
169 percent compared to the LTA. However, due to fields of cereals and horticultural crops were severely
fuel shortages at the beginning of the season and affected.
to the lack of financial resources, only 30 percent of
the canals were properly cleaned, reducing the total While the irregular but abundant seasonal rains
area potentially irrigable with available water. In the hindered agricultural operations in several areas and
Tokar Scheme, the amount of floodwater was good, resulted in severe drought and flood-induced crop
but inadequate maintenance and inefficient flood losses, they were largely beneficial for pastures and
control measures resulted in the leakage of water for the replenishments of water points for livestock
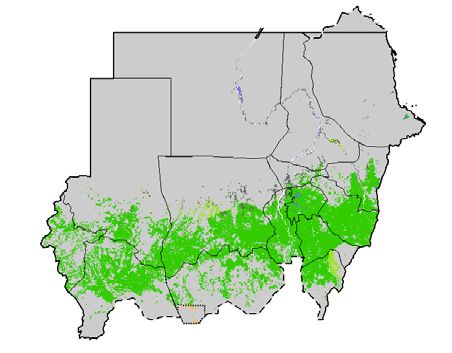
away from the target area. In addition, invasive (Figure 6).
Figure 6: The Sudan - Agricultural Stress Index Grassland, September 2019
ASI (%)
< 10
10 - 25
25 - 40
40 - 55
55 - 70
70 - 85
>= 85
off-season
no data
no season
no crop land
Source: FAO/GIEWS. Conforms to UN World map, February 2019.
2019 CFSAM to the Sudan | 28 February 2020 19Agricultural finance and credit farmers in the Rahad scheme and credit was not The provision of short-term agricultural credit granted. through the ABS is a regular procedure in both the irrigated and the rainfed sectors, but more Short-term seasonal loans to eligible farmers are particularly in the entrepreneurial semi-mechanized made through the interest-free salam system by rainfed sector. Loans for cereal production are the ABS. Under the salam system, bank charges usually accessed by entrepreneurs who have strong are levied in kind, at a value fixed jointly at planting business connections with the ABS and other time by the Ministry of Finance, the SRC, the ABS banks. On the other hand, most farmers in the and the farmers’ associations. In 2019, the salam traditional sector are either not sufficiently informed programme was still not available in West, Central about the procedures to borrow or unable to raise and North Darfur states, where small scale farmers do the collateral required to obtaining a loan. Farmers not meet the ABS minimum required standards and with poor repayment records, with insufficient risk is considered to be too high. On the other hand, collateral and loan defaulters from the previous the salam system was available for the first time in year are excluded by the banks. In addition, South and East Darfur states with a total amount most commercial banks prefer to finance harvest paid of about SDG 8 million. In East Darfur State, only operations, especially for sesame, while few banks groundnut production was reported to be financed, offer finance for land preparation and planting while in South Darfur State, sorghum, sesame and operations, thus constraining increases in plantings. millet producers were able to access the programme. Micro credit is generally available for small scale traditional farmers through livelihood support The 2019 salam prices for the different crops across programmes managed mainly by NGOs, particularly the country were generally higher than those of a in Darfur Region. year earlier, reflecting high inflation (Table 4). During the fieldwork, some farmers reported that However, the 2019 salam price was considered plots in the Rahad Scheme that were considered too low by farmers due to increasing production too far from the main canals were not financed by costs owing to the soaring inflation and to higher the ABS due to the higher risk of water shortages. market prices at harvest time. Also, the price While some farmers producing cotton in the Suki paid for sorghum at auction in December was and Gezira schemes received all needed agricultural SDG 1 800/90 kg in Gadarif and SDG 2 000/90 kg inputs through private companies, with a pre in Kassala, equivalent to twice the salam. The set selling price for the final production, some sesame price in Kassala was SDG 4 300/45 kg, more companies failed to reach the final agreement with than double the salam price. Table 4: The Sudan – Salam prices for different crops in 2018 and 2019 (SDG) Crop 2018 2019 Red sesame (45 kg) 750 1 750 White sesame (45 kg) 800 2 000 Millet (90 kg) 700 1 200 Millet (90 kg) 300 600 Sorghum (90 kg) 500 1 000 Wheat (90 kg) 1 850 2 500 Source: CFSAM. 2019 CFSAM to the Sudan | 28 February 2020 20
The total sum of agricultural finance provided to              approximately 2.7 million hectares, almost
the agricultural sector in the 14 states visited at            90 percent was in the semi‑mechanized rainfed
the time of the Mission was SDG 6 470 million,                 sector, 6 percent in the irrigated sector and
more than double the amount in 2018, 24 percent                2 percent in the traditional rainfed sector (Table 6).
in kind and 76 percent in cash. Beneficiaries                  Although the total amount provided by the ABS
were about 44 000, about 20 percent more                       was higher than in 2018, the area financed did
than in 2018 (Table 5). The area financed was                  not change, owing mainly to the increased cost

Table 5: The Sudan - Finance to agriculture by the ABS and number of beneficiaries for
summer crops, 2017, 2018 and 2019
                                    2017                             2018                               2019
State                    Finance                         Finance                             Finance
                                       Beneficiaries                    Beneficiaries                      Beneficiaries
                       (million SDG)                   (million SDG)                       (million SDG)
Eastern regions             1 021           18 032          1 681            6 668              2 419            8 975
Sennar and Blue Nile         499             3 773             645           3 756              1 888            3 486
White Nile                   154              963              173            950                325                 964
North Kordofan                 46            2 314              41          11 447               181             9 146
South Kordofan                 96            2 393              66           1 214               234             1 574
Gezira                       266            10 277             367          12 322              1 146           18 692
Darfur                         22             268                2            405                118                 996
River Nile                     20             166                4             n.a.                27                 96
Khartoum                        3                9             0.4             n.a.                 6                 16
Main Branch                  164                14             162              25               126                   9
Total                       2 316           38 352          3 143           36 787              6 470           43 954

 Source: ABS.

Table 6: The Sudan - Area financed for summer cropping by sector, 2017, 2018 and 2019
                                           Areas financed (‘000 hectares)                           Areas financed in
State
                              2017                     2018                     2019                    2019 (%)
Gezira                        2 478                    2 524                   2 392                        88.8
Darfur                           56                       55                          95                       3.5
River Nile                       76                     229                      152                           5.6
Khartoum                         10                       26                          13                       0.5
Main Branch                     172                       71                      53                           2.0
Total                         2 829                    2 753                   2 693                       100.0
 Source: ABS.

2019 CFSAM to the Sudan | 28 February 2020				                                                                             21
of inputs and agricultural operations. According provided to the Ministry of Irrigation for irrigation
to data collected at the beginning of the summer system rehabilitation activities.
season, sorghum farmers received 75 percent
of the total finance, while cotton and sunflower Regarding the winter cropping season, the total finance
accounted for 10 and 11 percent, respectively provided up to December 2019 was SDG 2 190 million,
(Table 7). An additional SDG 700 million were of which 96 percent was granted to the irrigated sector.
Table 7: The Sudan – Amount of finance provided by the ABS by crop (August 2019)
Total finance Crop financed
Crop
(million SDG) (%)
Sorghum 3 160 75.4
Cotton 424 10.1
Sesame 21 0.5
Sunflowers 460 11.0
Groundnuts 57 1.4
Fodder 0.15 0
Horticulture 65 1.6
Sugar cane 0.77 0
Legumes 0.48 0
Total 4 189 100
Source: CFSAM.
2019 CFSAM to the Sudan | 28 February 2020 22Agricultural inputs it from Port Sudan or Khartoum, bearing the high
Fuel, seeds, fertilizers, herbicides, labour and transportation costs.
agricultural machinery are the main inputs to
crop production. The Mission’s findings indicate Fuel shortages at the beginning of the season
that, owing to an overall upsurge of prices, the were reported at the Gash Irrigation Scheme,
application of most agricultural inputs was generally where, as a consequence, machines could clean
lower compared to the previous year. By contrast, only 30 percent of the canals, and at the Rahad,
contracted cotton growers were provided with all New Halfa and Sennar schemes, where, however,
necessary inputs. availability improved over the rest of the season. In
Kassala, several re-plantings following crop failures
Despite the Government’s efforts to meet the needs further increased the need for fuel, limiting the fuel
of the agricultural sector, fuel shortages and delays availability for planting operations of onion and
in fuel deliveries were reported in several areas of other vegetables.
the country. A mid-season assessment, carried out
by the MoARN, showed that the amount of fuel In White Nile, and in North, West and South
supplied in 2019 for land preparation, planting and Kordofan states, the lack of fuel provided by the
weeding was 36 percent of the total requirements, Government was particularly severe at harvest
while it was 52 percent in 2018 (Table 8). To time. In addition, tanks for storing large quantities
mitigate the impact of fuel shortages, farmers were of fuel were unavailable in many localities limiting
forced to purchase it on the parallel market, paying to a minimum the local autonomy and forcing to
three to four times the official price or to purchase continuous supply. Most of the farmers had to resort
Table 8: The Sudan - Fuel required/received for land preparation, planting and weeding,
mid-September 2019 (‘000 m3) 1/
Required
State Land preparation Received Percent
Weeding Total
and sowing
North Darfur 3.9 1.3 5.2 1.8 35
South Darfur 10.0 3.4 13.4 4.0 30
Centre Darfur 2.3 0.8 3.1 0.4 14
East Darfur 8.2 2.8 11 0.8 7
West Darfur 2.8 0.9 3.7 0.4 10
North Kordofan 7.1 2.4 9.4 3.4 36
South Kordofan 22.5 7.5 30.0 9.2 31
West Kordofan 8.3 2.8 11.1 2.9 26
West Nile 10.2 3.4 13.6 9.9 73
Blue Nile 14.2 4.8 19.0 9.1 48
Sennar 17.3 5.8 23.2 10.1 43
Gezira 6.4 2.2 8.6 3.2 38
Gadarif 34.7 11.6 46.3 15.2 33
Kassala 12.7 4.2 16.9 6.8 40
Total 160.5 53.8 214.3 77.3 36
Source: State ministries of Agriculture.
1/
Irrigated schemes have different arrangements and are not included.
2019 CFSAM to the Sudan | 28 February 2020 23to the black market, where prices increased up to Improved seeds are used mostly in irrigation schemes
40 percent between the preparation and cultivation and by some farmers in the semi‑mechanized rainfed
starting in July and the November harvest. sector, while their adoption in the traditional rainfed
sector remains negligible.
No particular shortages were reported in Greater
Darfur, where traditional agricultural practices Prices of seeds at the beginning of the season
prevail and fuel requirements are lower, in the states were at very high levels. In Kassala State, the
of Red Sea and Gezira and in Tokar Scheme. price of sorghum seeds in July was SDG 20/kg for
traditional varieties and SDG 80/kg for improved
The majority of farmers use seeds retained from the varieties, about 43 percent higher than in 2018
previous year or purchased from the local markets. for both. In Blue Nile State, the increase was of
Seed purity is often low and the productivity of 140 percent, with improved seed costing in July of
the traditional varieties is decreasing year by year. about SDG 48/kg (Table 9).
Table 9: The Sudan - Prices of sorghum seeds in various locations (SDG/kg)
Price
State
2019 2018 Percent change
Kassala 20-80 14-56 43
Gash 18 17 5
New Halfa 54 25 116
Tokar 60 45 25
Blue Nile 48 20 140
North Kordofan 24 8 200
South Kordofan 28 28 36
West Kordofan 30 23 30
White Nile 50 30 67
Source: CFSAM (field visits).
Millet seeds were traded at about SDG 40‑60/kg, and Butana varieties) and 195 tonnes were millet
almost twice the levels of July 2018, while groundnut (Table 10). Compared to 2018, the delivered quantities
seeds (Sodari and Gibaish varieties) were sold at declined by 56 percent. The shortage of seeds was
SDG 57/kg, twice their year-earlier levels. Prices of severe where farmers had to replant multiple times.
sesame seeds, cotton and vegetables were also higher In the Darfur State, most seeds were provided by the
than a year earlier. For example, sesame seeds were international organizations and NGOs. In some parts
traded in July at SDG 100-150/kg, 50 percent more of East Darfur State, seeds were delivered late, after
than 12 months earlier. Watermelon seeds were sold feasible planting dates, and are expected to be stored
at SDG 75/kg, 60 percent more than the previous and used in the 2020 cropping season.
year. The price of wheat seeds was SDG 45/kg, more
than double the price paid in 2018. In 2019, FAO distributed crop and vegetable seeds,
agricultural tools and other inputs to smallholder
In 2019, the total quantity of seeds delivered by farmers (Table 11). The total quantity of crop seeds
MoANR to the agricultural State ministries in 14 states distributed amounted to 2 077 tonnes. In addition,
amounted to 1 941 tonnes of which 1 544 tonnes 89 602 kg of vegetable seeds and 128 808 hand
were sorghum (Arfa Gadamak, Wad Ahmed, Tabat tools were distributed.
2019 CFSAM to the Sudan | 28 February 2020 24You can also read