The Last Drop: Climate Change and the Southwest Water Crisis - Frank Ackerman Elizabeth A. Stanton February 2011
←
→
Page content transcription
If your browser does not render page correctly, please read the page content below
The Last Drop:
Climate Change and the Southwest Water Crisis

                             DROUGHT IN THE DROPLETS, PLACERVILLE, CA/ FLICKR/EILEEN McFALL (OUTLIER)

                      Frank Ackerman
                    Elizabeth A. Stanton
          Stockholm Environment Institute-U.S. Center

                       February 2011
The Last Drop: Climate Change and the Southwest Water Crisis
Copyright © 2011 by the Stockholm Environment Institute
This publication may be reproduced in whole or in part and in any form for
educational or non-profit purposes, without special permission from the
copyright holder(s) provided acknowledgement of the source is made. No use
of this publication may be made for resale or other commercial purpose,
without the written permission of the copyright holder(s).
For more information about this document,
contact Frank Ackerman at frank.ackerman@sei-us.org
Stockholm Environment Institute - US
11 Curtis Avenue
Somerville, MA 02144-1224, USA
www.sei-us.org and www.sei-international.org
This project was funded by a grant from the Kresge Foundation.
Acknowledgements:
The authors wish to acknowledge the research and technical work done by Synapse Energy Economics
Inc., and Ellen Fitzgerald, Marion Davis and Janani Balasubramanian of the Stockholm Environment
Institute – U.S. Center.
Copies of this report and two accompanying documents, California Water Supply and Demand: Technical
Report and The Water-Energy Nexus in the Western States: Projections to 2100, may be downloaded at
http://www.sei-us.org/publications/id/371.
2The Last Drop: Climate Change and the Southwest Water Crisis
Table of Contents
EXECUTIVE SUMMARY ............................................................................................................ 4
1. Climate Change and the Southwest‟s Water Crisis .................................................................... 9
The water and climate crisis ..................................................................................................... 10
Future water supplies ............................................................................................................ 10
Climate, agriculture, and irrigation ....................................................................................... 11
Increased costs for water ....................................................................................................... 12
The Southwest as a whole ......................................................................................................... 12
2. To the Last Drop: Unsustainable Water Mining ....................................................................... 14
3. California: A Case Study of Unsustainable Water Use ............................................................ 16
4. Southwest Water Use: Farms and Homes ................................................................................. 19
5. Solutions: How to Make a Big Enough Difference .................................................................. 24
Solution #1: Increase the water supply ..................................................................................... 25
Solution #2: Additional groundwater extraction....................................................................... 26
Solution #3: Planned reductions to water use ........................................................................... 26
Energy adaptation ................................................................................................................. 26
Urban adaptation ................................................................................................................... 27
Agricultural adaptation ......................................................................................................... 27
Solution #4: Unplanned reductions to water use ...................................................................... 28
6. The Bottom Line: Failing to Act is the Most Expensive Option .............................................. 29
References ..................................................................................................................................... 31
3The Last Drop: Climate Change and the Southwest Water Crisis
EXECUTIVE SUMMARY
At present, without climate change, the Southwest is relying on the unsustainable withdrawal of
groundwater reserves to meet today‟s demand; those reserves will be drained over the next
century as population and incomes grow. With climate change, the Southwest water crisis will
grow far worse. Continuing the current trend in global greenhouse-gas emissions will make the
cost of the next century‟s projected water shortage at least 25 percent higher. Adaptation
(conservation and efficiency) measures, however, have the potential to greatly lower water use
throughout the region. As climate change exacerbates water woes, some adaptation will be
essential to stave off unplanned water shortages and restrictions. Bringing the Southwest‟s water
use down to sustainable levels will necessitate either very strong residential adaptation measures,
or a combination of strong agricultural adaptation measures (including the elimination of some
low-value crops) and moderate residential measures.
Climate Change and the Southwest’s Water Crisis
In the U.S. Southwest – Arizona, California, Nevada, New Mexico, and Utah – there is less rain
and snowfall each year than the amount of water used in the region. Today that shortfall is made
up for by pumping groundwater, well beyond the sustainable rate. Add the impacts of growing
population and incomes, and the Southwest will face a major water crisis in the coming decades.
And that‟s the prediction before considering the effects of climate change. With rising
temperatures, a bad situation will become still worse. All sectors increase their water use as
temperatures climb, but none more than agriculture. Even with mild climate change – now
considered a certainty by the scientific community – farmers will need more water to produce
crops and livestock. With the more serious temperature increases likely to result from current
trends in world greenhouse gas emissions, demand for agricultural water will clash with other
uses.
This report offers an integrated picture of the effects of climate change on water supply, demand,
and scarcity in the Southwest as a whole. For this analysis we developed three new intersecting
models of water and climate change: a detailed depiction of California‟s supply and demand for
water; a regional model of agricultural water use, and a regional model of water and electricity
generation.
Our analysis differs from other studies in three fundamental respects. First, we focus on state-
level interactions of water supply and demand, and, for water use and agriculture, on county-
level data to provide a greater depth of insight than sweeping regional generalizations and a
better overview than extremely detailed studies of local areas. Second, we make the (obviously
overly optimistic) simplifying assumption that all water can be freely transported anywhere
within a state; this allows for abstraction from questions of water conveyance and focuses our
study on changes in water supply and demand with climate change. Third, we extend the analysis
to cover a full century of climate change and water use in order to see the difference between a
high-emission and a low-emission climate scenario – that is, to understand the difference that
climate policy can make in the world that we will leave to our descendants.
4The Last Drop: Climate Change and the Southwest Water Crisis
To the Last Drop: Unsustainable Water Mining
Water demand in the Southwest will outstrip water supply in the near future. Throughout the
region, groundwater supplies 35 percent of water use, and the Colorado River supplies another
18 percent; in Arizona, groundwater plus the Colorado River amount to 90 percent of water use.
Both sources are being used at a rate that cannot be sustained.
Figure ES-1 forecasts the Southwest‟s future water use under a “baseline” scenario of current
climate conditions combined with expected population and income growth; and under two
climate-change scenarios, comparing a mild (B1) and more severe (A2) climate forecast.
Figure ES-1: Southwestern States' Projected Groundwater Extraction, 2010 to 2110
2,253
Southwest 1,043 260 1,555 282 157
Shortfall
9
Arizona 214 110 259 403 Shortfall
24
California 398 150 1,046 151 76 1,423 Shortfall
16
Nevada 162 163 221 Shortfall
42 Current Renewable
14 32 Current Overdraft
New Mexico 184 83 Shortfall
37 Baseline Growth
24 B1 Climate
Utah 85 71 123 Shortfall
A2 Climate
28
0 500 1,000 1,500 2,000 2,500 3,000 3,500
Millions of Acre Feet
Note: Shortfall = sum of all groundwater use, beyond the renewable (blue) level, under A2 climate assumptions.
At today‟s rates of water use, the Southwest is projected to use 1,303 million acre feet of
groundwater in the 100 years starting in 2010 (the blue plus green segments of the top bar in
Figure ES-1); of this a conservatively estimated 260 million acre feet would be overdraft (shown
in green). Adding only baseline growth of population and income, the Southwest‟s shortfall of
water (green plus yellow in Figure ES-1) reaches 1,815 million acre feet. Using B1 climate
assumptions, the Southwest‟s shortfall grows to 2,096 million acre feet (green, yellow, and
orange). Under A2 climate assumptions – which are likely if current trends in global greenhouse
gas emissions continue – the shortfall reaches 2,253 million acre feet (adding the red segment).
California: A Case Study of Unsustainable Water Use
More than half of the region‟s current and projected groundwater withdrawals take place in
California. There are no up-to-date studies, and two very different estimates, of the state‟s
groundwater reserves. Even on the more optimistic estimate, California would need three times
the available groundwater to get through the next century. Unless adaptation measures are taken
to reduce California‟s water use, 7 out of 10 years will require water restrictions or additional
(above current levels) overdraft by 2030, and every year will have a water shortfall by 2050.
5The Last Drop: Climate Change and the Southwest Water Crisis
We modeled the Pacific Institute‟s adaptation scenarios for California‟s urban and agricultural
water use. Their slow urban adaptation scenario involves a 15 percent reduction from
conservation and efficiency, and a 20 percent price increase by 2030; slow agricultural
adaptation means 5 percent reduction in water use plus a 10 percent price increase by 2030. The
savings from slow urban and agricultural adaptation, combined, are not enough to reduce
California‟s water use to the sustainable level, even without the impacts of climate change.
Figure ES-2: California's Projected Groundwater Extraction plus Shortfall, 2010 to 2110
100 years at Current Rates
Renewable Overdraft Remaining Storage
1,423
No Adaptation 1,594 151 76 Shortfall
Slow Adaptation 966 130 63 762 Shortfall
30
Slow Urban,
540 101 274 Shortfall
Fast Agriculture
Fast Urban,
123 104 57
Slow Agriculture Baseline Growth
6 B1 Climate
Fast Adaptation 44
1 A2 Climate
0 200 400 600 800 1,000 1,200 1,400 1,600 1,800 2,000
Millions of Acre Feet
Note: Baseline growth (yellow) now includes renewable and overdraft (shown as blue and green in earlier figures).
Shortfall is total water use, under A2 climate assumptions, minus renewable (blue line).
Fast adaptation includes reductions in water use of up to 41 percent, and price increases of 41
percent for urban and 68 percent for agricultural users by 2030. Fast adaptation in one or both
sectors is required to bring California‟s water use in line with available supplies. Fast urban
adaptation, which has a bigger effect, is necessary to bring water use down to a renewable level.
Southwest Water Use: Farms and Homes
California is by far the top agricultural state in the nation; 1 percent in the Southwest. Yet nearly
four-fifths of the region‟s water is used for agriculture.
Southwest agricultural products vary greatly in profitability, and in the revenues they earn per
unit of water. An astonishing 42 percent of the region‟s agricultural water (and more than 90
percent in Utah and Nevada) is used to grow hay, a low-value product; however, hay is an input
to the dairy and cattle industry. We calculated the sales revenue per acre foot of water for crops
in each state, including water for hay as part of the dairy and cattle industry‟s water use.
The top crops, in value per unit of water, are nursery and greenhouse products, earning $28,000
per acre foot for the region as a whole, and more than $35,000 in California. They are followed
by vegetables, and then by fruits and nuts, with sales above $1,000 per acre foot in most cases.
Dairy and cattle (including water for hay) brings in about $900 per acre foot for the region, more
than $1,200 in California, but less than $250 in Utah and Nevada. Other crops – such as cotton,
6The Last Drop: Climate Change and the Southwest Water Crisis
wheat, corn, rice, and other grains – have low values, under $500 per acre foot in most cases.
The average for all crops is $1,200 for the region, and $1,360 for California.
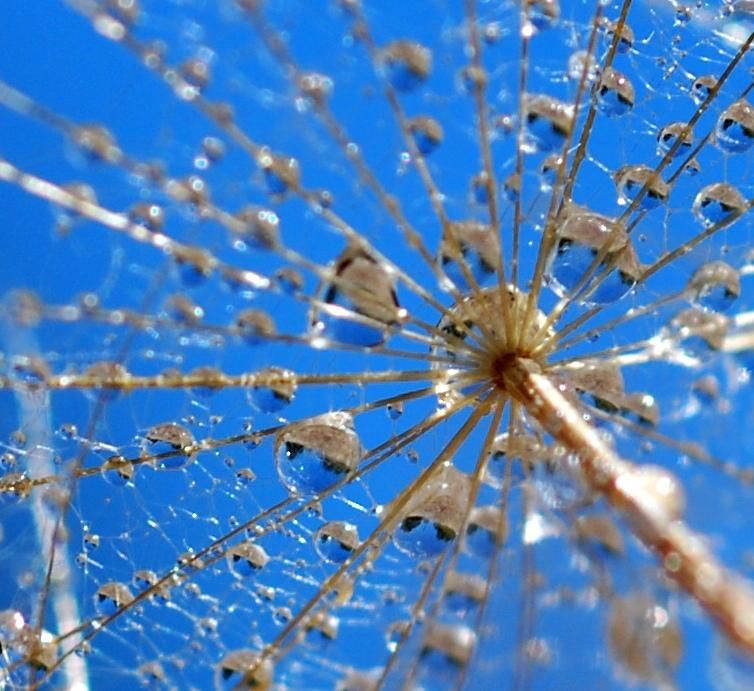
Figure ES-3: Value of crops per acre foot of water, California and Southwest average
$121
Other crops and hay Southwest
$149
$172 California
Rice
$172
$290
Corn
$202
$217
Other grains, oilseeds, dry beans/peas
$209
$341
Wheat
$263
$337
Cotton and cottonseed
$386
$878
Dairy, cattle (including water for hay)
$1,262
$1,370
Fruits, tree nuts, and berries
$1,393
$2,254
Vegetables, melons, sweet potatoes
$2,226
$28,265
Nursery, greenhouse, floriculture, sod
$35,479
$1,199
Average for all crops
$1,360
Urban use also varies widely; Nevada has the highest per capita domestic use in the nation,
followed by Utah. Economic and population growth trends imply that urban water use will grow
faster than agricultural water, making reductions in domestic water use of great importance.
Solutions: How to Make a Big Enough Difference
There are four possible solutions to the gap between water supply and demand. First, supply
could be increased through imports or desalination. None of the neighboring states, however,
are able to export significant amounts of water. Ocean desalination is potentially inexhaustible,
but it is expensive and has been plagued with start-up problems. The true cost of the planned San
Diego and San Francisco/Marin County plants may be $2,600 - $2,700 per acre foot.
Second, additional groundwater could be extracted. While the exact size of groundwater
reserves is uncertain, the amounts that would be needed are far above the best estimates of
available supply. The natural recharge rate is slow; planned recharge can increase reserves to
some extent, especially in wet years, but climate change may make this option more difficult to
pursue.
7The Last Drop: Climate Change and the Southwest Water Crisis
Third – and the only viable solution – there can be planned reductions in water use. In our
energy modeling, we found that water constraints may shape the future energy system, but the
amounts of water that can be saved in the energy sector are too small to contribute much to the
solution to the regional water crisis. Water use will have to be reduced in the urban and
agricultural sectors, the dominant users at present and in the future. The ambitious reductions
called for in the fast adaptation scenarios are needed; slow adaptation would postpone but not
solve the problem.
Among other areas for reduction, many farmers are growing crops worth less than $100 per acre
foot of water use, and half of all agricultural water is used to grow crops worth less than $1,200
per acre foot. Some farmers, in other words, could make more selling water than using that same
water to grow crops; water users in the Southwest, however, rarely have the right to sell their
water. Eliminating the lowest value-per-unit-water crops (excluding hay) would lower
agricultural water use by 24 percent, while reducing farm sales by less than 5 percent.
The final approach to water shortages is the least desirable: if nothing else happens, there will be
unplanned shortages and draconian restrictions on water use.
The Bottom Line: Failing to Act is the Most Expensive Option
The cumulative water shortfall for the Southwest for the next century, without adaptation, will be
1,815 million acre feet under current climate conditions, plus 282 million acre feet due to the B1
climate scenario or 439 million acre feet due to the A2 scenario. What would it cost to buy this
much water, if it were for sale? We used a low price based on the cost of building new reservoirs
and distribution systems in California, $1,252 per acre foot, and a high price based on a study of
the average cost of water delivery in municipalities in the region, $2,211 per acre foot.
At these prices, the shortfall under current climate conditions costs $2.3 trillion to $4.0 trillion.
The B1 climate scenario adds $350 to $620 billion; the A2 scenario adds $549 billion to $970
billion. At the higher price, A2 climate change turns a $4 trillion problem into a $5 trillion one.
On an annual basis, we project that by 2050, the increased water shortfall will cost $7 billion to
$15 billion, or 0.3 to 0.6 percent of the region‟s GDP in 2009. For 2100, we project costs at $9
billion to $23 billion, or 0.4 to 0.9 percent of regional GDP in 2009. For comparison, several past
studies have estimated the climate-induced increase in water resource costs at $7 billion to $60
billion per year by mid-century, or 0.1 to 0.9 percent of the most recent year‟s GDP, for the
country as a whole.
The bottom-line question about water is not whether adaptation is difficult or expensive,
compared to doing nothing. Rather, it should be compared to buying several trillion dollars worth
of water over the next century; adaptation is a bargain that the region cannot afford to ignore.
The implication for climate policy is similar: although doing something about greenhouse gas
emissions is expensive, doing nothing would cost even more. Among the benefits of global
emission reduction is a savings of hundreds of billions of dollars in the future cost of water, or
the avoidance of water scarcity, in the five states of the Southwest.
8The Last Drop: Climate Change and the Southwest Water Crisis
1. Climate Change and the Southwest’s Water Crisis
In the U.S. Southwest – Arizona, California, Nevada, New Mexico, and Utah – there is less rain
and snowfall each year than the amount of water used in homes, businesses, farms, and for
environmental purposes. Today that shortfall is made up for by pumping groundwater, and in at
least two states, Arizona and California, the stock of groundwater is falling every year. Add the
higher water use that comes with growing population and incomes, and the Southwest is
expected to face a major water crisis in the coming decades. As the century progresses,
groundwater reserves will run dry, and current trends in water use cannot possibly be continued.
And that‟s the prediction before considering the effects of climate change. With rising
temperatures, a bad situation will become still worse. All sectors increase their water use as
temperatures climb, but none more than agriculture. Even with mild climate change – now
considered a certainty by the scientific community – farmers will need more water to produce
crops and livestock. With the more serious temperature increases likely to result from current
trends in world greenhouse gas emissions, demand for agricultural water will clash with other
uses.
Climate change will lead to degraded conditions in other areas as well. In Southwestern forests,
hotter, drier conditions are already leading to worsening wildfires and pest outbreaks. In
California, under a scenario of “business-as-usual” emissions (A2), wildfires could increase by
100 percent or more by the end of this century (California Natural Resources Agency 2009). A
study of eleven Western states found strong correlations between high temperatures, low
precipitation, and wildfires (McKenzie et al. 2004). Even under the milder B2 climate scenario,
that study found that by late in this century, the mean area burned by wildfires could increase by
a factor of 1.4 to 5 in most states, with the largest increases in Utah and New Mexico.
A warmer climate also gives an advantage to plant pests and pathogens, which can be as
devastating to forests as wildfires. Rising temperatures increase insect survival rates, accelerate
their development, allow them to expand their range, and reduce trees‟ capacity to resist attack
(Bentz 2008). In 2003, after prolonged drought and heat, more than 10 million acres of forests in
the U.S. West were ravaged by bark beetles (USDA Forest Service 2004).
Other species will be harmed as well. Climate change will result in warmer freshwater
temperatures and changes in seasonal stream flows, which are projected to cause sharp
reductions in salmon populations and increased risks of extinction of some subpopulations; this
is an important issue for northern California (Yates et al. 2008) as well as the Northwest.
Despite air conditioning and other forms of protection, human beings are not immune to rising
temperatures. The California heat wave of July 2006 caused hundreds of deaths and thousands of
hospitalizations and emergency room visits (Ostro et al. 2009; Knowlton et al. 2009). Rising
temperatures are projected to increase the frequency of similar or worse heat waves in California
(Cayan et al. 2009). In addition, climate change may worsen regional air quality in the summer
and fall, a problem for both human health and agriculture (Leung and Gustafson 2005).
9The Last Drop: Climate Change and the Southwest Water Crisis
Water-dependent economic sectors in general may fare badly as temperatures rise and –
according to at least some climate projections – the Southwest sees less precipitation on average.
Two sectors dominate freshwater use in the Southwest: together, urban uses (residential and
commercial users) and agriculture account for all but 2 percent of the region‟s water. Numerous
studies have analyzed the impact of climate on Southwest water, but most focus on broad climate
trends, or on detailed results for small areas or individual economic sectors. The new research
presented in this report focuses instead on seeing the whole picture: the effects of climate change
on water supply, demand, and scarcity for all major water uses, in each state and in the
Southwest as a whole.
The water and climate crisis
A great deal is already known about water and climate change in the Southwest. For our
purposes, the following are some of the most important findings:
Climate change will worsen the region‟s water crisis even if, as some models predict,
there is no change in total annual precipitation.
Agriculture in the Southwest is almost completely dependent on irrigation; the greatest
climate risk to agriculture is not the direct effect of temperature or precipitation on crops,
but the potential lack of water for irrigation.
Published estimates of the costs of climate impacts on water resources are in the tens of
billions of dollars annually for the United States as a whole, or about $1 billion each for
California and for the Colorado River basin.
Future water supplies
Climate change is already causing measurable and unfortunate impacts on water supplies. The
mountain regions of the West are experiencing reduced snowpack, warmer winters, and stream
flows coming earlier in the calendar year. Since the mid-1980s, these trends have been outside
the past range of natural variation, but consistent with the expected effects of anthropogenic
(human-caused) climate change (Barnett et al. 2008). In the past, snowmelt gradually released
the previous winter‟s precipitation, with significant flows in the summer when demand is
highest. The recent climate-related shift means that water arrives, in large volume, earlier in the
year than it is needed. As a review of this problem observes,
There is not enough reservoir storage capacity over most of the West to handle this shift
in maximum runoff and so most of the „early water‟ will be passed on to the oceans.
(Barnett et al. 2005, p. 305)
California‟s water supply is critically dependent on the extent of snowpack and timing of
snowmelt in the Sierra Nevada. Total annual precipitation in the state may remain roughly
unchanged as the climate continues to change – but warmer winter temperatures will cause
earlier snowmelt, and will transform some winter precipitation from snow to rain. This will shift
streamflow toward the winter and spring months, moving peak water flows earlier by as much as
a month. Climate models show that higher greenhouse gas emissions under the IPCC‟s A2
10The Last Drop: Climate Change and the Southwest Water Crisis
scenario, compared to the lower-emission B1 scenario, will worsen all of these trends (Maurer
2007). California‟s biannual assessments of climate change explore these and related climate
trends (e.g. Cayan et al. 2009), drawing on detailed studies of watersheds and regions within the
state (e.g. Purkey et al. 2008 on the Sacramento River Basin).
For the Colorado River, the principal source of surface water for the interior states of the
Southwest and parts of southern California, the impacts of climate change will be even more
severe, likely including a decline in runoff and streamflow throughout the river basin
(Christensen and Lettenmaier 2007).While there is large year-to-year variation in river flows, the
average is expected to decline; climate change is likely to cause larger and more frequent
shortfalls in scheduled water deliveries, with shortfalls occurring in most years by 2050 (Barnett
and Pierce 2009).
Climate, agriculture, and irrigation
In the past, many analysts believed that the early stages of climate change would be good for
U.S. agriculture, thanks to the fertilization effect of increased CO2 concentrations and the benefit
of longer growing seasons in colder regions (U.S. Global Change Research Program 2000).
Recent research, however, has led to sharply reduced estimates of the benefits of carbon dioxide
fertilization (Leakey et al. 2009; Long et al. 2006; Cline 2007).
Studies of California agriculture and climate change have reached ambiguous conclusions – as
long as water for irrigation is assumed to remain abundant. One study projects an increase in
California farm profits due to climate change, with gains for some crops and losses for others,
assuming that current policies, and the availability of irrigation, are unchanged (Costello et al.
2009). Perennial crops such as fruits and nuts are of great importance in California; individual
crops differ widely in the impacts of climate on yields (Lobell et al. 2007). Among six leading
California perennial crops, climate change through 2050 is projected to decrease yields in four
cases, and to cause no significant change in the other two – again, assuming that irrigation
remains unchanged (Lobell et al. 2006).
In contrast, a study of climate and California agriculture that focuses on the growing scarcity of
water projects a drop in irrigated acreage and a shift toward higher-value, less water-intensive
crops (Howitt et al. 2009). An analysis of potential water scarcity in California due to climate
change estimates that there will be substantial costs in dry years, in the form of higher prices
and/or shortfalls, to Central Valley agriculture and to South Coast urban areas (Hanemann et al.
2006).
Economic analysis has shown that the value of California farmland is closely linked to the
amount of available irrigation water, but not to temperature or precipitation (Schlenker et al.
2007). It is often suggested that climate change will increase irrigation requirements, since dry
areas of the world will generally tend to become even drier (Tubiello et al. 2007). On the other
hand, a study of climate change and irrigation in California‟s San Joaquin Valley concluded that
the early stages of climate change could lead to roughly constant irrigation requirements in that
region, since higher temperatures mean crops will need more water per day, but also that they
will grow to maturity in fewer days (Hopmans and Maurer 2008).
11The Last Drop: Climate Change and the Southwest Water Crisis
Increased costs for water1
A handful of studies have estimated the costs of climate-induced changes in water supply at a
national level (Cline 1992; Titus 1992; Fankhauser 1995; Hurd et al. 1999; Hurd et al. 2004;
Backus et al. 2010). While taking very different approaches to the question, they have come up
with broadly similar answers: by the middle of this century, climate change will increase the
annual costs of water supply by $7 billion to $60 billion, or 0.1 to 0.9 percent of U.S. GDP in the
year when the study was conducted.
A study of the impact of climate change on California water users, based on a relatively dry
climate scenario, projects water shortfalls of 17 percent of demand by mid-century (Medellín-
Azuara et al. 2008). On average, water deliveries to agriculture will fall by 24 percent, and to
urban users by 1 percent. The annual costs of climate-related water scarcity could amount to $1
billion, including $300 million of lost agricultural production.
For the Colorado River basin, an already arid region where climate change may cause a decrease
in precipitation, runoff, and streamflow, water shortages will become routine and energy
production may be cut by 18 percent by the 2080s (Christensen and Lettenmaier 2007). Differing
climate scenarios imply annual losses to the river basin of $1.2 billion to $1.4 billion (Hurd et al.
1999) – similar to the estimate for California, but representing a larger burden on a smaller
economy.
The Southwest as a whole
The goal of this analysis is to understand the impacts of climate change on the water problems of
the Southwest as a whole. It differs from other studies in three fundamental respects.
First, our analysis is carried out at a mid-level of complexity and detail, focusing on state-level
interactions of water supply and demand, and, for water use and agriculture, on county-level
data. This provides more depth of insight into the problem than sweeping regional
generalizations; it may also provide a better overview than extremely detailed studies of local
areas. The wealth of data now available in geographic information systems (GIS) databases,
combined with downscaled forecasts from major climate models, has allowed a proliferation of
local studies relevant to water and climate change. Yet the mass of detail can draw attention to
the individual trees rather than the forest; GIS analyses can include data for thousands of distinct
locations within a state. County-level data represents California as 58 “points” on the map –
more accurate than using one or two points for the entire state, and more comprehensible than
using thousands.
Second, we ignore the numerous legal and physical obstacles to the distribution of water within
states. The laws governing water rights in the Southwest are byzantine in their complexity, and
allow some low-value uses of water to continue while others would gladly pay much higher
prices for the same water, if it were available for purchase. The physical barriers of long
distances and mountainous terrain often block transportation of water within a state, although
1
This section is based on the helpful summary in Hurd and Rouhi-Rad (2011).
12The Last Drop: Climate Change and the Southwest Water Crisis
elaborate canals and aqueducts do move large amounts of water from northern to southern
California, and from the Colorado River to the much higher elevation of central Arizona. The
analysis in this report makes the (obviously unrealistic) simplifying assumption that all water can
be freely transported anywhere within a state. Thus the balance between water supply and
demand presented here is unrealistically optimistic: it is the balance that would exist if all legal
and physical obstacles to intrastate water transport could be removed. It is all the more sobering
to realize that, even on that optimistic basis, there is a vast potential shortfall in the region‟s
future water supplies.
Third, we extend the analysis into the future, to cover a full century of climate change and water
use. It is understandably common for discussion to be restricted to shorter time horizons, such as
2050. The limited attention spans and compressed electoral cycles of the political process impose
a bias toward the very short run in policy debate. The year 2050, after all, is many elections and
administrations from now; for many purposes, it is the long run. Yet the dynamics of climate
change require a look at the even longer run. The earth‟s climate has immense inertia, and
changes only gradually; the impacts of climate change over the next 20 years are virtually fixed,
determined almost entirely by the past history of greenhouse gas emissions. To see the difference
between a high-emission and a low-emission climate scenario – that is, to understand the
difference that climate policy can make in the world that we will leave to our descendants – it is
necessary to look well past mid-century.
This report presents the results of three intersecting models of water and climate change in the
Southwest, all newly developed with funding from the Kresge Foundation. Two separate
background papers describe these models and their full results in detail. The first (Stanton and
Fitzgerald 2011) describes two models designed by the Stockholm Environment Institute – U.S.
Center: a detailed depiction of California‟s supply and demand of water; and a model of water
used in agriculture in the five-state region, with results for each state. These models are built on
county-level climate projections, water modeling and agricultural data. The second (Fisher and
Ackerman 2011) discusses a model, designed by Synapse Energy Economics Inc. in consultation
with SEI-U.S., of water used in electricity generation throughout the Western states. All three
models estimate water use and/or constraints under baseline conditions as well as under two
projections of climate change over the next 100 years.
These models, together with additional projections of future water use for Arizona, Nevada, New
Mexico and Utah, show water demand outstripping water supply in the near future – implying an
unsustainable drawdown of groundwater that could dry up wells long before the end of the
century. Recall that this result is obtained under the simplifying assumption that, within each
state, freshwater can be transported anywhere without cost or delay. The results presented in this
report, therefore, represent a “best case” with regard to the real-world difficulties of water
distribution. In fact, geography, infrastructure limitations, and an intricate web of water rights
mean that water cannot be transported everywhere and anywhere within a state‟s boundaries.
Even with a very optimistic view of the potential for improvements in water distribution over the
next century, water transportation will continue to be costly and constrained.
Because climate projections disagree about the future of Southwest precipitation, all three
models incorporate the conservative assumption that average annual precipitation will remain
13The Last Drop: Climate Change and the Southwest Water Crisis
constant; replacing this assumption with a decrease in average precipitation over time would, of
course, tend to exacerbate the water crisis. The county-level modeling results – not shown in this
report – that are the base unit of this analysis reveal far greater disparities than do state-level
results; aggregation across states promotes this study‟s goal of seeing the forest for the trees, but
disguises areas of extremes where the climate and water crisis looms even larger.
2. To the Last Drop: Unsustainable Water Mining
More than a third of all freshwater used in the Southwest comes from groundwater reserves; in
Arizona and New Mexico, half the water is pumped from under the ground. In the five
Southwest states, 19 million acre feet (6 trillion gallons) of groundwater are used every year (see
Table 1).
Stocks of groundwater are refreshed very slowly – far more slowly than today‟s rates of
extraction. How much groundwater is available, and how long can this pace of groundwater
pumping continue? Very little precise information exists to estimate the amount of water stored
underneath the Southwest. California – with the most detailed water systems analysis in the
region – says repeatedly in its publications that a “comprehensive assessment” of the state‟s
groundwater basins has not been conducted since 1980.2 Estimates from just two states,
California and Arizona, suggest that groundwater use exceeds the renewable level by at least 2.6
million acre feet per year; the true regional tally of unsustainable groundwater use may be much
larger.
Table 1: Southwest groundwater extraction, 2005
Southwest Arizona California Nevada New Mexico Utah
Total water use (MAF) 55.6 7.0 36.8 2.7 3.7 5.4
Total groundwater use (MAF) 19.4 3.4 12.0 1.1 1.9 1.0
Groundwater as a share of total use 35% 49% 33% 41% 50% 18%
Source: U.S. Geological Survey (2009), http://water.usgs.gov/watuse/data/2005/.
Table 2: Colorado River use rights, 2005
Southwest Arizona California Nevada New Mexico Utah
Colorado River use rights (MAF) 10.1 2.9 4.4 0.3 0.9 1.7
Use rights as a share of total use 18% 41% 12% 11% 23% 31%
Source: Southern Nevada Water Authority (n.d.), http://www.snwa.com/html/wr_colrvr_apportion.html; U.S.
Geological Survey (2009).
Rights to Colorado River water account for another 18 percent of these states‟ water use,
although the actual amount withdrawn varies in any given year (see Table 2).3 In Arizona,
Colorado River water makes up two-fifths of the supply. Negotiators of the 1922 “Colorado
River Compact” estimated the river‟s average annual flow to be 17 million acre feet, but more
2
California Department of Water Resources (2009), http://www.waterplan.water.ca.gov/docs/cwpu2009/.
3
Southern Nevada Water Authority (2009).
14The Last Drop: Climate Change and the Southwest Water Crisis
recent estimates of the long-range average Colorado River flow range from 9.1 to 14.3 million
acre feet annually (Woodhouse et al. 2006). Rights to Colorado River withdrawals from the five
Southwest states together with Colorado, Wyoming, and annual deliveries to Mexico total 16.5
million acre feet per year. Reservoirs along the Colorado River are gradually being sucked dry
by annual withdrawals that are not being replaced by rainfall.
Tables 1 and 2 together show that groundwater plus Colorado River water rights account for
more than half of the region‟s water use, rising to nearly three-quarters in New Mexico and nine-
tenths in Arizona. Both of these major sources of water are being used beyond the sustainable
level. Surface water is already used fully throughout the region, though there is some room for
improvements in efficiency (such as reducing water delivery losses). Population and income
growth are expected to increase Southwest water use dramatically over the next 100 years. And
climate change will deepen the crisis, as hotter temperatures lead to greater withdrawals,
particularly for agriculture.
More water can be extracted from underground stocks, but these reservoirs are finite and are
already shrinking every year. Current groundwater extraction can be divided into two parts:
renewable use and overdraft. Groundwater is renewable up to the level of “recharge” –
precipitation that percolates in through the soil. Overdraft, or the net reduction in groundwater
storage, is groundwater extracted over and above average annual recharge rates. Two states –
Arizona and California – estimate that their current use of groundwater exceeds the annual rate
of recharge (by 1.1 and 1.5 million acre feet, respectively); the same is likely true of New
Mexico, although no estimate exists of this state‟s rate of overuse. Nevada and Utah attest that
their current groundwater use matches the rate of recharge.4
Figure 1 forecasts the Southwest‟s future water use under three scenarios: first, with current
temperatures and current trends of population and income growth (called “baseline growth”), and
then adding (on top of baseline growth) increased temperatures due to mild (B1) and more severe
(A2) assumptions about climate change. The total “shortfall” labeled in this figure is the current
rate of overdraft extended for 100 years combined with increases to water use from population
growth, income growth, and the more severe (A2) scenario for climate change.
4
Arizona Department of Water Resources (2010); California Department of Water Resources (n.d.); Ivahnenko and
Flynn (2010); Southern Nevada Water Authority (2009); New Mexico Office of the State Engineer (2009);
Longworth et al. (2008); Utah Division of Water Resources (2001– note that Utah‟s water supply, as defined by the
state, is reduced here by the 4.69 MAF used for environmental purposes); Wyoming Water Development
Commission (2007; n.d.).
15The Last Drop: Climate Change and the Southwest Water Crisis
Figure 1: Southwestern States' Projected Groundwater Extraction, 2010 to 2110
2,253
Southwest 1,043 260 1,555 282 157
Shortfall
9
Arizona 214 110 259 403 Shortfall
24
California 398 150 1,046 151 76 1,423 Shortfall
16
Nevada 162 163 221 Shortfall
42 Current Renewable
14 32 Current Overdraft
New Mexico 184 83 Shortfall
37 Baseline Growth
24 B1 Climate
Utah 85 71 123 Shortfall
A2 Climate
28
0 500 1,000 1,500 2,000 2,500 3,000 3,500
Millions of Acre Feet
Note: Shortfall = sum of all groundwater use, beyond the renewable (blue) level, under A2 climate assumptions.
Source: Authors’ calculations. For California, Stanton and Fitzgerald (2011).
At today‟s rates of water use, the Southwest is projected to use 1,303 million acre feet of
groundwater in the 100 years starting in 2010 (the blue plus green segments of the top bar in
Figure 1); of this a conservatively estimated 260 million acre feet would be overdraft (shown in
green). Taking into consideration only baseline growth of population and income, the
Southwest‟s shortfall of water (today‟s overdraft plus additional water needed beyond today‟s
annual rates, or green plus yellow in Figure 1) reaches 1,815 million acre feet over the 100-year
period. Using the B1 climate assumptions – the least climate change that is still thought to be
possible – the Southwest‟s shortfall grows to 2,096 million acre feet (green, yellow, and orange).
Under the A2 climate assumptions – the temperature increase expected if the current trend in
global greenhouse gas emissions continues – the shortfall reaches 2,253 million acre feet (adding
the red segment). This shortfall must be met either from increases to supply (perhaps the most
difficult and most expensive options as discussed below), additional groundwater withdrawals,
or reductions to use – planned or unplanned.
3. California: A Case Study of Unsustainable Water Use
More than half of the region‟s current and projected groundwater withdrawals take place in
California. At today‟s climate and rates of water use, the state‟s groundwater withdrawals would
average 5.5 million acre feet per year over the next century.5 California‟s Department of Water
Resources (CADWR) estimates that the overdraft averages 1.5 million acre feet per year (or 150
million acre feet over 100 years).6 The difference between the two is the portion of groundwater
extraction that is renewable – so if CADWR‟s estimates are correct, most of California‟s
groundwater use is replaced via recharge. A 2009 study by NASA, however, calls the CADWR
estimates into question and suggests that 4.4 million acre feet are overdrawn from California
5
Results of the CSWD model (Stanton and Fitzgerald 2011).
6
California Department of Water Resources (2009).
16The Last Drop: Climate Change and the Southwest Water Crisis
every year.7 NASA‟s higher overdraft estimates suggest that 100 years of water use at
California‟s current levels would very nearly exhaust California‟s 450 million acre feet in
estimated stored groundwater reserves.8
But California‟s water use is not projected to hold steady – far from it. Figure 2 shows a
conservatively estimated annual shortfall (green plus yellow) of 1.5 million acre feet growing to
8.6 by 2030, and 13.8 by 2050, before accounting for climate change. Under B1 climate
assumptions (adding orange), California‟s annual shortfall grows to 9.7 million acre feet per year
in 2030, 15.2 in 2050, and 16.0 in 2100. Using A2 climate assumptions (adding red), the annual
shortfall reaches 9.8 million acre feet per year in 2030, 15.6 million in 2050, and 17.6 million in
2100.
Figure 2: California's Projected Average Annual Groundwater Extraction plus Shortfall – No Adaptation
Current Renewable Current Overdraft Baseline Growth B1 Climate A2 Climate
2010 4.0 1.5 1.5 Shortfall
0.1
2030 4.0 1.5 7.1 1.1 9.8 Shortfall
0.4
2050 4.0 1.5 12.3 1.4 15.6 Shortfall
2100 4.0 1.5 12.3 2.2 1.7 17.6 Shortfall
0.0 5.0 10.0 15.0 20.0 25.0
Millions of Acre Feet per Year
Source: CSWD model results (Stanton and Fitzgerald 2011).
Over the next 100 years, given today‟s rates of water use, and projections of population and
income growth and future climate change, California will need 1,423 million acre feet more
groundwater than can be renewed through recharge, and 973 million acre feet more than is
thought to be available in groundwater reserves (see Figure 3). Put another way, unless some
adaptation measures are taken to reduce the rate of water use, California‟s groundwater demands
over the next century will be three times as large as its groundwater supply. And environmental
damages from over-extraction of groundwater should be a large economic and cultural
disincentive to continued overdraft, long before supplies literally run out (Zektser et al. 2004).
7
NASA Jet Propulsion Laboratory (2009); Gleick (2009).
8
California Department of Water Resources (1994).
17The Last Drop: Climate Change and the Southwest Water Crisis
Figure 3: California's Projected Groundwater Extraction plus Shortfall, 2010 to 2110
100 years at Current Rates
Renewable Overdraft Remaining Storage
1,423
No Adaptation 1,594 151 76 Shortfall
Slow Adaptation 966 130 63 762 Shortfall
30
Slow Urban,
540 101 274 Shortfall
Fast Agriculture
Fast Urban,
123 104 57
Slow Agriculture Baseline Growth
6 B1 Climate
Fast Adaptation 44
1 A2 Climate
0 200 400 600 800 1,000 1,200 1,400 1,600 1,800 2,000
Millions of Acre Feet
Note: Baseline growth (yellow) now includes renewable and overdraft (shown as blue and green in earlier figures).
Shortfall is total water use, under A2 climate assumptions, minus renewable (blue line).
Source: CSWD model results (Stanton and Fitzgerald 2011).
Using the optimistic CADWR estimates of its groundwater stock, California can supply a
cumulative total of 450 million acre feet beyond the renewable level. The actual projected
shortfall for 2010 through 2110 is 1,196 million acre feet before taking climate change into
account. At the mildest changes in climate that are still thought possible (B1), the 100-year
shortfall reaches 1,347 million acre feet; using more severe, but by no means worst-case, climate
projections (A2), this figure climbs to 1,423 million acre feet. That is, climate change does not
create the problem, but it does make the water crisis harder to solve. With no adaptation, the
cumulative impact of a century of climate change (A2 versus baseline) would – by itself – use up
half of California‟s groundwater reserves.
Planned conservation and efficiency improvements are essential to avoiding unplanned water
deficits and water use restrictions. Unless adaptation measures are taken to reduce California‟s
water use, 7 out of 10 years will require water restrictions or additional (above current levels)
overdraft by 2030 (under baseline, B1, or A2 scenarios) and every year will have a water
shortfall by 2050.9
The Pacific Institute has modeled several adaptation scenarios for California‟s urban and
agriculture water use; two such scenarios are discussed here as “slow” and “fast” adaptation.10
Slow urban adaptation includes 10-percent reductions in water use from conservation and 5-
percent reductions from efficiency measures, as well as consumers‟ response to a 20-percent
increase in water prices by 2030. Slow agricultural adaptation includes 5-percent reductions in
water use and growers‟ response to a 10-percent increase in water prices by 2030. The
combination of slow urban (300 million acre feet reduction in water use, see Figure 4) and slow
9
CSWD model results (Stanton and Fitzgerald 2011).
10
The “slow adaptation” scenario follows the Pacific Institute‟s “current trends” scenario as calculated for the
California Department of Water Resources (Groves et al. 2005), while the “fast adaptation” scenario follows the
“high efficiency” scenario laid out in a subsequent report (Gleick et al. 2005). Our model extends the Pacific
Institute‟s analysis to 2110 by continuing annual growth trends constant to 2050 and then keeping all annual values
constant at 2050 levels.
18The Last Drop: Climate Change and the Southwest Water Crisis
agricultural adaptation (363 million acre feet) is not enough to bring California‟s shortfall down
below the optimistic estimates of total groundwater storage. Even with both slow adaptation
measures in effect, California would still experience a 762 million acre feet shortfall over the
next 100 years.
Figure 4: California's Projected Adaptation Potential, 2010 to 2110
-300 Slow Urban
-363 Slow Agriculture
-850 Fast Agriculture
-1,174 Fast Urban
-1,200 -1,000 -800 -600 -400 -200 0
Millions of Acre Feet
Source: CSWD model results (Stanton and Fitzgerald 2011).
Fast urban adaptation includes 39-percent total conservation and efficiency reductions in
residential interior and commercial, industrial, and institutional water use, 33-percent reductions
in residential exterior use, and consumers‟ response to a 41-percent increase in water prices. Fast
agricultural adaptation includes 16- to 41-percent reductions in water use, depending on the crop,
and growers‟ response to a 68-percent increase in water prices by 2030.11
As shown in Figure 4, either fast urban plus slow agricultural adaptation or slow urban plus fast
agricultural adaptation is enough to shrink California‟s water shortfall to an amount that could be
met from assumed current groundwater stocks. To bring California‟ groundwater use down to
renewable levels, and even start to build up groundwater stocks over time, would require fast
urban plus either slow or fast agricultural adaptation. Fast urban and fast agricultural adaptation
combined would achieve a reduction of 1,770 million acre feet.
4. Southwest Water Use: Farms and Homes
All five Southwestern states use the majority of their freshwater for farming. One-fifth of
agriculture‟s contribution to U.S. gross domestic product (GDP) comes from the Southwest –
16.4 percent from California and 3.3 percent from the other four states. California has the largest
agricultural sector of any state, $17 billion; Texas is a distant second at $7 billion.12 The
Southwest is an important part of U.S. agriculture, but the sector is a very small part of the U.S.
economy.
Farming made up just 0.8 percent of U.S. GDP in 2005. There is a wide range in the importance
of agriculture among states, from 5 to 7 percent of GDP in South Dakota, North Dakota and
11
The fast urban and agricultural scenarios also assume a greater responsiveness of consumers and growers to price
changes (Gleick et al. 2005).
12
Bureau of Economic Analysis (n.d.), using 2005 data.
19The Last Drop: Climate Change and the Southwest Water Crisis
Nebraska, down to less than 0.1 percent in New Jersey, Alaska, Rhode Island, Massachusetts,
and the District of Columbia. In the Southwest, agriculture‟s contribution to GDP ranges from
1.6 percent in New Mexico down to 0.2 percent in Nevada. Overall, agriculture accounts for just
1 percent of Southwest GDP.
And yet nearly four-fifths of the Southwest‟s water is used for agriculture. Another fifth goes to
homes and commercial businesses (grouped together here as “urban” uses), and less than one
percent goes to each of the electricity generation, mining and industrial sectors (see Table 3).
Table 3: Southwest water use by sector, 2005
Southwest Arizona California Nevada New Mexico Utah
Irrigation and livestock 78% 77% 77% 64% 87% 85%
Urban 21% 19% 23% 30% 10% 13%
Industrial 0% 0% 0% 0% 0% 1%
Power 1% 1% 0% 2% 2% 1%
Mining 1% 2% 0% 4% 2% 0%
Source: U.S. Geological Survey (2009).
Many Southwest agricultural products are very profitable, and some (such as certain nuts and
fruits) make an important contribution to total world supply. Other products of the region‟s
agriculture are much less profitable. One useful measure of the value of each crop, in a water-
scarce environment, is the value of farm revenues per acre foot of water. Cutting back on the
least valuable crops (per unit of water) would have little impact on U.S. or world agricultural
markets, but a big impact in balancing water use with water supply in the Southwest.
A surprising share of Southwest agricultural water is used to grow hay: from 29 percent in
California, to 94 percent in Utah. The main use of hay is to feed cattle, an important part of the
region‟s agriculture. But the share of agricultural water going to hay, 42 percent, is greater than
the share of dairy and cattle in the value of Southwestern agriculture, 31 percent (see Table 4).
Table 4: Current agriculture water use and value
Southwest Arizona California Nevada New Mexico Utah
Total agricultural water use (MAF) 34.3 2.9 24.9 1.9 1.8 2.8
Hay's share of water use 42% 54% 29% 97% 76% 94%
Value of agricultural sales (billions) $41.1 $3.2 $33.9 $0.5 $2.2 $1.4
Dairy and cattle's share of sales 31% 39% 27% 55% 74% 45%
Source: National Agriculture Statistics Service (2009), http://www.agcensus.usda.gov; and authors’ calculations.
More than four-fifths of the value of Southwest agricultural production comes from California,
and today California uses 74 percent of all Southwest agricultural water. In all Southwestern
states, hay is the crop with the lowest value per acre foot of water, $149 in California (see Figure
5). Because most hay is sold locally to nearby dairies and cattle ranches, it might be more
appropriate to combine these sectors, looking at the average sales of dairy and cattle farming
20The Last Drop: Climate Change and the Southwest Water Crisis
compared to the water used for both cattle and hay. When water used for hay is considered as an
input into the dairy and cattle industry, the value of dairy and cattle products for California rises
to $1,262 per acre foot, while the regional average is $878.
Figure 5: Value of crops per acre foot of water, California and Southwest average
$121
Other crops and hay Southwest
$149
$172 California
Rice
$172
$290
Corn
$202
$217
Other grains, oilseeds, dry beans/peas
$209
$341
Wheat
$263
$337
Cotton and cottonseed
$386
$878
Dairy, cattle (including water for hay)
$1,262
$1,370
Fruits, tree nuts, and berries
$1,393
$2,254
Vegetables, melons, sweet potatoes
$2,226
$28,265
Nursery, greenhouse, floriculture, sod
$35,479
$1,199
Average for all crops
$1,360
Source: CSWD model results (Stanton and Fitzgerald 2011).
Dairy and cattle account for only 27 percent of agricultural sales in California, and three other
categories of crops are more valuable, greenhouse and nursery ($35,479 per acre foot – the most
valuable category anywhere in the Southwest); vegetables and melons ($2,226); and fruit and
nuts ($1,393).
Arizona‟s current annual groundwater overdraft per person is more than four times that of
California, and half of this state‟s water demand is met from groundwater, compared with one-
third in California. Arizona is also far more dependent on Colorado River use rights (41 percent
of all water use) than California (12 percent), and the extraction of this resource simply cannot
continue at the current rate – annual withdrawals are greater than average annual flow, and
Colorado River reservoirs are shrinking. In both states, 77 percent of water is used for agriculture
and most of the remainder in the urban sector.
In Arizona – where 54 percent of agricultural water is used to grow hay – this crop alone is
worth $171 per acre foot of water, higher than in the other Southwest states, but lower than other
crops grown in Arizona: greenhouse and nursery crops earn sales of $15,370 per acre foot in the
state, and vegetables and melons earn $2,875 per acre foot (see Figure 6). In Arizona, dairy and
21You can also read