The Causal Effect of an Income Shock on Children's Human Capital - Cristina Borra Ana Costa-Ramon Libertad Gonzalez Almudena Sevilla July 2021
←
→
Page content transcription
If your browser does not render page correctly, please read the page content below
The Causal Effect of an Income Shock on
 Children’s Human Capital
 Cristina Borra
 Ana Costa-Ramon
 Libertad Gonzalez
 Almudena Sevilla
 July 2021

 Barcelona GSE Working Paper Series
 Working Paper nº 1267
The causal effect of an income shock on children’s
 human capital

 Cristina Borra*
 (Universidad de Sevilla)

 Ana Costa-Ramón
 (University of Zurich)

 Libertad González*
 (Universitat Pompeu Fabra and Barcelona GSE)

 Almudena Sevilla*
 (University College London)

 July 2021
Abstract: We investigate the causal impact of a generous unconditional cash transfer at
birth on children's later health outcomes and academic performance. Using rich
administrative data, we take advantage of the unexpected introduction of a “baby
bonus” in Spain in 2007, and implement a difference-in-discontinuity approach
comparing children born in the surrounding months in different years. We find that the
subsidy did not have a significant effect on health outcomes during childhood, nor on
test scores in primary school. In line with this result, we show that the benefit did not
affect the main potential mechanisms that could in turn have affected children’s health
and academic performance. Our results contribute to understanding which interventions
are effective at improving children's health and human capital formation.

JEL Codes: I12, J13, H31, H24.
Keywords: Children, health, education, income shock, child benefit, Spain.

* Borra acknowledges funding from the Spanish National Research Plan 2017-2020 (RTI2018-
098217-B-I00). González acknowledges funding from the European Research Council (CoG
MISSINGMIDDLE-770958) and the Spanish Ministry of Economy and Competitiveness,
through the Severo Ochoa Program for Centers of Excellence in R&D (CEX2019- 000915-S).
Sevilla acknowledges funding from the European Research Council (CoG PARENTIME-
770839). We thank Sofía Sierra and Ana Brás for excellent research assistance.
1. Introduction

Cash transfers to families with children can help mitigate growing socio-economic

inequalities stemming from gaps in early childhood investments. Recent proposals by

the Biden administration for direct payments to families with children have brought

back to the debate the difficulty in balancing the trade-offs between the two most

popular policy options currently employed to reduce child poverty.

 Highly targeted schemes, while cheaper, can be complicated to administer and risk

not reaching the targeted population because of the complexity associated with claiming

benefits. In the US, about 20 percent of eligible taxpayers do not claim $7.3 billion of

the Earned Income Tax Credit (EITC) each tax year (TIGTA 2018). Unconditional

universal cash-transfer schemes are easier to administer. Their widespread nature,

however, tends to diminish the cash payout per household to restrain program costs,

which may compromise their effectiveness.

 In this paper, we exploit the unexpected introduction of a one-off universal child

benefit paid at birth to credibly estimate the causal effect of an income shock on a rich

set of child outcomes available in administrative registers.

 Parental wealth is highly associated with better child outcomes at every stage of the

lifecycle, starting early-on in a child’s life. Moreover, traits determined during early

childhood explain a large proportion of the variability in lifetime earnings (Cunha and

Heckman 2007; Currie 2009). As a result, diverging destinies in childhood are likely to

lead to intergenerational persistence of economic inequality (Black and Devereux 2011;

Corak 2013).

 Theories of child development predict large benefits of parental wealth that start

early-on in the child’s life and accumulate thereafter. Investment models emphasize the

access to better material resources, such as better food and medical care, better housing,

 1
and more human-capital enhancing parental time (Becker and Tomes 1976; Caucutt and

Lochner 2020). Parental stress models highlight parental emotional wellbeing and stress

reduction as parental wealth increases (Yeung, Linver, and Brooks-Gunn 2002; Bradley

and Corwyn 2002; Milligan and Stabile 2011; Akee et al. 2018; Conger, Rueter, and

Elder 1999). Human-capital enhancing parenting behavior as a result of reduced stress

is a potential mediator between wealth and children’s outcomes, promoting warm and

non-coercive parenting, which is in turn associated with better child outcomes (Fiorini

and Keane 2014; Fryer Jr., Levitt, and List 2015; Doepke and Zilibotti 2017).

 We exploit the introduction of a new, universal, one-time payment child benefit

introduced in Spain in 2007, to estimate the causal effect of parental income on

children’s health and development. The benefit, which was announced retrospectively

on July 3rd, was entirely unexpected, and all mothers giving birth from July 1st onwards

were eligible to receive it immediately after birth (González 2013). The magnitude of

the benefit was €2,500 (about $3,800), almost 4.5 times the monthly (gross) minimum

wage for a full-time worker and 9 percent of the average annual disposable income

(about €28,787, Spanish National Statistics Institute). The unexpected nature of the

announcement implied no anticipation effects on the part of households, as it was not

possible to shift the timing of births or change in-utero investments.

 We use a rich set of administrative registers on children’s test scores, primary

health care, and hospital discharge records collected at several points during the child’s

early years. The large register data allow us to follow children’s health trajectories, and

to test for the theoretical predictions in the literature regarding the age, sex, and socio-

economic status of the child.

 Our identification strategy relies on the sharp eligibility cutoff of the policy by date

of birth. We use a difference-in-discontinuity design, similar to Bertrand, Mogstad, and

 2
Mountjoy's (2020), which compares the gaps in health and development outcomes

between children born in July 2007 (right after the baby bonus) versus the outcomes of

children born in June of 2007 (right before the baby bonus), relative to children born in

June and July in the previous year.

 We show that a generous one-time cash transfer to families shortly after having a

child does not have any visible impact on the targeted child’s later health and

educational outcomes. The distribution of the number of births and other pre-

determined variables around the cut-off shows no distinct jump, which rules out that our

results may be driven by other discontinuities around the threshold. Additional checks

from a difference-in-discontinuity model of a placebo introduction of the baby-check in

2006, using children born in 2005 as a control, suggest that the discontinuity at July 1st

is constant over time in the absence of the policy change.

 Overall, our analysis based on large high-quality register data allows us to precisely

bound our estimates to a tight interval around zero, so that we can comfortably reject

positive effects of the magnitudes reported in some previous studies (see Almond,

Currie, and Duque 2018 and Cooper and Stewart 2020 for reviews). Age-by-age

estimates from birth to middle childhood as well as heterogeneous analyses by gender

and socio-economic status also allow us to reject any significant effects of income on

the child’s health and educational outcomes in any of the subsamples.

 We also find that the policy shock did not lead to either short- or long-run impact

on parental behaviors. Using a variety of representative large-scale Spanish surveys, we

fail to find significant effects on subsequent fertility, living arrangements, or parental

time investments. Consistent with the findings in Akee et al. (2010) and Black et al.

(2014), we also rule out any impact on maternal labor force participation and childcare

use. Our estimates cannot be robustly bounded away from zero, although the nature of

 3
the surveys prevents us from attaining the precision afforded by the administrative

records.

 The last section offers a comparative benchmark for our results by placing them

adjacent to the effect sizes in other relevant papers investigating the causal relationship

between income shocks and children’s outcomes in developed countries. We study child

outcomes such as standardized test scores, anthropometric measures, and hospitalization

rates, which have been extensively used in previous work. Of the seven studies that

satisfied our inclusion criteria examining health and student outcomes during childhood,

all but one report positive effects. Our comparative exercise reveals that the

heterogeneity stemming from the type of outcome measure analyzed or the socio-

economic characteristics of the targeted population cannot consistently explain the lack

of positive marginal effects implied by our causal estimates.

 We also fail to find any effect of the universal baby bonus on a sample of low-

income households, which have traditionally been the focus of welfare-to-work and

conditional cash programs analyzed in the literature (Akee et al. 2010; Black et al. 2014;

Dahl and Lochner 2017; Duncan, Morris, and Rodrigues 2011; Milligan and Stabile

2011).

 We are able to rule out that the one-time €2,500 baby bonus may have been too

modest to be able to generate any changes in future income expectations or lifetime

income (Blau 1999; Dahl and Lochner 2012). Studies analyzing income changes in the

same order of magnitude find large impacts on children’s health and cognitive

outcomes.

 Our lack of effects is more in line with the results in recent lottery studies (Cesarini

et al., 2016), who find close to zero effects on child outcomes using income shocks that

are an order of magnitude larger than the increase in annual income generated by the

 4
Spanish baby bonus. One commonality between lotteries and universal income transfers

like the Spanish baby bonus is that income supplements are not conditioned on

household time-use investments or expenditures. It is plausible that universal income

supplement policies like the Spanish baby bonus are more effective if their receipt is

conditioned on expenditure or investment behaviors that directly affect children’s

outcomes, as is the case in most of the welfare-to-work experiments and childcare

subsidy programs finding positive effects from income shocks.

 Our paper contributes to the extensive literature aiming to identify the causal effect

of income shocks on later-life child development (see Almond, Currie, and Duque

(2018) and Cooper and Stewart (2020) for recent literature reviews). The rich nature of

our administrative data allows us to causally assess the effect of an income shock on a

range of middle-childhood health and educational outcomes, an important period in a

child's life that is often overlooked (Almond, Currie, and Duque 2018; Garces, Thomas,

and Currie 2002). Our age-by-age estimates contribute to the understanding of the

medium-term effects of early-childhood cash-transfer policies that have been

documented to successfully impact later-life socio-economic outcomes. With a few

exceptions, most studies do not study the effect of income shocks on outcomes of

children in middle-childhood. The evidence documented here is consistent with the

results from the broader literature evaluating early intervention programs on the

"missing-middle", which exhibit early and long-term effects but no effects at ages eight

or nine (Almond and Currie 2011).

 Compared to most previous studies evaluating income shocks during early life, the

nature of our policy shock allows us to unambiguously separate a pure income effect

from difficult-to-model substitution effects induced by the kind of policy changes

analyzed in most of the previous work (Almond, Currie, and Duque 2018; Heckman and

 5
Mosso 2014). Policy experiments entailing no-strings-attached income transfers are

difficult to come by, so a common tool in the literature to identify pure income effects is

to analyze income shocks stemming from lotteries (Cesarini et al. 2016; Bleakley and

Ferrie 2016). The universal nature of the policy ensures that we can successfully

overcome the two most important limitations in lottery studies (Bagues and Esteve-

Volart 2016). First, we do not have external validity limitations from lottery studies

arising from the fact that the sample of players may not necessarily be representative of

the wider population, given that all Spanish mothers giving birth after July 1st, 2007

were eligible for the bonus. Second, we avoid the so-called fungibility problems that

restrict the external validity of lottery prize responses due to its inherent difference from

other forms of more common cash government programs such as ours (Thaler 1990).1

 Lastly, our high-quality large-scale survey data allow us to examine the potential

mechanisms that may impact child development. Unlike targeted schemes such as the

Earned Income Tax Credit (EITC) in the US and the Welfare to Work experiments in

the US and Canada, which are usually contingent on work, unconditional universal

programs may discourage recipients from seeking paid work (Hoynes and Rothstein

2019; Jones and Marinescu 2018). We find no evidence of substitution effects leading

to negative work incentives for mothers that were exposed to the bonus. This is

consistent with recent evidence from evaluations of larger universal basic income

experiments, such as the annual income transfer of $2,000 in the Alaska Permanent

Fund or the €560 monthly income transfer in the Finnish Basic Income Experiment,

1
 For instance, unlike money received from government programs, lottery winners may
use increased cash to ‘play with the house money’, taking on additional risks (Thaler
and Johnson 1990; Hankins, Hoekstra, and Skiba 2011). Recent evidence has also
shown that the specific source of income matters and labels can impact how funds are
spent (Beatty et al. 2014; Hastings and Shapiro 2018).

 6
found to have no impact on recipients’ labor supply resulting from the additional cash

(Jones and Marinescu 2018; Kangas et al. 2020).

 The remainder of the paper is organized as follows. Section 2 describes the

institutional framework. Section 3 lays out the identification strategy. Section 4

introduces the data and provides key descriptive statistics. Section 4 reports our main

results. Section 5 presents evidence on the mechanisms, and Section 6 concludes.

2. Institutional background

Aimed at improving families’ well-being, most OECD countries offer some type of

financial aid to households with young children, spending on average 1.1 percent of

GDP on these programs (OECD 2020). Financial support may take place either through

the tax system (credits and allowances) or through cash transfers to households with

young children. Targeted (means-tested) cash transfers at birth that continue throughout

a child’s life have the potential to reduce inequality, but are expensive to run and may

be subject to qualifying errors. For instance, in 1995, the United States’ annual

administrative costs were $3.7 billion for food stamps and $3.5 billion for Aid to

Families with Dependent Children (AFDC), while $4.4 billion were claimed

erroneously through the Earned Income Tax Credit (EITC) (Hotz, Hotz, and Scholz

2003). One-off universal cash transfer programs, which target the entire population, are

particularly attractive to governments because of their simplicity and low administrative

costs.

 The Spanish universal child benefit was first announced by the Spanish president

on July 3, 2007. The subsidy would grant all mothers with a child born after July 1st,

2007, a one-time bonus of €2,500. In addition to the date of birth, the only other

eligibility condition would be that the beneficiary (usually the mother) was a legal

resident in Spain for at least two years before giving birth. Additionally, the law

 7
introduced an extra €1,000 subsidy for lower-income families with at least 3 children

including the newborn, single-parent families, mothers with a degree of disability higher

than 65 percent, and all families having a child with at least a 33 percent degree of

disability.

 The explicit goal of the new policy was twofold. As stated in the law, the benefit

was meant to help parents cope with the extra expenditures associated with childbirth,

while also encouraging fertility in the face of Spain’s prevailing low birth rates and

ageing population. The law also mentioned an aim to facilitate the balance of work and

family as well as help maintain the living standards of low-income families.

 Before this reform, Spain already had several conditional child-related tax benefits,

and most Spanish regions had some form of universal child benefit for their citizens.

However, the newly announced cash transfer was sizably larger than most of them. To

contextualize the size of the subsidy, we can compare it with monthly earnings. In 2007,

the monthly gross minimum wage for a full-time job in Spain was €570.6, and about 20

percent of working women earned the minimum wage or below (2007 Wage Structure

Survey). Thus, the benefit was equivalent to 4.4 months of pay for a low-wage, full-

time worker. Similarly, assuming an equalizing factor of about 2 individuals per

household, the child benefit represented about 11 percent of the median and 17 percent

of the bottom quartiles of annual household income.2

 While the first subsidies weren’t paid until late November, the take-up was still

large during the first year: tax authorities reported paying the benefit to 161,983

families in 2007, accounting for 65 percent of all births taking place after July 1st that

year. This 65 percent take-up could be seen as a lower bound, as some of the births

2
 The median and bottom quartiles of annual equivalized per capita income in Spain in
2007 were €11,645 and €7,740, respectively (Eurostat 2020).

 8
taking place in December would have requested the benefit in early 2008. As González

(2013) points out, in the next year, take-up increased noticeably, reaching 95 percent of

all births taking place in Spain during 2008.

3. Data

Our aim is to measure the impact of the policy on children’s health and educational

outcomes from early to middle childhood. To that end, we use a rich set of registers

from which we derive the main health and educational outcome variables. Table 1 gives

a summary overview of the administrative data sources used, containing the register

name, the unit of observation in the original data set, a brief data description, the main

outcomes measured, and the available controls.

3.1 Data Sources

Panel A in Table 1 describes the main features of the registers containing health

outcomes, which include anthropometric measures, primary health problems, and

hospitalization outcomes at different points in a child’s life.

 We use the 2011-2015 Spanish Primary Care Clinical Dataset (Base de Datos

Clínicos de Atención Primaria, BDCAP), which collects annual standardized clinical

data from a 10 percent random sample of primary-care electronic health records of the

Spanish population (about 5 million observations). BDCAP is curated and maintained

by the Spanish Ministry of Health and includes information on health problems,

referrals, prescriptions, and diagnostic procedures. Health problems are coded using the

International Classification of Primary Care (ICPC-2). Because this dataset starts in

2011, it only covers children in our sample from 5 years of age.

 We complement this register with the 2006-2011 Primary Care Drugs Prescription

Dataset (Base de Datos para la Investigación Farmacoepidemiológica en Atención

Primaria, BIFAP) for children aged 0 to 4. BIFAP is an administrative dataset that

 9
contains clinical data from the electronic health records of all patients who attended

primary care for 5 out of the 16 autonomous regions in Spain and about 20 percent of

patients in two other autonomous regions, covering 17.3 percent of all Spanish patients

attending primary care (Maciá‐Martínez et al. 2020). BIFAP is curated and maintained

by the Spanish Agency of Medicines and includes information on anthropometric

measures, health problems (coded using the ICPC-2 classification), referrals,

prescriptions, and diagnostic procedures.3

 We also use the 2006-2015 Hospital Morbidity Survey, an annual census of all

overnight hospitalizations in Spain that includes 96 percent of hospitals, both public and

private, and 99 percent of all overnight hospital stays (see Borra, González, and Sevilla

2019). This registry contains information at the level of the individual hospital stay,

such as the date of release, age (in years, months and days), main diagnosis, and length

of stay. Because not every child is hospitalized in a given year, our population data of

overnight stays includes a selected sample of children. We therefore conduct the

analysis at the date of birth level by computing daily hospitalization rates. For each date

in our sample, we compute daily hospitalization rates (by age and diagnosis) for

children born on a given date as the number of hospital stays (from the 2006-2015

Hospital Morbidity Survey) divided by the total number of children born on that date

(from 2006-2007 Vital Statistics data).

 To that end, we link the 2006-2015 Hospital Morbidity Survey to the micro data

from birth certificates in the vital statistics register, a population-level dataset providing

detailed information on the universe of births taking place annually in Spain as recorded

3
 BIFAP is collected by collaborating physicians and offers basically population-level
data on 5 of the autonomous communities (Aragon, Asturias, Castille-Leon, Murcia and
Navarra). As shown in Maciá‐Martínez et al. (2020) the age and sex distribution of the
dataset is representative of the Spanish population.

 10
in the official national registry, supplemented with the files containing the exact date of

birth for each newborn for the years 2006 and 2007, purchased from the Spanish

National Statistical Institute.4 The Hospital Morbidity Survey does not provide direct

information on procedures, drugs administered, or costs. Diagnoses are provided at the

3-digit level and grouped in 17 "chapters", following the International Classification of

Diseases (ICD-9-CM).

 Panel B in Table 1 describes the datasets from our education registers. We use

several years of administrative data on children’s primary school performance in

second grade from two large Spanish regions making up approximately 36 percent

percent of the total Spanish student population. Andalusian Diagnostic Tests Data,

provided by the Andalusian Agency of Educational Evaluation (Agencia Andaluza de

Evaluación Educativa-AGAEVE), consists of annual external diagnostic-assessment

tests for the whole population of Andalusian 2nd graders, with the objective of

evaluating students’ basic competences.

 Catalonian Grades Data, provided by the Catalan Statistical Institute (Institut

d'Estadística de Catalunya -IDESCAT), consists of teachers’ internal end-of-year

subject grades for 2nd graders attending public schools. In the case of Catalonia, the

dataset provides information for 144,213 students, representing 70 percent of

Catalonia’s public-school student body during the 2013/14 and 2014/15 academic years.

In the case of Andalusia, we have information for 279,917 students in the 2013/14,

2015/15, and 2015/16 academic years, the universe of Andalusian students across that

period.

4
 Parents are required to register the birth in a Civil Registry office between 24 hours
and 8 days after the delivery takes place, by presenting the original birth certificate
provided by the health center (see Casado, 2008, p. 56). The birth certificate is filled out
by the hospital (not the parents) at the time of birth, and contains the date and time of
birth, as well as the doctor’s signature.

 11
Both datasets include performance in Mathematics and Spanish. Additionally, the

Catalonian dataset includes performance in Catalan and English as well as the overall

GPA grade for the same cohorts obtained in 3rd grade the following year for 2014/15

and 2015/16. For Andalusia, we also have information on diagnostic tests of students

who were retained. Administrative data from Catalonia and Andalusia are also available

for the year 2015/16, that is, for the cohort born in 2008. We use this information

together with data on the children born in June and July 2007 to perform additional

robustness checks.

 Column 5 in Table 1 shows the demographic characteristics available in each

dataset. The primary health data contain basic demographic information on the child

and limited family income information. Hospitalization registers contain some

additional variables such as province and sex, while the education registers are the most

complete, containing several socio-demographic characteristics of parents and their

children.

3.2 Outcome variables

We study outcomes that have previously been shown to differ between children with

different access to material resources, including respiratory problems, injuries, mental

disorders, BMI, obesity, and cognitive test scores (Currie 2009; Heckman and Mosso

2014; Almond, Currie, and Duque 2018). In all our analyses, we select children born in

June and July of 2006 and 2007. Table 2 reports summary statistics for this sample.

 There are three sets of primary health outcomes observed for children between the

ages of 0 and 4 (see Panel A of Table 2). The first set of primary health outcomes refers

to anthropometric measures at age 4. Children’s height and weight are directly

recorded in the registers. We derive height-for-age, weight-for-age, and BMI z-scores

using the World Health Organization’s (WHO 2006) universally applicable growth

 12
standards. Our sample of Spanish children (about 3,921 four-year-olds) is, on average,

0.28 standard deviation units heavier than the international WHO averages. They also

present higher BMI by 0.35 standard deviation units. We also construct indicators for

overweight (BMI at or above the 85th percentile and below the 95th percentile) and

obesity (BMI at or above the 95th percentile) using Cole et al. (2000) standards. Our

sample of children is 15 percent overweight and 3 percent obese.

 The second set of primary health outcomes recorded in the registers is the number

of health problems and referrals for children up to 8 years of age as well as the

number of primary healthcare visits and prescriptions for children 0-4. Our sample

includes 12,062 children at ages 0 to 4 and 16,435 at ages 5 to 8. Health problems are

episodes of care with at least one diagnosis. On average, Spanish children have 23

health problems in their initial four years of life, and just 5 at ages 5-8. Most of the

health problems do not need the intervention of specialist physicians.

 Children are referred to specialists 1.5 times during their first 4 years of life and 0.2

times from ages 5 to 8. The number of visits to the doctor during the first 4 years of life

is about 43, larger than the corresponding number of health problems because of well-

child visits. We also study cause-specific health problems: respiratory problems (ICPC-

2 Chapter R), infections (ICPC-2 Process codes for infections), injuries (ICPC-2

Process codes for injuries), and psychological problems (ICPC-2 Chapter P).

 The third set of primary health outcomes is daily inpatient hospitalization rates.

We consider inpatient hospitalization rates for the most common health problems in

children: respiratory disease (ICD-9 Chapter 8), infections (ICD-9 Chapter 1), external

causes (accidents, injuries, and poisoning) (ICD-9 Chapter 17 ), mental disorders (ICD-

9 Chapter 5), and an omnibus (‘‘all-cause’’) category covering all hospitalizations with

the exception of perinatal health problems. Our sample consists of 122 days, one for

 13
each potential date of birth from June and July of 2006 and 2007. Panel A in Table 2

also shows that there were 694 hospitalizations between the ages of 0 and 8 for every

1,000 children born in a given day. On average, 128 hospitalizations were due to

respiratory disease, 101 to infections, 35 to injuries, and 2 to mental disorders.

 Our main educational outcomes are Spanish and Mathematics student

performance in second grade, i.e., students of ages 7 or 8 for children born in June and

July 2006 and 2007, respectively (see Panel B in Table 2). For Catalonia, we exclude

children born outside Spain, since they were not eligible for the benefit. That

information is not available in the Andalusian sample.5 Our sample includes 32,002

children in Andalusia and 15,696 in Catalonia. In Andalusia, student performance is

measured by a continuous variable with maximum scores of 40 and minimum of 10. In

Catalonia, student performance is given in annual average grades, a categorical variable

that takes values 2.5 (fail), 5 (pass), 6 (C), 7.5 (B), and 9.5 (A).

 We standardize all scores at the subject-cohort-region level. The different grading,

together with the fact that Andalusian measures are external evaluations while

Catalonian grades are internal evaluations, means that we need to study each region

separately. In Andalusia, we also know whether students were retained in a grade. Panel

C in Table 3 shows that about 4.7 percent of the students are repeaters. For Catalonia,

we also have information on two additional 2nd-grade subjects, Catalan and English, and

the overall 3rd grade mean Grade Point Average (GPA). While the 3rd grade GPA is a

continuous variable, 2nd grade subject grades are categorical variables, similar to

Spanish and Mathematics grades. We also standardize these additional scores to have a

mean of zero and a standard deviation of 1 at the subject-cohort level.

5
 According to Population Figures of the Spanish National Institute, approximately less
than 3 percent of the Andalusian population aged 5 to 9 years was foreign born on
January 1st, 2015.

 14
4. Identification Strategy

Our research design builds on the policy’s sharp eligibility cutoff by date of birth.

Children born after July 1st, 2007 were eligible to receive the bonus and constitute the

treatment group; children born before that date are the control group. A regression

discontinuity (RD) design that compares outcomes for children born right after the

cutoff to those born right before is the common research method to identify causal

impacts of such a policy with a clean cutoff rule. However, a plausible concern in our

specific setting is that, even in the small window where treatment assignment can be

assumed to be quasi-random, the running variable might still be related to potential

outcomes. For instance, the medical literature has identified significant associations

between month of birth and the risk of different diseases such as asthma, attention

deficit hyperactivity disorder, and myopia. Boland et al. (2015) found that individuals

born in July, together with those born in May, had lower risks at different diseases.

Similarly, Berniell and Estrada (2020) show that Spanish children born before July tend

to have better-educated mothers than those born after.

 To the extent that seasonality affects health and schooling outcomes in a non-

monotonic way, RD estimates could potentially be biased. We address potential

seasonality concerns by estimating the causal impacts of the policy change using a

difference-in-discontinuity design similar to Grembi, Nannicini, and Troiano (2016) and

Bertrand, Mogstad, and Mountjoy (2020). In essence, this model implements an RD

strategy using as additional controls children born on the same dates in an earlier year,

in order to take into account unobserved characteristics of children born in different

months of the year. That is, our model estimates the discontinuity in outcomes between

children born before and after the cutoff of July 1 st, 2007, subtracting any discontinuity

between children born before and after the July 1st cutoff in 2006. For estimation

 15
models where the dependent variable is measured at the child level, we use the

following equation:

 = + 1 + 2 + ∗ + ( )

 ∗ [ 3 + 4 + 5 + 6 ∗ ]

 + (1)

where denotes the studied outcome of child i. is the running variable defined

as the difference between the date of birth of the child and the July 1st cutoff within

each window, is an indicator variable equal to 1 if child i was born in the

reform window of ± 30 days surrounding the cutoff date July 1, 2007, and is an

indicator variable that is equal to 1 if the child was born after the July 1st cutoff in

either year (2006 and 2007). The interactions with allow slopes to vary arbitrarily

on each side of the cutoff as well as across the reform vs. the control windows.6 We

cluster standard errors by date of birth.

 In the case of models where the dependent variable is measured as a daily-

aggregate, Equation 1 takes the form:

 = + 1 + γ2 + β ∗ + ( )

 ∗ [ 3 + 4 + 5 + 6 ∗ ]

 + (2)

where denotes the average outcome for children born in date t. is the running

variable defined as the difference between the date of birth t and the July 1st cutoff

within each window. is an indicator variable equal to 1 if the date belongs to

6
 The exact date of birth is not available in the BIFAP data set. We use information on
month and year of birth instead and estimate equation 1 as: = + 1 +
γ2 + β ∗ + , where we assume that the treatment is as-if
randomly assigned within the smallest window possible, that is, one month around the
cutoff (D. S. Lee and Lemieux 2010; Cattaneo, Titiunik, and Vazquez-Bare 2017).

 16
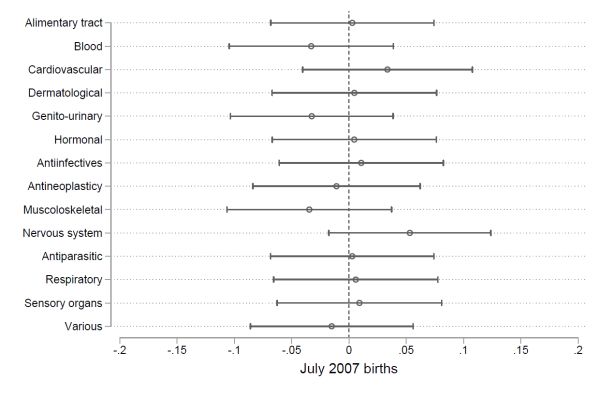
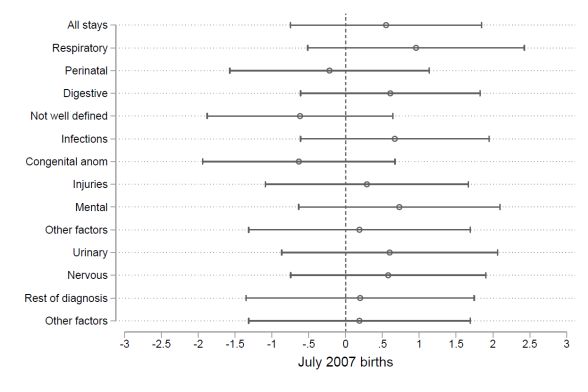
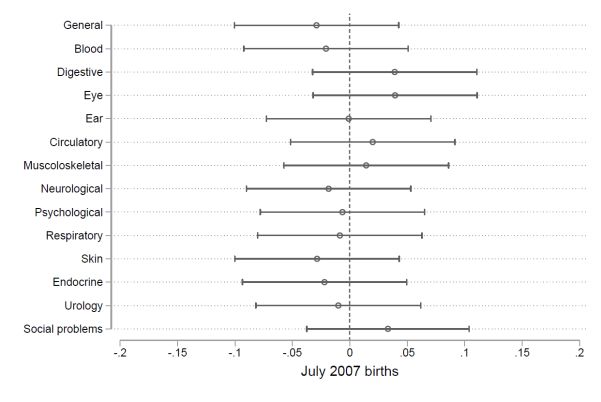
the reform window of ± 30 days surrounding July 1, 2007, and is an indicator

variable that is equal to 1 if the date is after the July 1st cutoff of either year. The

interactions with allow slopes to vary arbitrarily on each side of the cutoff as well

as across the reform vs. the control windows. We cluster standard errors by date of

birth.

 In both equations, β is our main parameter of interest and captures the discontinuity

in health and schooling outcomes caused by the introduction of the universal child

benefit, controlling for the differences that may exist between children born right before

and after July 1st in regular years, regardless of the reform. We also explore the

possibility of heterogeneous effects of the reform, analyzing results by sex and age of

the child and by socioeconomic status of the family.

 Our research design assumes, first, that potential outcomes are continuous at the

July 1st threshold. To back this assumption, we show in Panel A of Figure 1 that there

was no differential change in the daily number of births around the cutoff date in 2007

compared to 2006. Consistent with this, Panel B shows that there is no bunching in the

number of births around the July 1st cutoff in 2007, and we also show that the pattern in

the number of births around July 1st in 2006 is very similar (Panel C). The absence of

strategic sorting around the July 1st cutoff in 2007 is consistent with the policy being

introduced unexpectedly, using a date in the past as an eligibility cutoff and

consequently preventing birth delays with the aim of qualifying for the policy

(González 2013).

 To further demonstrate that outcomes are continuous at the July 1st threshold, we

also show that there is no difference in discontinuities for available pre-determined

variables (Figure 2). We estimate the model in Equation (1) with pre-determined child

and family characteristics as outcome variables. None of the point estimates, plotted in

 17
Figure 2, are significant at the 5 percent level, suggesting again that there is no

differential selection of babies around the July 1st cutoff in 2007, compared to 2006. In

Section 5, we additionally show that controlling for pre-determined covariates in the

baseline estimations leave point estimates almost unchanged while increasing accuracy,

as expected.

 A second identification assumption of our estimation strategy is that, in the absence

of the policy change, the effect of being born after July 1st is constant over time (see

Grembi, Nannicini, and Troiano 2016). This is analogous to the parallel trends

assumption for difference-in-differences, which under our specification must hold only

for the observations in a tight interval around the policy change. To test for this

assumption, we estimate the difference-in-discontinuity impact of a placebo

introduction of the baby-check in 2006, using children born in 2005 as a control. We

find that the differences in the outcomes between children born before and after July 1st

are constant over time before the introduction of the baby-check, with no significant

effect for the placebo policy. Table A.1 in the Appendix shows no significant impacts of

being born after July 1st on primary healthcare outcomes of children 5 to 8 years-old

born in 2006 compared to similar children born in 2005. This confirms that there are no

pre-existing systematic differences in the outcomes before the policy change. 7

7
 We have no data for the 2005 cohort on the other datasets, but with BDCAP data we
show that this is not a concern. Table A.2 presents the results of another placebo
exercise that finds that there are no significant impacts of being born after July 1st on
education outcomes for Andalusian children in 2009 when compared to children born in
2008.

 18
5. Results

5.1. Main Results

Health Outcomes

Results on anthropometric measures from estimating Equation (1) are presented in

Table 3. The first three outcomes in columns (1) to (3) are normalized so that the effect

size estimates can be interpreted in standard deviation units. The estimated effects range

between 0.02 and 0.10 standard deviation units, with a 95 percent CI ranging from -0.12

to 0.23. We can therefore reject impacts larger than 15 percent of a standard deviation

for height, 19 percent of a standard deviation for weight, and 23 percent of a standard

deviation for BMI.8

 We do not find evidence that income affects the likelihood of being overweight or

obese at 4 years of age. These are both negative outcomes that increased income may

reduce. We can reject impact reductions in overweight probabilities below 18 percent.9

 In sum, we find no evidence that income impacts any of the six anthropometric

measures considered, and cannot rule out the null hypothesis that the effect of the cash

transfer is zero.

 Table 4 summarizes the impact of the baby bonus on healthcare measures obtained

by estimating Equation (1). Panel A reports results for primary care outcomes for 0 to 4

year-olds from BIFAP data, and Panel B reports results for primary care outcomes for 5

to 8 year-olds from BDCAP data.

8
 For height, the estimated coefficient of 0.02 (standard error 0.066) leads to an upper
limit of 0.151 at the 95 percent level. Dividing that number by the sample standard
deviation of 1.02 leads to an upper confidence impact of 0.15 standard deviations. For
weight, the estimated coefficient of 0.064 leads to an upper confidence impact of 0.19
standards, using a similar method. Similarly, for BMI, the estimated coefficient of 0.097
leads to an upper confidence impact of 0.23 standard deviations.
9
 For overweight, the lower confidence impact is -0.026, that is, 18.3 percent for an
average rate of 0.142 overweight children in the sample.

 19
The estimated impact of the baby-check on health problems, referrals, and drug

prescriptions in primary care are shown in columns (1), (2), and (3), while column (4)

displays results for overall visits in primary care. None of the estimated effects for the

introduction of the policy are statistically significant. For the primary care health

outcomes in Panels A and B, the magnitude of the €2,500 income shock’s effect is

between 0.01 and 0.02 standard deviation units in those cases where the coefficient is

negative, indicating a health improvement. In all cases, estimates are not statistically

distinguishable from zero.10 Taken together, the precision of the estimated effects is

high, and we can bound the effect within ± 0.09 standard deviation units.

 Columns 5 to 8 in Table 4 display the results for different health problems. As

before, a €2,500 increase in income does not have a statistically significant effect on

primary care health outcomes due to respiratory issues (Column 5), infection (Column

6), injuries (Column 7), or mental health conditions (Column 8). The estimates for

primary care outcomes are precisely estimated such that we can reject health

improvements that reduce the number of health problems by more than 0.09 standard

deviation units.11

10
 The estimated impact is -0.009 standard deviation units (-0.139/15.269) for health
problems at 0 to 4 years of age and 0.078 (0.499/6.349) for health problems at 5 to 8
years; the impact is 0.03 (0.074/2.699) standard deviations for health referrals at 0 to 4
years of age and -0.025 (-0.019/0.754) at 5 to 8 years. For 0 to 4 year-old visits to
primary care the impact is 0.009 standard deviations (0.264/26.869) and for 0 to 4 year-
old prescriptions, 0.007 (0.258/37.664).
11
 Following similar calculations to those explained in note 8, the lower confidence
interval estimate for respiratory health problems is -0.080 standard deviation units for
children aged 0 to 4, and -0.032 for children aged 5 to 8; the lower estimated confidence
interval for health problems due to infections is -0.066 standard deviation units for
children aged 0 to 4 and -0.074 for children aged 5 to 8 years; the lower estimated
confidence interval for health problems due to injuries is -0.092 for children aged 0 to 4
years and -0.021 for children aged 5 to 8 years; the lower estimated confidence interval
for health problems due to mental health is -0.075 for children aged 0 to 4 and -0.025
for children aged 5 to 8 years.

 20
The results of estimating Equation (2) for the hospitalization outcomes are reported

in columns (1)-(5) of Table 5. According to our estimates, a €2,500 increase in income

does not appear to have a statistically significant effect on the probability of an all-cause

hospitalization, or on hospitalizations due to respiratory, infection, injuries, or mental

disorders. These estimates are not statistically distinguishable from zero.

 Due to the aggregate nature of the data, the precision of the hospitalization

estimates is not as high as in the case of primary care outcomes. However, we can

tightly bound the effect of the income shock on the probability of being hospitalized

around +0.04 and -0.02 percentage points, and, with the exception of hospitalizations

due to injuries, we can rule out reductions in the likelihood of being hospitalized larger

than 10 percent.12

 Tables A.3 and A.4 in the Appendix show that our estimates for the impact of the

bonus on health outcomes are robust to different model specifications, choice of

bandwidth, polynomial order, and the inclusion of pre-determined variables as controls.

Educational Outcomes

Table 6 shows the estimated effects of the bonus on primary school outcomes from

estimating Equation (1) in the two regions for which we had access to administrative

data. The results suggest that the benefit had no impact on children’s school outcomes.

Columns (1) and (2) present estimated effects on Math and Spanish, the two subjects for

12
 For hospitalization rates, we offer the size of confidence intervals as a percentage of
the average rate in the population. The estimated impact for all hospitalizations in
column 1 of Table 5 is 0.031, that is, about 4% for an average hospitalization likelihood
of 0.694. The corresponding lower 95% confidence interval is -0.41, that is, -5.9%. For
respiratory diseases the lower confidence interval is -0.007, that is, -5.9 percent of the
average population rate of hospitalization; for infections the lower confidence interval is
-0.007, that is, -6.6 percent of the average rate of hospitalization for infections; for
injuries, the lower confidence interval is -0.008, and that involves a reduction of about
22 percent; for mental disorders, the lower confidence interval is -0.008, that is, about
10 percent of the average likelihood of hospitalization for mental health problems.

 21
which we have information across both regions. The estimated effect on Math

achievement is negative but non-significant, -0.048 standard deviation units in

Andalusia and -0.042 standard deviation units in Catalonia.

 The 95 percent confidence intervals (-0.138 to 0.042 for Andalusia and -0.179 to

0.095 for Catalonia) allow us to rule out fairly small effects: for math test scores, we

can discard effects larger than 5 percent of a standard deviation for Andalusia and larger

than 9 percent of a standard deviation for Catalonia.

 The results for Spanish test scores paint a very similar picture. The estimated effect

on Spanish achievement is also negative and non-significant for Andalusia (-0.064

standard deviation units, 95 percent CI -0.162 to 0.034), and borderline significant for

Catalonia (-0.125, 95 percent CI -0.272 to 0.022). Similarly, we can reject causal effects

of the bonus larger than 3 percent of a standard deviation for Andalusia and 2 percent of

a standard deviation for Catalonia.

 Columns (3) to (6) in Table 6 report estimated effects of the bonus on additional

schooling outcomes: the likelihood of grade retention for Andalusia, standardized

second-year Catalan and English grades, and third-year GPA for Catalonia. We find no

evidence that the bonus significantly impacts any of these outcomes. We can tightly

bound the effect of the income shock on the likelihood of being retained around +/- 0.3

percentage points, and can rule out reductions in the likelihood of being a repeater

larger than 6 percent.13 For Catalonia, the impacts reported in columns (4) to (6) are all

insignificant, ranging from -0.082 standard deviation units for GPA to -0.031 standard

13
 The 95 percent confidence interval for the estimated impact on being a repeater is (-
0.003, 0.029).

 22
deviation units for English. The corresponding 95 percent confidence intervals allow us

to reject causal effects larger than 0.124 standard deviation units.14

 Table A.5 in the Appendix shows that our estimates for the impact of the bonus on

school outcomes are robust to different model specifications, including the full set of

family background covariates as controls (child’s sex, single-parent family, education

level of both parents, and indicators for at least one parent with a high-skill job and at

least one parent unemployed).

5.2. Results by Age, Sex, and Socio-Economic Status

In this section, we explore heterogeneous effects of the baby bonus by age of the child,

sex of the child, and socio-economic status.

 We consider age first. Most of the literature focuses on effects either early on in a

child’s life, or much later when the child has reached adulthood, but, as recently

emphasized by Almond et al. (2018), much less is known on the impact of increased

income during middle childhood. The literature looking at early childhood intervention

programs has documented immediate gains in test scores that fade out as children enter

elementary school but re-appear many years later in terms of completed schooling

attainment or other long-term effects (Almond, Currie, and Duque 2018; Garces,

Thomas, and Currie 2002).

 Figures 3 to 5 show that benefit eligibility had no impact on health outcomes at any

age, except for a small and borderline significant increase in the hospitalization rate of

two-year-old children. However, this result does not survive a multiple hypothesis

14
 The upper confidence interval estimate for Catalan grades is 0.065 standard deviation
units; for English grades, is -0.124 standard deviation units; and for GPA is 0.065
standard deviation units.

 23
testing correction.15 Overall, we can rule out that the results presented in Section 5.1

may hide any significant impact of the bonus for children at specific ages.

 Recent literature has documented that boys’ behavioral and educational outcomes

are disproportionally affected by family disadvantage compared to girls’ (Autor et al.

2019). Consistently, increases in income improve boys’ educational and health

outcomes to a larger extent than girls’ (Milligan and Stabile 2011). It may well be that

the baby bonus has a different impact for boys and girls. Table 7 stratifies the sample by

child’s sex and shows that none of the health or education impacts of the bonus are

significant for boys (Panel A) or girls (Panel B).

 Most of the literature reviewed in Almond, Currie, and Duque (2018) and Cooper

and Stewart (2020) focuses on shocks that are either targeted to low-income families

(Dahl and Lochner 2012; S. E. Black et al. 2014; Hoynes, Schanzenbach, and Almond

2016), show larger impacts for lower income samples (Akee et al. 2010; Cesarini et al.

2016; Løken, Mogstad, and Wiswall 2012), or only have positive impacts for the lower

income sample (Milligan and Stabile 2011). We explore whether our main results may

hide any significant impact of the bonus for children from different family backgrounds

in Table 8.

 We partition the data into children from low and high socioeconomic backgrounds.

Low-income status is defined by the family having a yearly income below €18,000 in

Columns (1) and (2), by the family residing in a region with a yearly income below the

median in column (3), and by having neither parent with more than high school

education in columns (4) to (7). Again, we do not find consistent evidence that benefit

15
 We computed p-values using the Romano and Wolf correction procedure separately
on each primary outcome to take into account that we were testing multiple hypotheses
for each child's age. For the two-year-old hospitalization rate, we observe that, even
though in our main regression the coefficient was statistically significant at the 95%
level, the same does not hold after the Romano-Wolf correction (p-value = 0.3663).

 24
eligibility had any significant impact on children’s health and educational outcomes ,

even in households of socioeconomic status.

6. Mechanisms

Previous literature has identified different channels through which income can influence

children’s outcomes, either by affecting the availability of parental time and money

resources (Akee et al. 2010) or by improving parenting and parental mental health

through stress reduction (Milligan and Stabile 2011).

 For instance, parents may choose to increase or decrease their time investments in

children in response to increased income. If leisure (or childcare time) is a normal good,

parents may decrease their labor supply in order to spend more time with their children,

potentially improving children’s outcomes (Guryan, Hurst, and Kearney 2008; Fiorini

and Keane 2014; Agostinelli and Sorrenti 2018).

 Also, income transfers may improve parental emotional wellbeing (Milligan and

Stabile 2011; Evans and Garthwaite 2014), leading to reduced family conflict and

couple divorces or separations (Akee et al. 2018). Finally, if children are normal goods,

then increased income may also increase the demand for additional children (Becker

1960; D. Black et al. 2013; González 2013). If parental investments per child decrease

with family size (Becker and Lewis 1973; Price 2008), children in larger families may

display worse outcomes.16

 Even though we fail to find any significant impact of increased income on any of

our child health and education outcomes, we explore whether the baby check impacted

any of the potential mechanisms. Understanding whether and how parental outcomes

16
 Most of the papers in this literature find no impact of increased family size on child
quality in developed countries (S. E. Black, Devereux, and Salvanes 2005) but negative
effects on schooling outcomes in developing countries (J. Lee 2008; Kugler and Kumar
2017).

 25
were affected by the policy change may be relevant for the effective design of policy.

Learning about potential negative work incentives of universal cash policies, such as the

baby check, will also contribute to the debate regarding the potential negative impacts

of universal basic income policies on labor supply (Hoynes and Rothstein 2019; Jones

and Marinescu 2018).

 To study potential parental behavioral changes as a result of the policy, we use data

from the Spanish Labor Force Survey (Encuesta de Población Activa) for 2006-2017.

The survey interviews a representative sample of the Spanish population of about

160,000 individuals each quarter. We use this supplemental dataset to study maternal

labor supply, maternal partnership and divorce status, and subsequent fertility.

 Table 9 presents the results from estimating Equation (1) (as presented in note 5)

for our four mechanism variables measured from ages 0 to 8. None of the estimates are

significantly different from zero. Given the survey nature of the data, our estimates are

less precise. However, we can rule out behavioral responses larger than +/-2 percentage

points. In particular, we are able to rule out increases in subsequent fertility larger than

2 percentage points (7 percent), increases in partnership status larger than 1.7

percentage points (1.9 percent),17 reductions in maternal labor supply larger than 0.6

percentage points (1.2 percent), and reductions in divorced status larger 1.3 percentage

points (28 percent).18

17
 A priori income should increase subsequent fertility and partnership status. The upper
confidence interval for subsequent fertility is 7 percent ((-0.006+1.96*0.012)/0.247), for
partnership status, 1.9 percent ((0.002+1.96*0.008)/0.901). So we reject increases in
subsequent fertility larger than 7 percent and increases in partnership status larger than
1.9 percent as a result of the baby bonus.
18
 Conversely, income is assumed to reduce maternal labour supply and divorced status.
The lower confidence interval for maternal labour supply is -1.2 percent ((0.021-
1.96*0.014)/0.500). We can reject reductions in labour supply larger than 1.2 percent.
The lower confidence interval for divorced status is -28 percent ((0.002-
1.96*0.006)/0.049).

 26
Figure 6 shows differentiated impacts of the baby bonus on parental outcomes by

age of the child. Coincident with previous studies investigating the impact of the

Cherokee casino opening (Akee et al. 2010) and the Norwegian childcare subsidies

(Black et al. 2014), we do not find that benefit eligibility had a significant impact on our

mechanism variables, including labor force participation, in the short or long term

(Panels A, B, C, and E).19 The only exception comes from marital status.

 In line with previous literature documenting an improvement in parental

relationships within the household once Casino payments begin (Akee et al. 2018), we

find that benefit eligibility indeed led to a lower probability of divorce during the two

years following childbirth, although the effect is short-lived (Panel C). However, we

also show that eligible mothers are no less likely to be living with a partner (Panel D in

Figure 6), which suggests that time investments in the child were not drastically

affected.

 Finally, similarly to previous analyses by Cesarini et al. (2016) on the impact of

lottery wins, Tables A.6 and A.7 in the Appendix use the Spanish Household Budget

Survey (2008) and the Spanish EU-SILC (2006-2016) to show that neither household

expenditures in child-related goods and services, healthcare, tobacco, and electricity,

nor childcare or schooling arrangements of children under 8 years of age were affected

by baby bonus eligibility.

7. Comparison to Previous Causal Estimates

We have provided credible causal estimates for the impact of an income shock on a

variety of children’s outcomes using administrative data. In this section, we use a

19
 González (2013) finds that eligible mothers took longer to return to work the year
after birth, following a regression discontinuity design. Our coefficient for the first year
after birth is indeed negative, but statistically indistinguishable from 0, which may stem
from our stricter specification that uses 2006 births as controls.

 27
comparative benchmark for our estimates and contrast them with the effect sizes found

in the relevant papers investigating a causal relationship between income shocks and

children’s outcomes in developed countries.

 Column 1 in Table 10 presents the papers selected for our benchmarking, in

chronological order. We select papers included in the latest literature review studies

analyzing the impact of household financial resources on any of the child outcomes

analyzed here, which look at transfers that are directly received by the household during

childhood, independently of whether child outcomes are measured contemporaneously

to the income shock or with a lag (see Almond et al. (2018) and the meta-analysis of

Cooper and Stewart (2013, 2020)).

 Column 2 provides information on the main features of the policy used as an

exogenous source of income variation. In order to maximize the comparability of our

estimates to previous work, we restrict the sample to studies set in Europe and North

America estimating causal effects based on a natural, policy, or randomized control trial

experiments, excluding descriptive papers using cross-sectional methods.20

 According to the latest estimates in the most recent literature review by Cooper and

Stewart (2020), all of the studies that satisfied our inclusion criteria examining health

and student outcomes at any point in childhood report positive effects on at least one of

the outcomes.

20
 We exclude a few papers studying near-cash programs supplying land or food aid,
such as papers analyzing the Georgia’s Cherokee Land Lottery (Bleakley and Ferrie
2016) or the US food stamp program (Hoynes, Schanzenbach, and Almond 2016), and
changes in broad economic circumstances that may impact not only family resources
but also livelihoods, consumption, and parental employment (see for instance Løken
2010 and Løken, Mogstad, and Wiswall 2012). We also exclude a large literature on the
impact of family income on health at birth, as the Spanish baby bonus was not
anticipated and was introduced retrospectively, which rules out any effect on birth
outcomes. There is one paper exploiting a baby bonus policy similar to ours in the
Australian context, Lynch et al. (2019), in which the bonus gave rise to strategic birth
delays in order to qualify for the cash (see Borra, González, and Sevilla 2019).

 28
You can also read