Public Investments and Class Gaps in Parents' Developmental Expenditures
←
→
Page content transcription
If your browser does not render page correctly, please read the page content below
EdWorkingPaper No. 21-376

           Public Investments and Class Gaps in
           Parents’ Developmental Expenditures

           Margot I. Jackson                       Daniel Schneider
           Brown University                        Harvard University

           Families and governments are the primary sources of investment in children, proving access to basic
           resources and other developmental opportunities. Recent research identifies significant class gaps
           in parental investments that contribute to high levels of inequality by family income and education
           and, potentially, to inequality in children’s development. State-level public investments in children
           and families have the potential to reduce class inequality in children’s developmental environments
           by affecting parents’ behavior. Using newly assembled administrative data from 1998-2014, linked
           to household-level data from the Consumer Expenditure Survey, we examine how public sector
           investment in income support, health and education is associated with the private expenditures of
           low and high-SES parents on developmental items for children. Are class gaps in parental
           investments in children narrower in contexts of higher public investment for children and families?
           We find that more generous public spending for children and families is associated with
           significantly narrower class gaps in private parental investments. Moreover, we find that
           equalization is driven by bottom up increases in low-SES household spending for the progressive
           investments of income support and health, and by top down decreases in high-SES household
           spending for the universal investment of public education.

           VERSION: April 2021

           Suggested citation: Jackson, Margot, and Daniel Schneider. (2021). Public Investments and Class Gaps in Parents’
           Developmental Expenditures. (EdWorkingPaper: 21-376). Retrieved from Annenberg Institute at Brown
           University: https://doi.org/10.26300/m5r4-1t20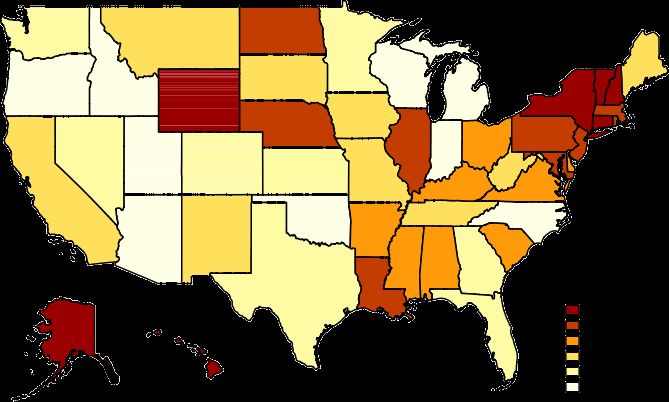
Public Investments and Class Gaps in Parents’ Developmental Expenditures

Margot I. Jackson, Brown University*
Daniel Schneider, Harvard University

April 2021

*Brown University Department of Sociology, Box 1916, Providence RI 02912. 401.863.3192,
margotj@brown.edu

Public Investments and Class Gaps in Parents’ Developmental Expenditures

Abstract
Families and governments are the primary sources of investment in children, proving access to
basic resources and other developmental opportunities. Recent research identifies significant class
gaps in parental investments that contribute to high levels of inequality by family income and
education and, potentially, to inequality in children’s development. State-level public investments
in children and families have the potential to reduce class inequality in children’s developmental
environments by affecting parents’ behavior. Using newly assembled administrative data from
1998-2014, linked to household-level data from the Consumer Expenditure Survey, we examine
how public sector investment in income support, health and education is associated with the private
expenditures of low and high-SES parents on developmental items for children. Are class gaps in
parental investments in children narrower in contexts of higher public investment for children and
families? We find that more generous public spending for children and families is associated with
significantly narrower class gaps in private parental investments. Moreover, we find that
equalization is driven by bottom up increases in low-SES household spending for the progressive
investments of income support and health, and by top down decreases in high-SES household
spending for the universal investment of public education.
Public Investments and Class Gaps in Parents’ Developmental Expenditures

INTRODUCTION

       For all children, particularly the 50% of children in the United States who live in low-

income families at or below 200% of the poverty line, families and governments are the primary

sources of investment in children, providing vital support for basic resources and broader

developmental opportunities (Bradbury et al. 2015; Corak et al. 2011; Corak 2013; Waldfogel

2016). The relationship between family socioeconomic status and children’s well-being is well-

documented and has grown stronger in recent decades (Duncan and Brooks-Gunn 1997; Reardon

2011). Recent research also identifies significant class gaps in parental investments that contribute

to high levels of inequality in family environments by income and education. Parents with more

income and education invest more resources and developmentally targeted time toward their

children (Hao and Yeung 2015; Hernandez-Alava and Popli 2017; Kalil, Ryan and Corey 2012;

Pensiero 2011).

       While some have called on high-SES parents to consciously change their approach to

parenting and reduce private investments of money and time in children (Reeves 2017), actually

achieving such a dramatic cultural change is a difficult path to reducing childhood inequalities.

Public investments in children and families have the potential to reduce class inequality in

children’s development both through direct positive effects on children and, potentially, by

affecting parents’ behavior and practices. By providing a baseline of resources, public investments

may free low-income parents to reallocate expenditures from necessities to additional investment

goods, including learning items, stimulating activities, and nutritious food (Milligan and Stabile

2009; Yeung, Linver and Brooks-Gunn 2002).
2
Public investments, as an indicator of the strength of the welfare state, may therefore have
an equalizing effect on parents’ private educational investments in their children. However, there
is very limited evidence on how public investments are associated with inequality in private
investments (Gregg, Waldfogel and Washbrook 2006; Halpern-Meekin et al 2015) and inference
from existing cross-national research is limited by significant problems of confounding (e.g.,
Bradbury et al. 2015). The federalist character of the U.S. welfare state provides a valuable
opportunity to examine if more generous public investment may narrow class inequalities in
private parental investments in children. Just as there is cross-national variation in the strength of
welfare states and their effects on poverty and well-being, there is substantial state-level variation
in public investments in U.S. children and families, with some states far below and some far above
the national average (Billen et al. 2007; Harknett et al. 2003; Isaacs and Edelstein 2017). There is
also heterogeneity in generosity over time as the U.S. welfare state has contracted for children
relative to older adults, and substantial variation by parental SES as many forms of government
investment in children are progressive and targeted (Moffitt 2015). Further, as policy discussions
increasingly focus on states as the level at which policies are produced and administered, social
scientists face the challenge of understanding how state policy contexts affect inequality in
parenting practices and child development, and how changes in state policy provision can reduce
inequality.
Using newly assembled administrative data over a period of almost 15 years, linked to
household-level data from the Consumer Expenditure Survey, we examine how public sector
investment in several domains—income support, health and education—is associated with the
private expenditures of low and high-SES parents on developmental items for children. We then
examine how these behavioral effects on private investment may combine to reduce socio-3
economic inequality in parental expenditures on developmental investments in children. Stated
differently, we ask if class gaps in private parental investments in children are narrower in contexts
of higher public investment for children and families?
We find that more generous public spending for children and families is associated
with significantly narrower class gaps in private parental investments. When total state spending
is higher, income and educational gaps in expenditures on developmental items are lower. Next,
we disaggregate public investments into those focused on education, health care, and income
support. We find that each form of public investment is equalizing in private investment, but that
equalization is bottom up (increased spending among lower-SES households) for more progressive
forms of investment—income support and health—and top down (decreased spending among
high-SES households) for the universal investment of public educational spending on children.
BACKGROUND
The Family as a Contributor to Inequality: Class Variation in Parenting Practices
In an era of high economic inequality and low intergenerational mobility (Piketty and
Saez, 2014; Chetty et al., 2017), the institution of the family has received a great deal of attention
as a contributor to intergenerational inequality. The reproduction of social inequality begins at a
very young age (Jonsson 2010), and the family is a particularly central institution in children’s
lives: within this context resources are redistributed from parents to children, children’s daily
activities are managed, and direct care is provided. Parental behavior, in particular, is an important
mechanism for reproducing, reinforcing and attenuating class variation among families. While
household income, education and wealth indicate the resources available in the home, parents’ use
of money and time more directly indicate the allocation of resources (Hao and Yeung 2015).4
Indeed, parenting practices differ substantially by class, and the strong correlation between
parental SES and private developmental investments in children illustrates just how difficult it can
be to separate inequality in outcomes from equality of opportunity.
High-income and highly educated parents are better able to allocate resources for
children in ways that are highly valued in educational and labor market institutions (Becker and
Tomes 1979; Corak 2013; Hao and Yeung 2015). There are pronounced socioeconomic
differences in parents’ involvement with children’s educational activities (Alintas 2016; Bassok et
al. 2016; Cheadle 2009; Kalil et al. 2016; Lareau 2002; Pensiero 2011; Ramey and Ramey 2010;
Roksa and Potter 2011) and in parents’ investments of money on items for children (Kornrich
2016; Kornrich and Furstenberg 2013; Schneider, Hastings and LaBriola 2018), and these gaps
appear to be widening over recent decades. While both parental income and education are strong
contributors to private parental investments in children, some evidence suggests that education
more strongly predicts parental behavior than income (Hao and Yeung 2015; Harding, Morris and
Hughes 2015).
The weight of evidence suggests that the resources and content of time available to
children are positively associated with their development. Large class gaps in cognitive
development exist well before the start of formal schooling, pointing to the importance of parental
input and the home environment for children’s cognitive and non-cognitive development (Duncan
and Magnuson 2011; Hernandez-Alava and Popli 2017; Waldfogel and Washbrook 2011). Indirect
evidence for the importance of home environments for child development comes from the seasonal
learning literature, which demonstrates that class gaps in achievement widen most over the
summer months (Alexander, Entwisle, and Olsen, 2007; Downey, von Hippel, and Broh, 2004),
although recent work fails to replicate this longstanding result (von Hippel 2019). Most existing5
research measuring the content of parental investments focuses on either the presence of particular
resources, or on parental time. For example, the presence and quantity of books, games, toys and
other learning materials that are developmentally appropriate is strongly related to children’s
development and educational attainment (Dronkers 1992; Evans et al. 2010; Tamis-LeMonda et
al. 2019; Totsika and Sylva 2014). Some research classifies these types of learning materials and
child-focused goods, including clothing and furniture, as enrichment items that influence child
development both directly and indirectly, through exposure to materials that facilitate the
development of cultural capital (Kornrich and Furstenberg 2013; Kornrich 2016). Research
linking parental expenditures in particular to children’s well-being is scarce. While a large body
of research documents the effects of family economic resources and government cash transfers on
child outcomes (e.g., Bitler, Hines and Page 2018; Duncan and Magnuson 2005; Mayer and Leone
1997), it is not clear how patterns of parental spending affect children’s well-being. What is clear,
though, is that parental expenditures on children are an increasingly unequal form of parental
investment alongside time use and family size, two important predictors of children’s well-being.
The Role of Public Investments
Children’s family environments are influenced not only by private parental
investments, but by their embeddedness within political institutions (Brady, Fullerton and Cross
2009; Tilly 1998). Public investments in children and families provide an opportunity to
understand the effects of the welfare state on both the social institution of the family and on
children’s developmental opportunities. While private parental investments exhibit stark
inequality along the lines of income and parental education, many forms of public spending are
considerably higher for low-income children than for higher income children (Vericker et al.,6
2012). Such public investments in children and families may then serve to increase equality of
opportunity for low-SES children, as well as reduce class gaps in family behavior (Bradbury et al.
2015; Corak, Curtis and Phipps 2011; Corak 2013; Waldfogel 2016). The majority of public
spending on children is on education (K-12; Head Start), health (Medicaid; non-Medicaid public
health spending) and income support/social services (Temporary Assistance for Needy Families
(TANF); the Supplemental Nutrition Assistance Program (SNAP), or food stamps; child care
assistance; child welfare; child support enforcement; and earned income tax credits (EITC)).
Beyond education spending, five spending and tax programs comprise most spending on children:
Medicaid, the EITC, the child tax credit, SNAP and the dependent exemption.
While public spending on children has risen over time, it has grown more slowly than
spending on adults, and is declining as a share of the federal budget (Edelstein et al. 2016; Isaacs
et al. 2017; Moffitt 2015). In contrast to trends in private investment, however, many forms of
public spending are progressive, that is, disproportionately targeted at low-income children
(Vericker et al., 2012). This feature of public investments, combined with theory and evidence,
suggest that public investments can improve outcomes for low-income children (Bradbury et al.
2015; Corak, Curtis and Phipps 2011; Corak 2013; Solon 2004; Waldfogel 2016). Public
investments may improve children’s access to resources both outside and inside the home. There
are direct positive health and academic effects of a number of child and family-focused
investments, including school spending, child tax programs, public preschool, the Nurse-Family
Partnership, WIC and school nutrition programs (Jackson 2015; Johnson 2015; Yoshikawa et al.
2013). By directly augmenting resources outside of the home that may foster health and
development and targeting that investment to children from low-SES families, public investments
may directly reduce class gaps in children’s development.7
Linking Public Investment to Private Parental Investment: Low-SES Households
It is also possible that some of what we currently consider to be direct effects of
programs on children may work through family processes that have not yet been well-examined.
While differences in parental spending are often an implied key pathway through which public
investment affects children (e.g., Reardon 2011), theoretical and empirical understanding of the
relationship between the state and family behavior is very limited. Public investments may reduce
class gaps in private parental investments in children by increasing the funds available to lower-
SES parents to invest in children, both through direct cash assistance and by providing directly
necessities that parents would otherwise need to purchase. By providing a baseline of resources,
welfare state investments in children and families may free low-income parents to reallocate
expenditures from necessities to additional investment goods (Milligan and Stabile 2009; Yeung,
Linver and Brooks-Gunn 2002).
This resource-based pathway is perhaps clearest for income security programs such as
TANF, SNAP, EITC, and SSI. The targeted nature of these programs efficiently directs resources
to those at the greatest risk of poverty and hardship, leading many to argue that these investments
are an efficient and essential part of the anti-poverty welfare state (Belsey 1990; Brady and
Burroway 2012; Le Grand 1982). Indeed, there is some evidence for increases in child-related
expenditures in response to income transfers. A small body of regional and ethnographic evidence
suggests that EITC recipients prioritize consumption spending on short-term needs broadly
(Romich and Weisner 2000; Smeeding, Phillips and O’Connor 2000) as well as investments in
children specifically (Tach et al., 2017). Children exposed to increases in income support benefits
in the U.K., for example, experience increased expenditures on books and nutritious food alongside8
reductions in material hardship (Gregg, Waldfogel and Washbrook 2006). Some qualitative work
also demonstrates changes in the content of child-centered spending in response to increased
income (Farrell and O’Connor 2003; Halpern-Meekin et al. 2015). The small body of existing
research suggests an important influence of income support programs on both decreasing material
hardship and increasing child-centered expenditures. We would thus expect that more generous
public income supports would be associated with a narrowing of class-gaps in private parental
investments in children, via increased child expenditures among lower-SES households
Public investments through health care programs such as Medicaid and state children’s
health insurance programs (CHIP) may play a similar role, although there is less evidence on this
issue. While these programs do not provide the direct cash assistance of income support programs,
they are both means-tested and progressive and may replace a threshold of necessary private
expenditures on health care (Leininger, Levy and Schanzenbach 2010). In combination, public
spending on health care programs may then free-up financial resources for low-SES families that
could be deployed for private parental investment in children.
That parental private investment in children would increase with resource availability
is, however, not a forgone conclusion. Cultural logics of “good parenting” vary significantly over
time (Hays, 1998; Wrigley, 1989) and across groups (Lareau 2003). While private expenditures
on developmental goods for children may be part-and-parcel of the logics of intensive parenting
or concerted cultivation embraced by high-SES parents (Lareau 2002; Calcaro 2014; Kalil 2015),
this same work suggests that lower-SES parents may follow a logic of “natural growth” that does
not associate such expenditures with “good parenting” (Lareau 2002). The implication of a strong
version of this argument would be that more generous public investments in income security and
health care would then not increase low SES parents’ private parental investment in children9
because lower expenditures are not the product of resource constraint, but rather of a
fundamentally different cultural logic of parenting. However, recent work actually finds evidence
of consistent parenting logics by class (Ishizuka, 2018) and earlier work finds that SES differences
in parental investment are in fact largely explained by resource differences (Chin and Phillips,
2004; Bennett et al., 2012).
Further, while critiques of the cultural logics perspective have focused narrowly on
resource inequality as a competing explanation, class differences in the cultural logics of parenting
are intertwined with broader structural inequalities, seen vividly, for example, in Pugh’s (2015;
2018) connection of broad economic insecurity and parenting logics. This more nuanced
understanding of the link between economic structures and cultural logics of parenting suggests
that structural and cultural are not competing explanations for class inequality in private parental
investment (Freeman et al., 2019). Instead, in the case of public investments in children, such
broad changes to the opportunity structure might themselves shape the social, economic, and
institutional environment in which cultural logics of parenting develop. A large body of research
points to the importance of country as context, emphasizing the ways in which welfare state
generosity and national contexts influence egalitarian attitudes and beliefs (Brady and Bostic 2015;
Brooks and Manza 2007; McCall 2013). The smaller level of the state may also form a type of
structural and cultural context. In state contexts of more generous public investment in children,
low-SES parents might develop cultural logics of parenting that see parental private investment in
children as good parenting. In this, way, an absence of association between low-SES parents’
private parental investments in children and public investment in children would be indicative of
class differentiation in the cultural logic of parenting. But, a positive association could be traced10
to either a simple resource constraints explanation or to the intertwining of structural/contextual
factors and cultural logics of parenting.
Another key domain of public investment is education spending, including public
spending on early childhood education as well as K-12 public education. Like health spending,
some public educational investments are targeted and might provide a baseline of public support
that could free-up resources for alternative investments. For instance, expenditures that low-SES
families might make on private childcare or pre-school could be displaced by public investments
in Head Start or state pre-kindergarten programs, and so made available for other forms of private
parental investment.
However, the vast majority of public educational spending is dedicated to elementary
and secondary education. Such expenditures at the state level are the combination of federal funds,
state funds, and local spending. Thus, unlike public income supports and health care supports,
these investments are not targeted by family income. Rather, they fall into the category of
“universalist” investments (Skocpol 1991) that are generous and often more politically popular
than more targeted programs (Korpi and Le Palme 1998). Some argue that, while universalist
investments lack efficiency, their generosity and political effects may lead to a larger
redistributional and inequality-narrowing impact than targeted investments (Korpi and Le Palme
1998; Rainwater and Smeeding 2004). It is unclear whether universal child-focused policy is more
popular than targeted investments, given evidence showing that public opinion about universal
preschool favors a targeted approach (Bobo and Klugel 1993; Greenberg 2018). In the case of
education investments in children, while lower-SES children might directly benefit from higher
educational spending being associated with higher quality public schools (LaFortune et al., 2018;
Hyman, 2017), the reality is that the overwhelming majority of lower-SES students would attend11
public schools no matter what the degree of public investment in such schools. Indeed, while
private school enrollment rates are over 15% among high income families, low-SES parents
enrollment rates in private schools are significantly lower, at just 5% and, as such, there is far less
room on the extensive enrollment margin for low-SES parents to switch from private to public
schools in the context of more generous public investment in education (Murnane et al. 2018).
Therefore, while we expect that generous public expenditures on health might free-up resources
for lower-SES families to invest in children that they might otherwise spend on healthcare, such a
dynamic is unlikely for public educational expenditures.
Linking Public Investment to Private Parental Investment: High-SES Households
While we hypothesize that public income and health supports will affect private
spending of low-SES parents through a family resource pathway, we have no such expectation for
high-SES parents. In some countries, the system of public provision is set up to be taken up
universally. Norway and other Scandinavian welfare states, for example, provide economic and
in-kind support for childcare, education and other services to families across the socioeconomic
distribution (e.g., Gornick and Myers 2003), and in these countries parental spending on children
is less unequal than in the United States (Kornrich, Ruppanner and Lappegard 2019). In contrast,
the United States has a more limited welfare state for children, and direct expenditures on income
support and health care are generally means-tested (Vericker et al., 2012). As a result, it is less
likely that public sector investments in these areas would meaningfully affect the resources of
high-SES families.
In contrast, more generous public investment in the educational domain may be more
strongly related to child investment among higher-SES parents. Higher educational spending is12
associated with higher quality public schools (LaFortune et al., 2018; Hyman, 2017). This public
investment in public schooling may allow households with more income and education to access
normally fee-based services through the state, including school-based programs and activities, as
well as schooling itself (Buddin et al., 1998; Bosetti and Pyryt, 2007). For example, average tuition
costs $23,000 at non-sectarian private schools and $6,000 at Catholic schools (Murnane et al.,
2018). Given private school enrollment rates of 15% among high income families, such
substitution on the extensive margin could free up substantial private resources among high-SES
families that would otherwise be spent on children’s schooling and learning items. The ability of
higher-SES families to access generous state education services could allow high-SES parents to
reduce enrichment expenditures on their children if they are satisfied with publically available
resources. This pattern would be consistent with evidence in Norway, where more universal
provision of education support for families by the state leads to fairly equal parental expenditures
on education and childcare across the income distribution (Kornrich, Ruppanner and Lappegard
2019).
Alternatively, these households may use freed up resources to increase private
developmental spending on their children, reinforcing already unequal patterns of private
investment by social class. Further, if school districts that serve affluent children spend much
more than school districts that serve poor children, then some affluent parents may choose housing
that requires them to spend more than they would otherwise specifically to access public schools
that they believe provide greater benefits to their children. In this case, state education spending
would not be “universal” if more affluent parents can increase private investments in housing to
obtain better schools for their children. However, while local educational spending tends to be
regressive (though this varies by state), both state and federal funds are progressive, such that on13
net, total educational spending is not stratified by student SES or is weakly progressive (Chingos
and Blagg 2017). While this does not negate the possibility that regressive local-level dynamics
shape forms of parental investment (e.g., housing decisions), it suggests that investment at the state
level may not be differentially related to behavior across socioeconomic groups.
In aggregate, we expect that more generous public spending across the categories of
income support, health care, and education would narrow class-gaps in private parental
expenditures on investment in children by increasing the economic resources available to lower-
SES parents. We expect that these inequality-narrowing effects will be most pronounced when
public investments are (1) progressive and targeted and/or (2) take the form of cash benefits or
replace necessary private expenditures. By this logic, we expect that income support programs
may have the strongest equalizing effects on private parental investments in children, followed by
public spending on health care. In contrast, generous public spending on educational programs
may have more modest equalizing effects, or any narrowing of class gaps may be driven by
decreasing expenditures among higher-SES households, rather than increasing expenditures
among households with less income and education.
DATA AND MEASURES
We examine how state-level public spending on children is associated with class gaps in private
parental investments in children. To do so, in collaboration with the Urban Institute, we assemble
a new unique state-level comprehensive database of public spending on children and merge these
data at the state-year level to Consumer Expenditures Survey (CEX) data, which contain detailed
measures of financial investments in children, household socio-economic status, and demographic
characteristics.14
Data: State-Level Public Spending
Despite substantial spending variation that puts some states far below and some far above the
national average (Harknett et al. 2003; Isaacs and Edelstein 2017), no existing data source
compiles these measures of spending across states and over time. We use a state-by-year database
of public spending from federal, state and local sources that spans 1998-2014, aiming to cover the
longest period feasible with existing administrative data. The public spending database includes
all 50 states and the District of Columbia, drawing on data from the U.S. Census State and Local
Government Finance Survey (SLGF), federal agency web sites, the State Funding for Children
Database compiled by the Rockefeller Institute of Government (1998-2008), and other sources.
The data contain per-child spending at the state-year level in the domains of education (e.g., total
K-12 spending; Head Start), income support (cash/near cash that goes to families and supports
spending on basic needs: e.g., Temporary Assistance for Needy Families (TANF), SNAP, child
support enforcement, earned income tax credits (EITC)), health (e.g., Medicaid spending on
children and families and non-Medicaid public health spending), and other spending (e.g., housing,
libraries, parks and recreation). 1
Table 1 lists the programs included in the state-level database, as well as the data sources for
each spending program. Spending on public schools (K-12 education) is the largest form of public
investment in children, with most of this spending coming from state and local governments. State
and local spending on education, for example, varied from $11,625 per child in Vermont to $4,180
1
The data were assembled by Julia Isaacs, Erica Greenberg and Eleanor Lauderback working in collaboration with
the lead author. 2001 is not included in the database because a manpower crisis surrounding the 2002 Census of
Governments led to unavailability of state level estimates in 2001. Therefore, our analytic sample includes 1998-
2000, and 2002-2014.15
per child in Arizona in 2013, even after adjusting for regional price parities (Isaacs and Edelstein
2017). The Medicaid health insurance program, jointly financed by the federal government and
the states, represents the second largest form of investment in children after K-12 education (Isaacs
et al. 2017). Many states have expanded Medicaid beyond federal minimums for benefit and
coverage, leading to wide variation in eligibility levels, service coverage, payment mechanisms
and spending per enrollee. Children also benefit from spending on the Children’s Health Insurance
Program (CHIP) and spending on public health systems. In contrast to public education, which
serves children across income groups, Medicaid and other health programs often target toward
low- and moderate-income families.
There also are a number of income security and social service programs that support
families with children. Some of these are explicitly limited to families with children (i.e., earned
income tax credits, the child tax credit, TANF, child support enforcement, the disabled child
portion of Supplemental Security Income (SSI), child welfare services, child care assistance). In
addition, some programs that serve the low-income population have a disproportionate share of
child recipients. For example, two-thirds of SNAP benefits go to households with children and,
during the most recent recession, SNAP was a primary form of support for children with
unemployed parents (Isaacs and Healy 2014). Most of these programs are federal or jointly
federal-state programs, and many of them target low-income families.
Data: Consumer Expenditure Survey
To measure private parental investments in children, we link the state database to household-level
data from the Consumer Expenditure Survey (CEX) from 1998-2014. The CEX is a nationally
representative survey on the income and expenditures of U.S. households. Households in the CEX16
provide information quarterly about 12 consecutive months. The data are in a household-quarter
structure. The start-month for a quarter is determined by the first month of interview, meaning
that quarters can span more than one calendar year. In such cases, we assign the quarter to the year
during which most of the quarter occurred. Our analytic sample in the CEX consists of households
with children ages 0-18, with no parents over the age of 65.
Response rates to the CEX have declined over time. For instance, since 2012, response rates
have declined from about 70% to 60% (Hubener et al. 2017). This raises the concern that the CEX
might under-represent certain demographic groups. King et al. (2009) compare the CEX to the
ACS in terms of demographics and find many statistically significant differences, but few
substantively large differences. Similarly, Bee et al. (2012) compare the CEX to the CPS and find
little evidence of bias in the demographic composition of respondents to the CEX.
We merge the household-level CEX data with our public expenditures database at the state-
year level. State-level identifiers are suppressed by the CEX for some respondents due to privacy
concerns related to small within state sample sizes. As a result, state IDs are missing in
approximately 14% of household-years in less populated states. The CEX suppressed these IDs
in order to comply with the Census Disclosure Review Board’s criterion that geographically
identifiable areas must have a population of at least 100,000 in order to be disclosed. Our study
period does not include observations from Arkansas, Iowa, Montana, New Mexico, Nebraska,
North Dakota, South Dakota, or Wyoming. All other states are represented in the data across
multiple years. In addition, the CEX imputes missing values on our other key measures (described
in the next section), including income, expenditures, demographic characteristics and work
experience items in each survey round.17
In supplemental analyses, we examine parental expenditure patterns among missing state-
years in the CEX during our study period. Overall, this analysis suggests that, compared to the
entire U.S. population, average private spending is slightly lower among missing state-years, as is
average income. College-educated parents are better represented in the analytic sample than in the
missing state-years. However, the size of income and education gaps in private parental spending
is similar in both observed and omitted state-years. State spending is also very slightly higher in
the analytic sample than in missing state-years. What then can we draw from these data about the
potential for bias? If we had found that state spending was similar in the suppressed state-year
observations but that class gaps were much larger, then that might suggest a possible over-estimate
of our effects. If we had found that state spending was similar in the suppressed state-year
observations, but that class gaps were much smaller, then that might suggest a possible under-
estimate of our effects. But, in fact, we find that the class gaps in private spending and the levels
of public spending were very similar in the analytic sample and in the suppressed state-year
observations. Taken together, this comparison provides no evidence to suggest that the omission
of suppressed state-year observations would bias our estimates.
Measures
Socioeconomic Status. We use two measures of parental SES. First, we measure annual household
income ranks (0-25%, 26-75%, 76-90%, 91+%) relative to state-year incomes of adults with
children in the CEX, with income adjusted to 2014 dollars using the CPI-U-RS series. 2 We
separate incomes in the 76-90th percentiles from the top 10% because of research suggesting that
2
In additional analyses, we estimate models that exclude (a) the top 1% of income and the top 1% of private
expenditures, and (b) separately, the bottom 10% of the income and private spending distribution, in order to
observe the influence of outliers at the top and bottom of the distribution. These results, shown in Appendix Table
1, are substantively identical.18
households in the top income decile have unique spending patterns relative to those in lower
income groups (Kornrich 2016; Schneider, Hastings and LaBriola 2018). Second, we measure
parental education using a four-category measure: less than a high school degree, a high school
diploma, some college, or a four-year college degree or more. In the case of two-parent families,
we take the educational attainment of the parent with the highest attainment. 3 We measure these
SES indicators separately in all multivariate analyses.
Public Investments. We measure state-level real spending per-child in 2014 dollars in several
domains. We begin by measuring total spending relevant to children and families (including
education, health, income support and other spending), and then conduct additional analyses by
spending domain for education, health and income support. The findings presented here include
the measures listed in Table 1 and reflect our choice of public spending programs that are either
strongly targeted to children or families with children (e.g., SNAP), or that may benefit families
with children (e.g., unemployment compensation). 4
An alternative approach would be to measure state-level benefit generosity (e.g.,
eligibility) rather than actual expenditures, since families may not claim all benefits to which they
3
Results using this measure of education produce highly similar findings to results using a three-category measure
(less than high school, high school/some college, or college plus), both with respect to the magnitude of gaps
between higher and lower-educated households, and with respect to variation in education gaps across states.
4
In supplementary analyses, we explore alternative categorizations of each domain that restrict measures to include
only spending programs that are strongly targeted to children or families with children, and find similar results.
Instead of measuring spending per child, for progressive state spending measures (income support and health) we
also measure spending as a share of the number low-income children in each state (for 2000-2014), using data from
the Anne E. Casey Foundation Kids Count Data Center on the number of children below 200% of the poverty
threshold. Our substantive conclusions remain unchanged about income/education gaps in private parental
investment, and bottom-up convergence in this investment as state spending increases.19
are entitled (or may overclaim). However, the primary mechanism by which we expect public
expenditures to affect private investments is by increasing the actual amount of household
resources and as such, the actual expenditures measure is preferred.
Private Parental Investments. Our focal measure of investment is quarterly spending on
developmental items that combines spending on children’s furniture, clothing, equipment,
recreational equipment, toys, games, arts and crafts, musical equipment, and educational books.
This is a per-child, absolute expenditure measure that divides total household expenditures/quarter
by the number of children ages 0-18 in the household. In additional analyses, we scale household
expenditures on children using a square root scale (household expenditures divided by the square
root of the number of children in the household), in order to allow for the possibility that household
needs do not grow in a proportional way. Because these results, shown in Appendix Table 2, are
substantively equivalent, we proceed with the per-child measure. We inflation adjust expenditures
to 2014 dollars using the CPI-U-RS.
This measure of parental investment provides a useful summary of developmental
investment because it captures investment that is not purely consumption. In keeping with
existing research on parental financial investments in children, we view this measure as
capturing spending on in-home items that could plausibly be related to children’s developmental
outcomes, given that previous research has linked the presence or absence of these items to
children’s development (Evans et al. 2010; Kornrich 2016; Totsika and Sylva 2014). In addition,
expenditures on these types of developmental enrichment goods should be more proximately
related to public investment for lower-SES families than other types of expenditures that are out20
of reach for the majority of low-SES families and should therefore be less sensitive to more
generous state contexts of public investment, such as private school tuition or housing. 5
Demographic and State-Level Controls. We include a number of household and state-level control
variables in an effort to account for the many factors that co-occur with socioeconomic status,
parents’ expenditures, and state-level public investments. At the household level, we use CEX
data to control for household size, family structure, parental age, the race/ethnicity of each parent,
and parental work hours. Longstanding evidence documents the associations among these factors
and socioeconomic status, with striking variation in income and parental education by maternal
age, family structure and employment status (e.g., McLanahan 2004).
At the state level, we account for factors that may co-vary with the amount of state spending
on children and families, drawing on data from the University of Kentucky Poverty Center’s State
Welfare data base, from the Current Population Survey, and from the Bureau of Labor Statistics
to construct a number of state-year measures. Given evidence that state-level spending increases
as economic need increases during periods of economic downturn (Brown and Best 2017;
Edelstein et al. 2016; Rodgers and Tedin 2006), we control for the unemployment rate and poverty
rate. As an indicator of state generosity, we control for the prevailing minimum wage. We
5
If school districts that serve affluent children spend much more than school districts that serve poor children, then
some affluent parents may choose housing that requires them to spend more than they would otherwise specifically
to access public schools that they believe provide greater benefits to their children. The large literature in housing
economics on this question finds that a 1 SD increase in test scores is associated with a 3% increase in home prices
(Black and Machin 2011). However, combined, local, state, and federal school funding is not biased by student SES
(Chingos and Blagg 2017) and we find no evidence of an association between generosity of public investment in
education at the state level and the within-state between-district inequality in educational spending using data from
the 2001-2014 Local Education Agency School District survey. Moreover, while it would be incorrect to allocate all
of parents’ housing expenditures to developmental investment (since expenditures on housing accomplish multiple
goals for families), the literature does not offer a guide for how to reasonably estimate the portion of housing
expenditures that can be attributed to school selection. Consequently, we follow all of the existing literature on
parental expenditures on children (e.g. Amorin 2019; Hastings and Schneider 2020; Kornrich and Furstenberg 2013;
Kornrich 2016; Schneider, Hastings and LaBriola 2018; Ziol-Guest, Kalil and DeLeire 2004) and do not attempt to
allocate a portion of housing costs to private parental investment.21
measure states’ governance structures with a variable indicating whether the governor is a
Democrat, as prior research shows that republican control is negatively associated with safety net
generosity (i.e. Brown and Best 2017; Scruggs and Hayes 2017; Soss et al. 2011). Finally, we
account for state demographic composition with the share of the population without a college
degree, that is Black, non-Hispanic, and the share of the population that is Hispanic because prior
literature connects demographic composition with spending generosity (i.e. Alesina et al. 2000;
Rogers and Tedin 2006; Preuhs 2007; Soss et al. 2011).
Analytic Approach
Much existing research examines variation in the amount and effects of public investments at the
country level. A cross-national approach, while valuable, may confound the effects of public
spending with unobserved country characteristics that influence spending and family
characteristics. We focus on the smaller area of the state for both substantive and methodological
reasons. First, it is important to understand the implications of substantial spending variation
across U.S. states, given the increasing emphasis on states as the level at which policies are
produced and administered. Second, it is more feasible to comprehensively measure and control
for detailed variation across states as compared to countries
We use variation in public spending across states and time to describe patterns of public
investment across states and years. After presenting exploratory maps that describe levels of state
spending on children during our study period, we estimate OLS models that use variation both
across and within states to predict private parental investment from household socioeconomic
status and total state spending on children. Although these models control for important observed
differences across households and states, these estimates may be confounded by correlated22
unobserved factors. In order to address this possibility, we next estimate models that include state
fixed effects to control for state differences correlated with spending and family characteristics
(e.g., labor market structure, level of economic need), and year fixed effects to control for time
trends shared across states (e.g., recession effects). Variation across states in the strength of the
labor market and the demographic composition of the population, such as a larger population of
low-income families, could produce a positive relationship between spending and economic need
that does not reflect true variation in states’ investment in children and families. Including state
fixed effects helps to control for these fixed differences across states. In addition, increased
economic need during periods of economic downtown is correlated with increases in spending,
particularly from federal sources, in order to support state/local governments working to provide
assistance to families (Edelstein et al. 2016). Including year fixed effects helps to separate the
effects of spending and government investment from the effects of economic need. In order to
more rigorously examine the association between public investment and class inequality in
parental investment in children, we use the following model:
Yist = β 0 + β1 SES ist + β 2 Spend s ,t −1 + β 3 SES ist XSpend s ,t −1 + β 4 X + µ s + θ t + ε ist
where, for each child i in state s in year t, we model private parental investment in children (Y)—
quarterly expenditures on developmental goods—as a function of SES (parental
income/education); state spending (Spend) in the year prior to that the survey wave; the interaction
between SES and state spending; the household and state-level controls (X) described above; and
state and year fixed effects. We follow Balli and Sorenson (2013)’s suggestion to demean the
items in the key interaction terms in fixed-effects models, demeaning public spending measures
and household income/parental education before creating interaction terms.23
The inclusion of state and year fixed effects means that model identification is based on
within-state variation in public spending across years, as well as across-state differences in public
spending in a given year. We begin by examining total state spending, examining β1 and β3 in order
to test hypotheses about the spending of low and high-SES families in different public investment
contexts, as well as to examine class gaps in parental spending. To facilitate interpretation, we
compute predicted expenditures for each household income rank (0-25, 26-75, 76-90 and 91+). If
public investments reduce class gaps in parents’ developmental expenditures, we expect the main
effect of SES (β1) to be larger (since it includes those in low public spending state contexts) and
the interaction between SES and state spending (β3) to be smaller (since it includes those in higher
spending state contexts). We would expect that if a lack of economic resources are a key barrier
to private expenditures among low-SES parents or if contexts of more generous public spending
induce changes in low-SES parents’ logics of parenting, then increases in public spending should
lead to an increase in expenditures among this group.
The analyses described above use total per-child state-level spending on children and families
(on education, income support, health and other spending) as the measure of public investment.
Next, we consider whether there is meaningful variation in the relationship between public
investments and class gaps in private investments according to the type of public investment. We
estimate separate models for income support, health and education spending in order to assess
whether the equalizing effects of public investment are more pronounced for progressive and
targeted programs than for more universal spending programs such as K-12 education. We also
examine whether any narrowing of class gaps in parents’ expenditures with increases in public
investments is primarily driven by low or high-SES households.24
The key assumption of our approach is that other, unmeasured changes in state characteristics
did not co-occur with changes in state spending on children. Including state and year fixed effects
in the above analyses will reduce bias from stable unobserved differences across states, and from
time trends shared across states. The analyses described above will allow us to rigorously describe
the relationship between public investments and class gaps in parental behavior, and will clarify
mechanisms for reducing inequality by demonstrating whether public investments are related to
parenting practices. However, it is important to acknowledge that our estimates are not causal.
All of our models include the CEX sampling weights (finlwt21) and adjust the standard errors for
clustering at the state-level. Our analytic sample is 118,278 household-quarters.
RESULTS
Describing State Spending Across and Within States
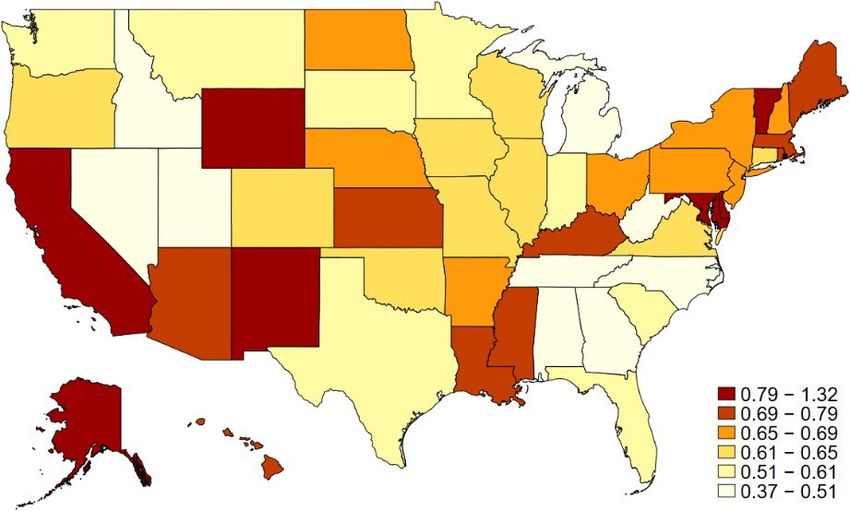
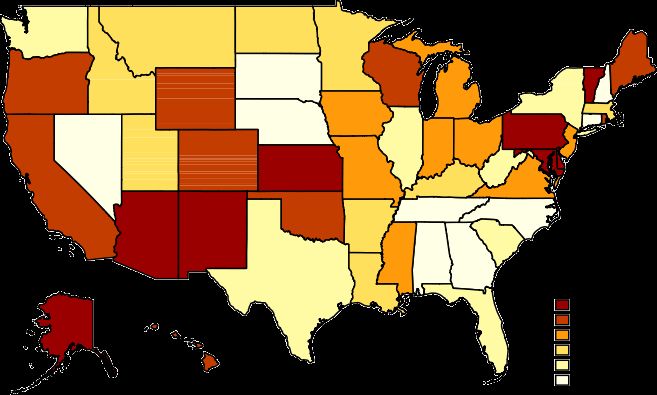
Figures 1 and 2, as well as Table 2, show variation between states in total state spending
per child. Table 2 shows that, in 1998, average total spending per child was $15,100. Figure 1
shows that this amount varies substantially by state, and that there is also a strong geographic
pattern to state investment in children, with states in the Northeast better represented in the highest
spending categories than states in the South and West. For reference, a standard deviation in public
expenditure is equivalent to $5,200 per child. In 1998, the difference between the lowest and
highest-spending states was 2.5 SD: Utah spent $10,000 per child and New York (the highest-
spending state other than DC) spent almost $23,000.
With respect to variation within states over time, Figure 2A shows that states experienced
significant changes in spending between 1998 and 2014. Figure 3A shows that the amount of
change also varied meaningfully across states: while there was growth in spending in all states25
during this period, there was also substantial variation across states in the amount of spending
growth. Vermont, for example, increased total spending per child by 132% or 4 SD, increasing
total per child spending from $15,500 in 1998 to $36,140 in 2014. Georgia, the state with the
smallest percentage increase in state spending, increased spending from $14,000 per child in 1998
to $19,300 in 2014—an increase of 1SD. The average spending increase within states was
$10,200, or 2SD. By 2014, average total spending per child increased to $25,000 per child (Table
2), and the size of the difference between the highest and lowest-spending state had increased to
4.5 SD ($15,200 in Utah compared to $38,500 in New York).
Breaking up total state spending by spending type shows that much of the variability in total
state per-child spending is driven by income support and health programs, as Figures 2B/2C and
Table 2 demonstrate. Per-child spending on income support programs jumped sharply between
2009 and 2010 during the Great Recession (Figure 2B), and then steadily declined through 2014,
although 2014 spending levels remained higher than in pre-recession years. Health spending
(Figure 2C) increased more steadily through 2014, increasing from an average of $4,600 per child
in 1998 to $9,200 per child in 2014. 6 Education spending on children (Figure 2D) also varies
across years, but in a less pronounced way, slowly increasing until 2009 and then slightly declining
after 2012.
Figures 3A-3D show the percent change for each state in total spending, income support
spending, health and education spending per child, respectively. Together, these figures provide
a relative comparison of the amount of change in public investment, using the scale most
6
Much health spending consists of “public health” expenditures on public health administration, public and
environmental health activities, and public health treatment and clinics. Limiting the state health spending measure
to include only Medicaid and CHIP expenditures yields a much smaller average health spending average, of $730
per child. We include all health spending types in our analyses, since the results are not sensitive to excluding any
particular form of health spending that benefits children.26
appropriate for each form of spending. Increases in income support and health spending (3B and
3C) were fairly widespread throughout the U.S., with substantial increases in spending in states
across different regions. Education spending increased substantially in select states during this
period, with a more noticeable geographic component. The states that increased spending the most
are in the Northeast, with Midwestern and Mid-Atlantic states increasing spending by a moderate
amount, and states increasing spending the least generally clustered in the West and South.
State variation in spending, or variation in spending over time, may be especially driven in
some states by differing or increasing need among children, as well as variation in the cost of
providing services if there is a large number of children living in poverty or with special learning
needs. In many cases, however, states with the highest need among children are often lower-
spending states. In other cases, state variation in spending may reflect policy choices at the state
level about how much to invest in child and family policy. For example, expanding Medicaid to
extend coverage to more children would result in increased health spending in states that
prioritized this expansion, such as many states in the Northeast. We rely on this spending variation
within and across states to identify the relationship among public investments, socioeconomic
status and parental expenditures.
Total State-Level Spending and Inequality in Parents’ Developmental Expenditures
To understand how state investments in children are related to inequality in private
investments, we begin by plotting the bivariate association between income and our measure of
private parental investment—quarterly expenditures on developmental items for children. Figure
4 plots this association separately for three categories of state investment: the bottom 10%, 11-
75%, and the 76+ percentiles. The figure shows that income is more weakly associated withYou can also read