"Mixed Oligopoly and Market Power Mitigation: Evidence from the Colombian Wholesale Electricity Market" - Universitat de ...
←
→
Page content transcription
If your browser does not render page correctly, please read the page content below
Institut de Recerca en Economia Aplicada Regional i Pública   Document de Treball 2021/01 1/72 pág.
Research Institute of Applied Economics                            Working Paper 2021/01 1/72 pág.

 “Mixed Oligopoly and Market Power Mitigation: Evidence from
         the Colombian Wholesale Electricity Market”

Carlos Suarez
4

WEBSITE: www.ub.edu/irea/ • CONTACT: irea@ub.edu

The Research Institute of Applied Economics (IREA) in Barcelona was founded in 2005, as a research
institute in applied economics. Three consolidated research groups make up the institute: AQR, RISK
and GiM, and a large number of members are involved in the Institute. IREA focuses on four priority
lines of investigation: (i) the quantitative study of regional and urban economic activity and analysis of
regional and local economic policies, (ii) study of public economic activity in markets, particularly in the
fields of empirical evaluation of privatization, the regulation and competition in the markets of public
services using state of industrial economy, (iii) risk analysis in finance and insurance, and (iv) the
development of micro and macro econometrics applied for the analysis of economic activity, particularly
for quantitative evaluation of public policies.

IREA Working Papers often represent preliminary work and are circulated to encourage discussion.
Citation of such a paper should account for its provisional character. For that reason, IREA Working
Papers may not be reproduced or distributed without the written consent of the author. A revised version
may be available directly from the author.

Any opinions expressed here are those of the author(s) and not those of IREA. Research published in
this series may include views on policy, but the institute itself takes no institutional policy positions.
Abstract

          Using information on price bids in wholesale electricity pools and empirical
          techniques described in the literature on electricity markets, this study
          identifies the market power mitigation effect of public firms in the Colombian
          market. The results suggest that while private firms exercise less market
          power than is predicted by a profit-maximization model, there are marked
          differences between private and public firms in their exercise of unilateral
          market power. These findings support the hypothesis of the market power
          mitigation effect of public firms.

JEL classification: L13, L94, C10.

Keywords: Electricity Markets, Market Power, Privatization, Mixed Oligopoly, Regulatory
Intervention.

Carlos Suarez: Department of Econometrics, Statistics and Applied Economics, Research
Group on Governments and Markets, University of Barcelona, Avinguda Diagonal 690, 08034
Barcelona, Tower 6 Floor 3. Engineering Department, Research Group on Energy, Environment
and Development, Jorge Tadeo Lozano University. Email: casuarez1978@gmail.com
1 Introduction
A key concern in any discussion about privatization is the benefits that might accrue to
society from public firms. Their advocates claim that they can be used as economic policy
instruments. In mixed oligopoly markets (i.e., markets in which private and public firms
compete), some economists and policy-makers argue that public enterprises are able to
mitigate market power through more competitive pricing, or what I shall refer to here
as “regulatory intervention”.1
The mixed oligopoly literature has analyzed the strategic interaction between public
and private firms in non-perfect competitive markets in order to establish, in theory, the
welfare e↵ects of privatization. Several studies employing such models have concluded
that full privatization is inadvisable because it can have counter-competitive e↵ects on
the market and lead to subsequent increases in terms of deadweight loss (De Fraja and
Delbono, 1989; Matsumura, 1998). These conclusions arise from the assumption that
the objective function of public and mixed firms di↵ers from that of private firms. In
most cases, mixed oligopoly models assume that private firms aim to maximize profits
while the objective function of public (or mixed) firms is to promote social welfare.2
Public firms may have objectives other than profit maximization and may even have a
multiplicity of objectives (Kay and Thompson, 1986).3 In the field, the objective function
of this type of firm depends on several issues related to the government’s ultimate goal
and the incentives provided to their managers (Fershtman and Judd, 1987) and it is thus
not possible to know a priori what the objective function of a public firm is.4
1
In this paper, public firms are defined as those in which national or local governments have a
majority shareholding and control their management.
2
Traditional approaches to public firms have mainly viewed them as instruments of government
policy and planning (Bös, 2015). Following this approach, the mixed oligopoly model assumes that the
objective functions of public firms is to promote social welfare.
3
According to Kay and Thompson (1986), “Public sector managers could be expected to respond to
the particular personal incentives with which they were faced. Such incentives might lead to a desire to
maximise the scale of operations of the business, subject to any external financial constraint, or to seek
a quiet life untroubled by changes in working practices or difficulties in labour relations, rather than to
pursue a nebulous public good.”
4
For instance, if there is political pressure from voters to decrease prices, public firms may try
to mitigate market power, even applying predatory prices. Conversely, if a government is seeking to
redress a fiscal deficit, its state-owned firms may try to maximize profits using market power markups
1Given this ambiguity, and its obvious importance in determining the e↵ect of private
and state ownership on competition, the behavioral di↵erence between public and private
firms is a matter that merits empirical analysis.
The possibility of conducting such analyses in regulated industries has been greatly
enhanced over the last three decades thanks to the improved availability of data and a
diversity of market reforms. As a result of these two developments, it is now possible to
empirically address the key question underpinning the mixed oligopoly model, namely:
Do public and private firms behave the same when faced with equivalent incentives? An
empirical analysis of di↵erences in the way in which private and public firms exercise
their market power should provide interesting insights.
In this paper, I address the strategic pricing of public and private firms from an empir-
ical perspective in order to determine how they exercise their market power. Specifically,
I extend the analysis of the incentive to exercise market power (IEMP), as proposed by
McRae and Wolak (2009), to the case of two di↵erent types of firm showing disparate be-
havior in response to the same strategic incentives. This technique draws on information
about individual bids (willingness to sell) available in the electricity markets organized as
a multi-product auction. I apply this extended methodology to the Colombian wholesale
electricity market.
The case of the Colombian electricity market is appealing because market power
and marked rises in wholesale electricity prices are a major concern for the Colombian
authorities, consumers, and stakeholders alike. Leading industrial consumers tend to
be well organized and lobby the government for energy cost reductions. At the same
time, the Ministry of Energy and Mines sits on the board of several of the leading public
electricity generation companies. As a result, there are potential incentives for public
and mixed firms under government control to exert market power mitigation.5
as a covert form of taxation. Likewise, governments committed to a privatization program will boost a
public firm’s profit performance in order to increase the sale price. In addition, in the particular case of
mixed firms with a government majority share, the board members have a fiduciary duty to the minority
shareholders and therefore cannot ignore profit-maximization incentives. I owe this observations to an
anonymous referee.
5
It is important to clarify that, in relation to the objective function of public companies in the
Colombian wholesale electricity market, in this document I try to establish how close their price responses
2Besides its relationship to mixed oligopoly models, this paper also lies at the inter-
section of two other di↵erent strands in the literature: i) Empirical studies comparing
the efficiency of public and private firms, and ii) studies estimating market power in
electricity markets.
To date, empirical studies of the efficiency of public and private firms have focused pri-
marily on di↵erences in the performance (or productive efficiency) of public and private
monopolies (Bel et al., 2010; Frydman et al., 1999; La Porta and Lopez-de Silanes, 1999;
Netter and Megginson, 2001). One relevant exception is the study by Seim and Waldfo-
gel (2013) which was specifically aimed at determining the goals implicit in the decisions
of public enterprises. Seim and Waldfogel (2013) estimated a spatial model of demand
based on information about Pennsylvania’s state liquor retailing monopoly and found
that the store network is very similar in size and configuration to the welfare-maximizing
configuration. My research is similarly focused on disentangling the di↵erences between
the goals of public and private firms, but it di↵ers from their study in that I analyze a
situation in which private and public companies compete in the same electricity market,
whereas Seim and Waldfogel (2013) investigated the goals of a public monopoly. To the
best of my knowledge, the only paper to focus on the di↵erences between public and
private firms competing in the same market is that by Barros and Modesto (1999), on
the Portuguese banking sector.
The economic literature examining the problem of market power in electricity gen-
eration markets is extensive. However, three main groups of empirical models can be
identified according to the methodological approach employed. The first of these is based
on the direct or indirect estimate of Lerner indexes or markups (Wolak, 2003; Wolfram,
1999). The second group of studies seeks to determine the agents’ market power, simulat-
ing the equilibrium conditions that emerge from economic models of oligopoly (Bushnell
et al., 2008; Green and Newbery, 1992; Hortacsu and Puller, 2008; Sweeting, 2007; Wolak,
are to the theoretical behavioral benchmarks proposed by the mixed oligopoly models. Rather than
evaluating whether public companies deploy a welfare-maximizing strategy, I evaluate whether or not
public companies ignore their incentives to exercise market power. Although ignoring such incentives
is consistent with welfare maximization, there are other plausible theoretical benchmarks that could
explain this behavior.
32000). The third approach involves the use of structural econometric models to estimate
functional or behavioral parameters (Reguant, 2014; Wolak, 2007; Wolfram, 1998).
Although several techniques have been proposed for estimating market power in elec-
tricity markets, few studies have attempted to distinguish di↵erences in competitive
behavior between heterogeneous types of firm. In this respect, my approach is related
to the studies by Hortacsu and Puller (2008) and Hortaçsu et al. (2019), who examined
the bidding behavior of firms in the Texas electricity spot market and found di↵erences
in the competitive strategies of large and small firms. Concerning the methodological
approach, as mentioned above, my empirical implementation is similar to the estimation
model proposed by McRae and Wolak (2009).
The main contribution of this paper is the development of an empirical model to
analyze di↵erences between private and public firms in terms of their incentives to ex-
ercise market power in a multi-unit auction framework. This methodology provides a
new analytical tool that serves to clarify the e↵ect of mixed (private-state) ownership
on competition. Overall, this methodology is applicable to any multi-unit, uniform price
auction in which the competitors’ bids and marginal costs are observable.
The empirical analysis performed here suggests that there are marked di↵erences in
the way private and public firms exercise their unilateral market power, supporting the
hypothesis of the latter’s market power mitigation. The results indicate that public firms
do not price strategically in the spot market. Moreover, partial evidence was found to
suggest profit-maximization behavior on the part of private firms and of bidding under
the marginal cost pricing rule on the part of public firms. These findings are consistent
with the behavioral structure of mixed oligopoly models.
The rest of this paper is divided into five sections. Section two outlines the char-
acteristics of the Colombian wholesale electricity market and the structural problems
it presents that must be taken into account to accurately identify the behavioral pa-
rameters under study. Section three explains the theory underpinning the incentives for
profit-maximizing firms to exercise unilateral market power and stresses the di↵erences
in this regard with the behavior of firms that do not act strategically. This section also
4describes the empirical approach adopted to identify the behavioral di↵erences between
private and public firms. Section four presents the data and the results of applying
the proposed empirical approach to this market and reports several robustness checks
on multiple econometric choices. The final section summarizes the results and presents
some conclusions.
2 The Colombian market and mixed competition
This section outlines the principal features of the Colombian electricity generation market
that distinguish it as a mixed oligopoly and describes the main elements of this market
that must be taken into account when examining problems of market power.
For a market to be considered a mixed oligopoly, it must satisfy three conditions: i)
the market must be liberalized, i.e. the price is determined by the competing bids made
by the producers; ii) public, private and mixed firms must compete in equal conditions,
i.e. there are no discrimination rules; and iii) the conditions of competition in the market
are not perfect, i.e. there are high levels of concentration.
As regards the first condition, since the introduction of the Public Utilities Act (Act
142 of 1994) and the Electricity Act (Act 143 of 1994), electricity generation in Colombia
has been organized as a pooled wholesale electricity market. Generators can sell their
energy by means of long-term bilateral contracts with other agents or directly in the
day-ahead power exchange. This exchange operates as a multi-unit, uniform first-price
auction, in which each generator reports a price bid (or willingness to sell) to the market
operator for each generation unit. With this information, and according to demand fore-
casts, the market operator organizes the generation units from the cheapest to the most
expensive (this arrangement is known as merit order) and defines the market clearing
price (spot price) for every hour of the day. This feature demonstrates that the Colom-
bian wholesale energy market is neither price-regulated nor a cost-based pool and that
it obeys the conditions of competition among producers.
Second, with respect to the coexistence of private and public companies in the Colom-
5bian generation market, it should be noted that although the intention of the Colombian
electricity sector reform in the early nineties was to promote private entrepreneurship,
the activity has a high proportion of public or mixed firms under government control. It
is also important to clarify that classification of generation firms into “private” and “pub-
lic” categories in the Colombian electricity market is not direct because there are several
firms with both private and public participation. In addition, smaller publicly-owned
firms had power purchase agreements (PPAs) to buy electricity from privately-owned
generation plants. For the particular application reported here, this classification was
performed by unit, taking into account the category of shareholder controlling the firm
that represents the unit to the market operator.6
Table 1 shows market shares in the Colombian wholesale electricity market for 2014.
The second column reveals that four of the seven leading firms were state controlled in
that year according to the classification criterion adopted in this study. In consonance
with this information, the leading generation firms operating in Colombia during the
study period presented a heterogeneous ownership structure in terms of the private or
public nature of their major shareholders.
Table 1: Market shares in the Colombian electricity market - 2014
Firm Majority Shareholding Electricity Generation (gWh) % Cumulative %
EMGESA Private 13691 21% 21%
EPM Public 13626 21% 42%
ISAGEN Public 10609 16% 59%
GECELCA Public 7508 12% 71%
COLINV. Private 6711 10% 81%
AES Private 3982 6% 87%
GENSA Public 2436 4% 91%
Others 5764 9% 100%
Total 64328 100% 100%
HH 1422
Source: XM - Market Operator
6
It is important to consider that the entity responsible for the bidding process of a generation unit in
the Colombian wholesale electricity market is the firm that represents the unit to the market operator.
Table D22 in appendix D presents the ownership features of the most important firms in the Colombian
electricity generation market and table D23 in appendix D lists the generator units used in the analysis
and details the corresponding ownership group and classification into public or private.
6Finally, as regards the third condition, i.e., the level of market competition and
concentration, electricity generation activity in Colombia shows levels of concentration
that correspond to a moderate oligopoly, according to the merger guidelines of the US
Department of Justice. Table 1 presents the participation of the six leading generation
companies in the Colombian generation market.
In addition to the above features, there are several other features of the Colombian
wholesale electricity market that must be considered in order to accurately characterize
the unilateral market power of electricity generators.
i Colombia’s generation supply is mainly produced by hydroelectric and thermoelectric
resources. In the case of the country’s hydro technology, it should be borne in mind
that Colombia’s rain regime is subject to the e↵ects of El Niño and La Niña events.
During the former, dry weather conditions have a negative impact on the contribu-
tion of hydroelectric resources, while the opposite occurs during La Niña events. In
addition, the annual rain regime fluctuates between a dry season (December, Jan-
uary, and February) and a wet one (April, May, and June). Daily information is
available on the river flows that feed the main hydro units. As for the country’s
thermal technology units, these are primarily gas and coal fired. The gas market in
Colombia is organized as a bilateral contract scheme, and the price of Colombia’s
main gas well was regulated during the study period. Likewise, the fees for using
the gas transport pipes are regulated according to a mixed scheme which takes into
consideration capacities and volumes alike. Information is available about the heat
rates of each thermoelectric plant. Table 2 highlights the importance of large hydro
plants and thermoelectric units.
ii Most energy transactions are performed through long-term, fixed-price forward con-
tracts. Since physical dispatch is centrally coordinated, bilateral forward contracts
work as financial hedges against spot prices (Garcia and Arbelaez, 2002). Generally,
information on transactions made through bilateral forward contracts is not available
in markets that are organized as a multi-product auction. An additional advantage
7Table 2: Generation by type of resource - 2013 and 2014
Generation (gWh)
Type December 2013 December 2014 Growth Share 2014
Hydro 3622 3707 2% 68 %
Thermal 1370 1474 8% 26 %
Small Units 300 305 2% 6%
Cogeneration 32 45 41% 1%
Total 5323 5531 4% 100%
Source: XM - Market Operator
of analyzing the case of the Colombian electricity market is that the information on
sales in long-term forward contracts is available after the market closes. Thus, the
net forward market position of the firms can be computed. Table 3 shows the total
energy traded in 2013 and 2014 in the electricity generation market, distinguish-
ing between transactions conducted through fixed-price forward contracts and direct
transactions in the day-ahead energy exchange.
Table 3: Energy sales by trade mechanism - 2013 and 2014
Generation (gWh)
2013 2014 Growth Share 2014
Spot Market 14949 15507 4% 18%
Forward Contracts 71374 69846 -2% 82%
Total 86323 85352 -1% 100%
Source: XM - Market Operator
iii Finally, the rules of the Colombian electricity exchange market allow only one valid
bid price to be made per unit for each 24-hour period. For each unit participating
in the central dispatch, the bid consists of one bid price that remains valid for the
entire day and 24 quantities (commercial availability), one for each hour of the day.
The generators report these day-ahead bids in the market clearing period. Regard-
less of the fact that the market clears every hour (in order to account for di↵erences
in demand and in availability of non-centrally dispatched generation resources), the
generator can only bid one price and cannot change any part of its bid during the cor-
responding 24-hour period. This restriction has considerable implications as regards
incentives to exercise market power, as will be explained in detail in sub-section 3.1.
83 Theoretical background and identification
3.1 The incentives to exercise market power
This sub-section examines the theoretical background to an analysis of the IEMP of
profit-maximizing and non-strategic firms and the implications of certain features of
the Colombian wholesale electricity market regarding the identification approach. The
electricity market literature contains various empirical techniques for estimating market
power (Borenstein et al., 2002; Bushnell et al., 2008; Green and Newbery, 1992; Hortacsu
and Puller, 2008; Reguant, 2014; Wolak, 2003; Wolfram, 1998, 1999). A common element
in the most relevant papers conducting analyses of this type is that the estimation
strategy is based on the first order condition of the profit maximization problem. In
general, these order conditions make it possible to express the optimal price or bid as the
sum of a cost component plus a strategic component. Here, I adopt the model proposed
by Wolak (2000) and McRae and Wolak (2009). who have developed a methodology
for estimating the IEMP based on a simple model of profit-maximizing firms that have
ex-ante forward contract obligations in a residual demand setting. In this context, the
IEMP is the ability to change the spot price when withdrawing output with the aim
of maximizing profits. In a theoretical study, Allaz and Vila (1993) showed that when
profit-maximizing firms sell a large share of their output via forward contracts with fixed
prices, they have less incentive to increase prices on the spot markets.
According to McRae and Wolak (2009) model, assuming the generator has previously
c c
sold an amount of energy qih at a fixed price Pih by forward contracts, the profit function
of the generation firm i in the hour h can be defined by the following expression:
c c c
⇡ih = Ph (DRih )(DRih qih ) + Pih qih Ci (DRih )
where ⇡ih represents the profits of firm i in hour h in the electricity market, Ph is
the spot price, DRih is the residual demand of firm i in hour h, and Ci (DRih ) is the
cost function of the firm i. From the first order condition, the following expression is
9obtained:
@Ci (DRih ) @Ph (DRih ) c
Ph (DRih ) = (DRih qih ) (1)
@DRih @DRih
| {z }
strategic element
It should be borne in mind that at the point of market equilibrium, the residual
demand of firm i in hour h, DRih , is equal to the total quantity produced by that firm
@Ci (DRih )
in that hour, therefore @DRih
is the marginal cost of firm i in hour h. This is the first
term of the right-hand side of equation 1; the second is the strategic element, i.e., its
IEMP, which is equal to the interaction of the inverse of the slope of the residual demand
curve and the firm’s net position in the forward contracts market. This interaction is
the optimal margin of a profit-maximizing firm. Thus, the more energy sold by the firm
through fixed-price forward contracts, the less the incentive to increase the spot price.
Note, however, that in cases in which the generator has an energy deficit relative to its
contractual commitments, it has the IEMP by reducing, as opposed to incrementing, the
spot price (McRae and Wolak, 2009).
Given the design of the Colombian wholesale electricity market, the daily bid con-
straint limits the generator’s ability to make the precise bid that will maximize its profit
function each hour. The generation firm must choose a single price in order to maxi-
mize its expected daily profits. This means it cannot bid a continuous supply function
that intersects the maximum profit points, given the di↵erent realizations of the residual
demand. Thus, hourly IEMPs are not necessarily the same as daily incentives.
To address this problem, I propose a daily measurement of the IEMP. This measure
can be used to express the first order condition of the daily profit maximization problem
as follows:7
P c
h2Hijt (DRith (sijt ) qith )
s⇤ijt = cijt + P @DRith (sijt )
(2)
h2Hijt @sijt
where sijt is the daily bid price on day t for the energy of unit j, the asterisk highlights
7
See appendix A for a derivation.
10that this bid is optimal, cijt is the constant marginal cost of unit j, Hijt is defined as the
set of hours of day t where unit j is marginal, DRith is the residual demand of firm i
c
that owns unit j on day t at hour h and qih is the energy previously sold at a fixed price
by firm i on day t. The second term on the right-hand side of equation 2 is a weighted
version of the inverse semi-elasticity of the residual demand. This is the IEMP of a firm
that maximizes daily expected profits. I compute the daily IEMP of the firms for the
daily model according to this expression.
From a behavioral perspective, strategic firms will take the IEMP into account in
their pricing, whereas non-strategic firms will not. However, what type of behavior can
be expected from public firms seeking to mitigate market power? Here, the theoretical
literature on mixed oligopolies o↵ers an appealing response. Beato and Mas-Colell (1984)
have demonstrated that public firms are able to restore market efficiency by applying
the marginal cost pricing rule in a mixed oligopoly model in which public firms compete
with private firms, where the former are welfare maximizing and the latter are profit
maximizing. Hence, if public firms are implementing market power mitigation schemes,
we would expect them to apply the marginal cost pricing rule, or we would at least
expect the impact of the strategic element in prices to be less important for public than
for private firms.
What, therefore, are our expectations regarding public firms in the specific case of
Colombia? As stated in the introduction, there are potential incentives in Colombia
for public and mixed firms under government control to exert market power mitigation,
given the government’s direct participation on the board of several of these companies
and the capacity of interest groups to lobby for a reduction in electricity prices.
In sum, when private firms behave strategically, the interaction between the residual
demand slope and the net financial position has an impact on price bids. In contrast,
public firms have no IEMP, i.e., their prices are una↵ected by this interaction and are
primarily explained by the marginal cost.
113.2 Identification strategy and estimation
In this section, the di↵erences in the incentives for private and public firms to exercise
market power are addressed from an empirical perspective. The model presented here
adopts the estimation methodology proposed by McRae and Wolak (2009), but includes
the interaction between the firms’ type of ownership and their IEMP. The extension of
this model to establish these di↵erences in incentives is based on expression 2 for private
companies.
It is important to consider that my intention is to determine whether public and
private companies respond in the same way to incentives to exercise market power, and
therefore I require a strategy to test whether the supply functions of the di↵erent types
of company respond in di↵erent ways to changes in the inverse semi-elasticity of residual
demand. Note that the expression 2 can be interpreted as a behavioral supply function
of a profit-maximizing firm, while the marginal cost pricing rule can be interpreted as a
behavioral supply function of a firm that ignores its incentives to exercise market power.
Therefore, I assume that the behavioral supply of private and public companies is
given by the expression:
\
p⇤ijtk = ✓cijt + ↵k ⇤ IEM Pijtk + ⌘ijtk (3)
Where ✓ is the passtthrough of marginal costs, cijt represents the marginal costs, ↵k
is the response to incentives to exercise market power of company i that owns unit j at
\
time t and which is of the nature k, k 2 {public, private}, IEM Pijtk is the estimate of
the incentives to exercise market power and finally ⌘ijtk is a measurement error in the
estimates of the incentives to exercise market power of firm i 8 .
Note that the equation 2 is an equilibrium condition, therefore it is only valid for the
firm’s marginal bid. This implies that although all price bids can be observed in each
auction, those that are out of equilibrium do not necessarily fulfill the expression 2. Given
8
Reguant (2014) notes the potential endogeneity and measurement error of the elastic strategic
component( markup term) in the empirical analog of the first-order condition of a profit-maximizing
firm.
12the restrictions on the bidding program in the Colombian market described in section 2,
it is expected that the points of the bidding program outside a firm’s equilibrium will
show deviations from the optimality condition described by the expression 2. Each firms’
equilibrium quantities and bids arise from the interaction between the behavioral supply
function and the residual demand function; therefore, estimation of the parameter ↵k
implies a ”reverse causality” problem9 .
In order to address this issue, it is necessary to adopt a simultaneous equations
approach and instrumentalize the IEMP. According to the interpretation of McRae and
Wolak (2009) the IEMP is equivalent to the inverse semi-elasticity of net residual demand
(After considering the previous forward contract obligations).
As regards the stochastic components of the residual demand, these can be generated
by demand shocks or by shifts in the competitors’ supply function. Consequently, I
will model the incentive to exercise market power (IEMP) as the sum of these two
components.
\
IEM Pijtk = ⌫th + ith (4)
It is reasonable to assume that the shocks of demand ⌫th come from expected and
unexpected consumer reactions which lie completely beyond the firms’ control. These
reactions may be a response to price changes (endogenous components) or to demand
driver changes (exogenous component)10 . I will model the demand shocks as the sum of
expected changes to demand drivers,11 an elastic component which is clearly endogenous
and unexpected shocks which could be exogenous or endogenous.
9
Note that the IEMP results from the expectations that various firms have about their rivals’ be-
havior. According to the bid rules of the wholesale energy market, the competitors’ bids must be made
simultaneously. Thus, for generator A to estimate its residual demand curve, it has to form an expecta-
tion about its rivals’ bid prices; however, at the same time, the bid prices of these rival firms will depend
on their estimates of the residual demand curves, which in turn will be dependent on their expectations
regarding generator A’s bid prices.
10
The fact that consumers’ reactions to demand driver changes are beyond the firms’ control suggests
independence of these variables, rendering them candidates for suitable instruments.
11
The demand drivers are external shocks that shift but do not rotate the inverse function of residual
demand
13⌫th = ⇡1 zth + ⇠th (pth ) + th (5)
Where ⇡1 z1 represents the expected changes in demand drivers ⇠th (pt ) represents
endogenous reaction to prices (elastic component) and th is the sum of unexpected
demand shocks.
With regard to shocks in the competitors’ supply function, ith . These shifts may
be caused by foreseen changes in the costs of rival firms or by unforeseen impacts on
their strategic incentives (elastic component). Clearly, because this second component
depends on the strategic interaction of competing firms, poses a problem of endogeneity.
I will model the shocks in the competitors’ supply function as the sum of changes in rival
firms’ cost shifters ⇡ 2 z 2 ith and the endogenous (and elastic) component ! ith (pt ).
ith = ⇡2 z 2 ith +! ith (pth ) (6)
Hence, plugging expressions (5) and (6) in expression (4), the IEMP can be expressed
as:
\
IEM Pijtk = ⇡1 z1th + ⇡2 z2 ith + ⇠th (pt ) + ! ith (pt ) + th (7)
I address the endogeneity problem here by performing estimates that consider instru-
ments for the IEMP whose variation arises either from expected demand shocks z1th or
exclusively from the competitors’ cost component z2 ith (both of which are uncorrelalated
to the measurement error of the IEMP).
The literature on market power estimation in an environment of di↵erentiated prod-
ucts recommends using the observed characteristics of the products supplied by rival
firms in order to obtain the optimal instruments for a specific product (Berry et al.,
1995). By analogy, in the context of the electricity market, the instruments I have se-
lected are variables that are uncorrelated to the rivals’ elastic component but which at
the same time have e↵ects on their supply function, that is, factors associated with shifts
1412
in the costs of rival firms .
Specifically, I consider three instruments:
i A weekend day dummy variable is used in order to capture expected demand shocks;
this instrument is valid because it reasonable to assume that the weekday condition is
independent of the measurement error. Likewise, the only channel through which the
day of the week can a↵ect the supply of firm i is through a shift in the residual demand
curve. The cost shifters of electricity generation depend mainly on the technological
characteristics of the units and the cost of fuels. Generally, generating companies sign
long-term contracts for the supply of fuel, which do not include substantial changes
in the price of the same depending on the day of the week. The above suggests that
this instrument satisfies the exclusion restriction.
ii The inflows of the rivers feeding the rivals’ main hydraulic generation units are used
to account for changes in the marginal costs of the leading competitors. The indepen-
dent nature of this variable is evident given its dependency on natural phenomena.
Regarding the exclusion restriction, it is not expected that the inflows of the rivers
feeding the reservoirs of competitors have an impact on the opportunity cost of fuel
usage of the units of the firms owned by the firm i. Hence, shifts in residual demand
constitute the only pathway through which competitors’ river inflows can impact the
behavioral supply function.
iii The competitors’ full commercial availability, i.e., their total generation capacity on
specific days. It is important to clarify that in the Colombian wholesale electricity
market, commercial availability is the quantity component of the daily bid. Firms
can report only one commercial availability per unit for each hour. This availability
is taken into account by the regulator in order to calculate the historical unavailabil-
ity index due to forced fails. This indicator considers the observed unavailability of
each generation asset, and higher levels trigger a reduction in revenue from the gen-
12
As instruments I use several rivals’ cost shifters which are equivalent to drivers of the residual
demand of firm i
15eration back-up scheme under Colombian law (reliability charge). Thus, generation
companies do not have incentives to systematically make strategic use of commercial
availability. The greatest changes in this last variable are motivated by the scheduled
or unscheduled unavailability of the plants and by the highly variable contribution of
smaller base-load generation units. The short-term decisions of firm i do not have an
e↵ect on its competitors’ sources of variation and therefore, this variable can be con-
sidered independent. Likewise, the short-term contingencies or planned maintenance
intervention of rivals’ generation assets a↵ect neither the generation technology nor
the opportunity cost of fuel usage by the units owned by firm i. Hence, it is rea-
sonable to assume that the rivals’ commercial availability only a↵ects the behavioral
supply function through shifts in the residual demand.
Finally, in order to perform an estimation of the econometric model posed in ex-
pression (8), it is necessary to model the marginal cost component cijt . Marginal cost
estimates of the units can be obtained from engineering formulae and the technical char-
acteristics and prices of the observable inputs. However, there may be unit characteristics
and random shocks common to all plants that are not observable to the econometrician
and which have an e↵ect on marginal costs. In addition, it is important to bear in mind
that the computations performed to obtain the marginal cost estimate may contain a
measurement error given that fuel costs are approximated to reference prices, and the
cost per unit in actual fuel supply contracts may be di↵erent. Therefore, in this pa-
per it is assumed that the marginal costs of each unit can be expressed as the sum of
the marginal cost estimate based on the technical parameters of the unit, an individual
heterogeneity component and time e↵ect common to all the units, and an exogenous
disturbance term, i.e. cjt = b
cjt + µj + 't + ⇣jt .
Thus, I estimate the following two-way fixed e↵ects linear regression model:
p⇤ijt = 0 + ✓(b \
cijt ) + ↵pri (Djpri ⇤ IEM \
Pijt ) + ↵pub (Djpub ⇤ IEM Pijt ) + µj + 't + "it (8)
16⇤
where Pijt is the bid of firm i, for its marginal unit j on day t, cc
ijt is the estimate of the
\
marginal cost of unit j on day t, IEM Pijt is the estimation of the incentive to exercise
market power for a profit- maximizing firm (the empirical estimate of the second term of
the left-hand side of expression [2], for company i on day t for the hours in which unit j
was marginal, and Djpub is a dummy variable that takes the value of 1 when unit j is owned
by a firm i under state control and 0 otherwise. Djpri is a dummy variable that takes the
value of 1 when unit j is owned by a private firm i and 0 otherwise. µj and 't represent
unobserved unit and time e↵ects, respectively. The term of disturbance "it contains the
unobservable exogenous disturbance term of the marginal cost and the sum of hourly
P
measurement errors of the IEMP, i.e., "it = ⇣jt + ⌘ijtk where ⌘ijtk = 24
h=1 ⌘ijthk . 0 , ✓,
↵pub , ↵pri are the parameters to be estimated. This model is similar to the application
developed by McRae and Wolak (2009); however, in the present paper, heterogeneous
e↵ects are introduced for public and private companies.
It should be borne in mind that Pijt is the price-bid of unit j when the latter is
marginal. The first order condition expressed in equation 2 is not valid when unit j is
not marginal. This means that the panel data only contain information about those
plants that were marginal for at least one hour in the day. Likewise, in the case of the
residual demand approach, the marginal price bid of firm i is equal to the spot price,
that is, pth = s⇤imt , if unit m is marginal in hour h. However, given the discontinuity and
ladder shape of the supply and residual demand functions, this does not always occur in
the real market. Therefore, there are two alternatives regarding the dependent variable
of the model presented in expression 8: Either the spot price when unit i clears the
market or the price bid of the marginal unit of each firm. Since a greater number of
observations can be used with the latter alternative (and unit j does not need to clear
the market), it can be considered the most appropriate option.
In the framework of the instrumental variables approximation, I implement several
specifications of the two-way fixed e↵ects proposed in expression 8. Note that for private
companies, the inclusion of these fixed e↵ects terms would allow them to bid prices
above or below the marginal cost independent of residual demand and their contractual
17position, that is, for reasons independent of their IEMP. As far as public companies are
concerned, the additional fixed e↵ects would allow level-shift deviation, which implies
violating the marginal cost pricing rule.13 As I mentioned above, I interpret these fixed
e↵ects as unobservable individual heterogeneity and unobservable time e↵ect common
to all the units of the marginal cost. I assume that the unobservable, time-variant
heterogeneity of the marginal cost is orthogonal to the measurement error of the IEMP,
⇥ 0 ⇤
i.e., E ⇣jt ⌘ijtk = 0.
I propose estimating the parameters ↵pub and ↵pri by implementing a linear general-
ized method of moments (GMM) model with standard errors clustered by unit. Assuming
a valid and relevant set of instruments Zijt , I am able to exploit the orthogonality con-
ditions of the instruments and the first order condition of the daily profit maximization
problem presented in expression 2 in order to construct the moments conditions. The
orthogonality conditions imply that:
⇥ 0 ⇤ h ⇥ ⇤ ⇤i
E Zijt 0
"it = E Zijt Pijt ✓(b
cijt ) \
↵pri (Djpri · IEM Pijt ) \
↵pub (Djpub · IEM Pijt ) µj 't =0
The parameters can now be estimated using the empirical analogue of these moments
conditions.
Finally, it is important to consider that estimation of the opportunity costs of using
hydro power resources involves dynamic components that do not necessarily correspond
to the first order conditions given in expression 2. For this reason, the baseline estima-
tions presented in this paper only uses data from situations in which the firms’ marginal
power plants use thermal technology.14 However, the importance of hydroelectric gen-
13
I owe this observation to an anonymous referee.
14
Here, it is necessary to clarify that I do not include hydro units, not only because the opportunity
cost of water is difficult to estimate, but also because for hydro units, the first-order condition for this
type of unit could be di↵erent from the one presented in expression (2). In the robustness check section,
I present the results of the estimates including hydro units under the assumption of the same first-order
condition for the di↵erent types of generation technology. The qualitative and quantitative results are
similar to the baseline estimate.
18eration in the Colombian electricity market is useful to refine the identification strategy
in order to address endogeneity issues.
The econometric exercises proposed here seek empirical evidence for the impact of
private and public companies’ IEMP in their bid prices according to the predictions of
the mixed oligopoly model. Three specific hypotheses are analyzed:
i Hypothesis 1 (H1): Given the same incentives, the exercise of market power by
state-owned and private firms di↵ers.
ii Hypothesis 2 (H2): Public firms (do not) exercise market power as non-strategic
agents, i.e. they apply the marginal cost pricing rule.
iii Hypothesis 3 (H3): Private firms exercise market power taking into account the
strategic element.
First, note that testing the null hypothesis, ↵pri = ↵pub in expression 8 is consonant
with the rationale that the exercise of market power by state-owned and private firms is
equal given their incentives. If private firms behave as profit maximizers and public en-
terprises implement market power mitigation schemes, then depending on the ownership
of each enterprise, the interaction of residual demand slope and net forward contract
position will impact di↵erently on their respective bidding strategies.
In the case of the second hypothesis, if public firms do not behave strategically, we
would expect the parameter ↵pub not to be statistically di↵erent from zero, i.e. null
hypothesis ↵pub = 0. If public firms exercise regulatory intervention, then their prices
will be explained mainly by the marginal cost and they will not be a↵ected by the
interaction of the residual demand and the net financial position.
Finally, according to theory, if private companies behave strategically (profit maxi-
mizers), we would expect the parameter ↵pri to be statistically significant and to present
a positive sign (being very close to 1 in the case of profit-maximizing firms), i.e. null
hypothesis ↵pri > 0 (↵pri = 1 in the case of profit maximization). If private firms behave
strategically, their IEMP has an impact on the firms’ pricing. These tests are performed
for each of the parameters estimated in the econometric models described above.
19It is important to clarify that the interpretation of the coefficient ↵ is di↵erent from
the conduct parameter ✓ estimated in several applications of the new empirical industrial
organization (NEIO) literature. First, the conduct parameter ✓ is an estimate of the
price-cost mark up adjusted by the elasticity of total demand. As this is corrected for
total demand, its interpretation is linked to the entire market competition model and not
to individual firm behavior. In the case of the parameter ↵, this can also be interpreted
as a measure of the price-cost mark up but adjusted by the elasticity of residual demand
and the percentage of exposure to the spot price of each firm. This measure is relative
to the best response of each particular firm.15
Interpretation of ↵ when it takes the values 0 or 1 is clear: When ↵ is 1, the firm is
maximizing its profit unilaterally in the static game, and when ↵ is 0, the firm is ignor-
ing its incentives to exercise market power (and potentially applying the marginal cost
pricing rule). However, when ↵ takes di↵erent values, interpretation is less clear as it is
not associated with stylized competitive behavior (profit maximization or competition).
Deviations from stylized behavior values may be interpreted in the same way as in
Hortacsu and Puller (2008) and Hortaçsu et al. (2019), i.e., as deviations of optimization
behavior unrelated to strategic reasons. Alternatively, values of ↵ between 0 and 1 can
be interpreted as evidence that the firm is o↵ering prices as if it were facing a more elastic
residual demand than is the case, for strategic reasons. Mercadal (2019) posits that when
15
The conduct parameter ✓ represents firms’ beliefs regarding how competitors will react to changes in
the firm’s quantity. Meanwhile, the parameter ↵ can be interpreted as a measure of the extent to which
a company adopts its best response strategy unilaterally given its own forward contracting and the bids
of its competitors. The parameter ↵ does not necessarily inform us about the underlying competition
model in the market (this parameter tells us nothing about the competitors’ best response); rather,
it indicates whether each firm’s unilateral response is consistent with unilateral profit maximization
in the static model. It is important to clarify that I go beyond calculating the inverse elasticity of
total demand using econometric methods. In this paper, the IEMP is in principle observed, and is
estimated using a non-parametric method which considers the actual residual demand and includes the
reaction of competitors to potential changes in the price bids of firm i. According to Corts (1999), if
each firm i anticipates that its rivals’ aggregate output is a function Ri (qi ) and if Ri0 (qi ) = ri , firm i ’s
first-order condition is P = c0i (qi ) (1 + ri )P 0 (Q)qi , which is equivalent to (1) when ✓i = 1 + ri . In
terms of the notation used by Corts (1999), my regressor of interest, i.e., the IEMP, already includes the
direction of Ri0 (qi ). Given that I can observe the inverse semi-elasticity of demand, it is not necessary to
conjecture about the competitive behavior of the competitors of firm i, because in the regression model,
the parameter ↵ is not the coefficient of P 0 (Q)qi , as in the case of the conduct parameter, but the
coefficient of (1 ri )P 0 (Q)qi .
20attempting to determine entry, generators do not play best response (in the static game),
but act as if they were facing a more elastic residual demand (This is ↵ < 0).16 On the
other hand, values of the parameter ↵ greater than 1 can be interpreted as evidence
that the firm is o↵ering prices as if it were facing a less elastic residual demand than it
actually does, for strategic reasons. Mercadal (2019) suggests that, in a repeated game
cooperative equilibrium, firms do not play best response, but instead behave as if they
were facing a less elastic residual demand than than they actually do (This is ↵ > 1).17
The section that follows describes the methodological procedure for computing the
model’s variables, including the IEMP and marginal costs. Finally, the econometric
method employed in the estimation is outlined and the most relevant results are pre-
sented.
4 Empirical Implementation
The hourly and daily data for 21 firms in the Colombian wholesale electricity market
were analyzed for the period 2005 to 2014. To test the three hypotheses (H1, H2, and
H3) by estimating the parameters ↵pub and ↵pri of the model proposed in expression 8,
we also need data on marginal costs and on the IEMP. Unfortunately, these variables
cannot be observed directly, so we have to rely on indirect estimations.
In the case of marginal costs, an accounting approach is adopted. This is similar to
16
There may be several reasons for a firm to o↵er prices “as if it faced” a more elastic residual demand.
For example, the firm may fear regulatory intervention to reduce unilateral market exercise, so it does
not exercise its full market power when the resulting price increases could arouse excessive concern in
the authorities. Likewise, in the case of a public company seeking to balance consumer welfare and
profits, 1 ↵ could be interpreted as the importance that the firm gives to consumer welfare.
17
Note that interpretations associated with entry deterrence, fear of regulatory intervention, and
cooperative equilibrium implicitly entail scenarios of dynamic strategic interaction, namely, a profit-
maximization model subject to an incentive compatibility constraint associated with future revenues.
If the incentive compatibility constraints are a function of simultaneous residual demand shocks, then
the estimated ↵ parameter may be subject to Corts (1999) criticism (i.e., ↵ may be biased). In any
event, according to the identification strategy suggested by Puller (2009), the inclusion of time fixed
e↵ects in my base line estimation allows me to address this potential inconsistent estimation issue.
According to Puller (2009), theoretically, the unobserved e↵ect related to the incentive compatibility
constraint “is equal across all firms in the collusive regime for a given period (i.e., it is not indexed by
i). Although, a researcher does not have data on it, this extra term can be ‘conditioned out’ by including
time fixed-e↵ects”.
21Figure 1: Estimated marginal costs
(a) Private units (b) Public units
Source: Data from XM - Calculations and elaboration: Author.
the one employed in previous studies in the field of electricity markets (Borenstein and
Bushnell, 1999; Borenstein et al., 2002; Fabra and Reguant, 2014; Green and Newbery,
1992; Wolak, 2000; Wolfram, 1998, 1999). The marginal costs of thermal plants are
computed, based on the technical parameters of the plants (heat rate), fuel costs, and
fuel transportation costs. The data sources and more detailed information concerning the
assumptions for the calculation and imputation of these costs are presented in appendix
B. It is important to bear in mind that these computations may contain a measurement
error given that I approximate fuel costs to reference prices, and the cost per unit in
actual fuel supply contracts may be di↵erent.
Daily marginal costs were calculated and imputed for 36 thermal plants belonging to
21 firms. Given the small di↵erences in heat rate between publicly owned and private
units, no significant di↵erences were found in the distribution of marginal costs between
public and private generation units. Panels (a) and (b) in figure 1 present the histograms
of the estimated marginal costs for private and public generation units, respectively.
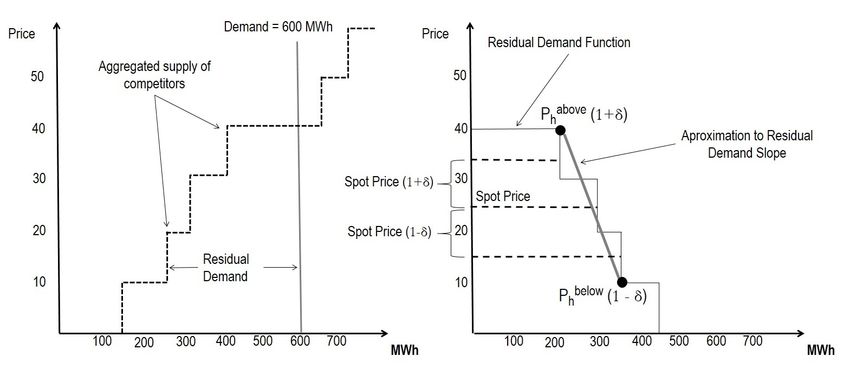
As for the IEMP, recall that this incentive is related to the elasticity of residual
demand. Since the Colombian wholesale electricity market allows us to observe the price
bids and commercial availability of each plant as well as actual electricity demand, it is
possible to replicate the residual demand of each generator. The result of this exercise
is a decreasing step function of residual demand in which the partial derivative is zero
22or indeterminate (McRae and Wolak, 2009). Therefore, to calculate the inverse net
semi-elasticity of demand, an approximation must be made to the slope of this function
around the market equilibrium price. Wolak (2003) suggests a non-parametric method
for calculating the elasticity of residual demand using the points of the function with
prices closest to — both above and below — the market equilibrium price.
As stated above, a daily version of the IEMP was computed to account for the fact
that in the Colombian electricity market, generators maximize daily as opposed to hourly
profits (see sub-section 3.1). Adopting the methodology proposed by Wolak (2003), the
empirical version of the IEMP — i.e., the second term on the right-hand side of equation
2 — can be computed as follows:
P c
\ (IGith qith |unit j is marginal in hour h)
IEM Pijt = P (9)
th ·(1+ )) DRith (pth ·(1
( DRithp(pabove (1+ ) pbelow (1 )
))
|unit j is marginal in hour h)
th th
\
where IEM Pijt is the incentive to exercise market power on day t for unit j that is
marginal for several hours of the day, pabove
th (1 + ) is the price of the next step in the
residual demand curve above the price pth ·(1+ ), pbelow
th (1+ ) is the price of the previous
step in the residual demand curve below the price pth · (1 ), IGith is the actual ideal
c
generation of producer i in hour h and qith is the quantity of energy committed in fixed
price forward contracts.18 As stated in section 2, in the Colombian wholesale electricity
market this quantity is observable ex post. Finally, I assume a parameter = 0.05 (5%).
Figure 2 illustrates this non-parametric calculation technique. Previous studies using
this methodology (McRae and Wolak, 2009; Wolak, 2000) suggest that changes in do
not have a marked e↵ect on the outcomes. Later in this paper, in the robustness checks
section, I verify that the decision regarding the parameter does not have a critical
impact on the results of the estimates. I present the estimates obtained by applying
18
From a supply function equilibrium approach (Klemperer and Meyer, 1989), the marginal price bid
is the best response of an electricity generating firm given the actions taken by its competitors (as it
sets its level of generation and the spot price). This optimal bid price is associated with an optimal
generation quantity, so the residual demand of the generator in the equilibrium price should be equal
to its ideal generation.
23\
of 10% and 25% to compute IEM Pijt .
Figure 2: IEMP Calculation technique
Source: Data from XM - Calculations and elaboration: Author.
Information about daily price bids, hourly spot prices, hourly ideal generation and
hourly sales in forward contracts — essential details to compute the IEMP — was taken
from the website of the Colombian wholesale electricity market operator XM.
A shortcoming of the IEMP calculation technique presented above is that it can yield
extreme values due to absolute values close to zero in the denominator of expression 9.
In fact, in the sample analyzed in this paper, extreme values are obtained which can
reach 2.228 times the interquartile range. Panel (a) in figure 3 presents a scatter plot
⇤
for the IEMP and the margin (Pijt cjt ) for the total sample in which extreme outliers
are present. In order to address this issue, the sample has been trimmed to exclude the
observations corresponding to the 1% lowest values for the denominator of expression
9, i.e., the sum of the slopes of the hourly residual demand functions. Panel b in figure
3 presents an IEMP vs. margin scatter plot, after trimming. In the robustness tests,
several trimming percentile values are tested but they have no major impact on results.
Unlike the situation with estimated costs, some di↵erences were found in the de-
scriptive statistics of the IEMP for private and public companies. Figure 4 shows the
distribution of the IEMP among the main public and private electricity generation com-
24You can also read