Pay-As-You-Go Market Attractiveness Index 2019 - Lighting ...
←
→
Page content transcription
If your browser does not render page correctly, please read the page content below
Pay-As-You-Go
Market Attractiveness
Index 2019

                        IN PARTNERSHIP WITH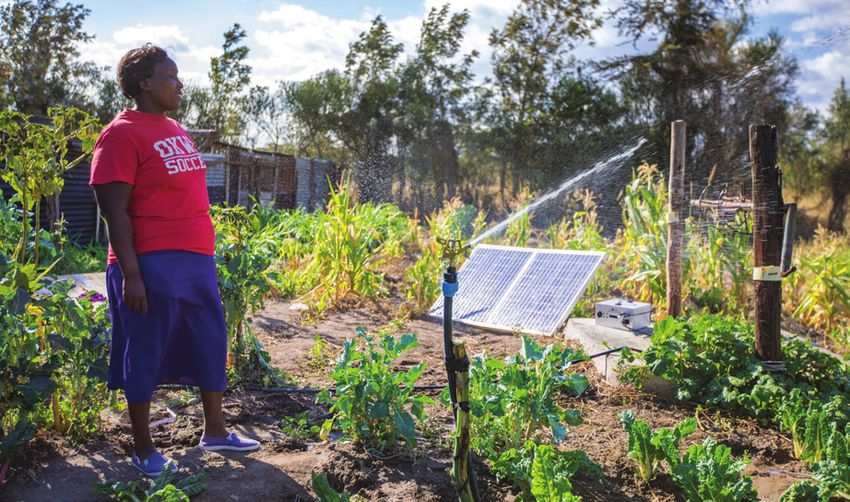
Cover photos: © Off-Grid Electric, © Hanna Dohrenbusch

PAYGo Market Attractiveness Index 2019
                                                                        i

Pay-As-You-Go Market Attractiveness Index 2019
PAYGo Market Attractiveness Index 2019
ii

     Copyright and Disclaimer

     © International Finance Corporation 2019. All rights reserved.

     2121 Pennsylvania Avenue, N.W.

     Washington, D.C. 20433 Internet: www.ifc.org

     The material in this work is copyrighted. Copying and/or transmitting portions or all of this work
     without permission may be a violation of applicable law. IFC encourages dissemination of its
     work and will normally grant permission to reproduce portions of the work promptly, and when
     the reproduction is for educational and non-commercial purposes, without a fee, subject to such
     attributions and notices as we may reasonably require.

     IFC does not guarantee the accuracy, reliability or completeness of the content included in this work,
     or for the conclusions or judgments described herein, and accepts no responsibility or liability for
     any omissions or errors (including, without limitation, typographical errors and technical errors) in
     the content whatsoever or for reliance thereon. The boundaries, colors, denominations, and other
     information shown on any map in this work do not imply any judgment on the part of The World Bank
     concerning the legal status of any territory or the endorsement or acceptance of such boundaries.
     The findings, interpretations, and conclusions expressed in this volume do not necessarily reflect the
     views of the Executive Directors of The World Bank or the governments they represent.

     The contents of this work are intended for general informational purposes only and are not intended
     to constitute legal, securities, or investment advice, an opinion regarding the appropriateness of any
     investment, or a solicitation of any type. IFC or its affiliates may have an investment in, provide other
     advice or services to, or otherwise have a financial interest in, certain of the companies and parties
     (including named herein).

     All other queries on rights and licenses, including subsidiary rights, should be addressed to IFC’s
     Corporate Relations Department, 2121 Pennsylvania Avenue, N.W., Washington, D.C. 20433.

     International Finance Corporation is an international organization established by Articles of
     Agreement among its member countries, and a member of the World Bank Group. All names, logos
     and trademarks are the property of IFC and you may not use any of such materials for any purpose
     without the express written consent of IFC. Additionally, “International Finance Corporation” and
     “IFC” are registered trademarks of IFC and are protected under international law.
PAYGo Market Attractiveness Index 2019
                                                                                                           iii

Acknowledgements

This second edition of the Pay-as-You-Go (PAYGo) Market Attractiveness Index (MAI) Report was
developed by Lighting Global to provide information on the market attractiveness for PAYGo energy
services in Sub-Saharan Africa and South Asia. It accompanies the 2019 edition of the PAYGo MAI,
an excel based tool publicly available on the Lighting Global platform. A country focus case study on
Nigeria has been developed alongside the 2019 index.

This extension and update of the PAYGo MAI, launched in June 2019, was led by Miguel Soriano,
Naomi Bruck and Itotia Njagi (IFC). Vivid Economics was commissioned to extend and update the
2018 edition of the index. This work has been conducted by Ed Day, Anita Hafner, Caroline Stuyt
and Jake Wellman. The first edition of the PAYGo MAI was conceptualized by Daniel Shepherd,
Itotia Njagi and Yann Tanvez (IFC) and developed in partnership with the Public-Private Infrastructure
Advisory Facility (PPIAF). The development of the index was conducted by a consortium led by
Vivid Economics. Lighting Global and its advisors would like to extend thanks to the wide set of
stakeholders who have supported the development of the PAYGo MAI and this report, and the
development of country focus brief for Nigeria. This includes Allwell Nwankwo (IFC), Leigh Vial (Solar
Nigeria Program), and Wiebe Boer (All-on Impact Investors), as well as representatives from PAYGo
solar companies operating in Nigeria and the Nigerian Rural Electrification Agency.

Design and Layout: Euclide Namema
PAYGo Market Attractiveness Index 2019
iv

     Lighting Global is the World Bank Group’s initiative to rapidly increase access to off-grid solar energy for the
     840 million people living without grid electricity world-wide. Lighting Global – managed by IFC and the World
     Bank – works with manufacturers, distributors, governments, and other development partners to build and
     grow the modern off-grid solar energy market. Our programs are funded with support from the Energy Sector
     Management Assistant Program (ESMAP), The Public – Private Infrastructure Advisory Facility (PPIAF), The
     Netherlands’ Ministry of Foreign Affairs, The Italian Ministry for the Environment, Land, and Sea (IMELS), and
     the IKEA Foundation.

     Vivid Economics is a leading strategic economics consultancy with global reach. We strive to create lasting
     value for our clients, both in government and the private sector, and for society at large. We are a premier
     consultant in the policy-commerce interface and resource- and environment-intensive sectors, where we advise
     on the most critical and complex policy and commercial questions facing clients around the world. The success
     we bring to our clients reflects a strong partnership culture, solid foundation of skills and analytical assets, and
     close cooperation with a large network of contacts across key organizations.
PAYGo Market Attractiveness Index 2019
                                                                                                           v

FOREWORD
Energy access remains a critical challenge for the more than 860 million people lacking access to
modern energy. In the last ten years, solar off-grid lighting and energy solutions have transformed
the global energy access landscape, providing a reliable compliment to the grid. Today, close to 180
million people have benefited from using Lighting Global Quality Verified solar lighting products.
The transformation of these off-grid markets received a major boost with the introduction of the
Pay-As-You-Go (PAYGo) business model -- an innovative approach that has revolutionized consumer
financing. The PAYGo model has not only demonstrated tremendous promise in scaling up access
and closing the energy gap, but also in graduating consumers to larger solar home systems (SHS)
that can provide an expanded array of needs beyond lighting.

The statistics from the PAYGo model are compelling – sales volume grew by 30% in 2018, with
revenues having an even better trajectory with 50% growth, primarily driven by larger SHS sales.
According to the 2018 July-December GOGLA market trends report, PAYGo companies represent
24% of the sales volume but accounted for 62% of the industry’s revenue. The success transcends
energy access, with PAYGo having an impact in driving and expanding financial inclusion across
Africa through digital payments. In some markets, solar payments have represented many
consumers’ first interaction with digital/mobile payments.

But where the model holds great promise across global markets, PAYGo companies have largely
concentrated their efforts in East Africa. The region accounts for nearly 70% of global PAYGo
market segment revenues. It is a market characterized by an attractive solar, fiscal, digital and
financial policy environment, making market insights and data readily available. The PAYGo market
attractiveness index (PAYGo MAI) responds to the industry’s need for deeper market insights to
inform and facilitate PAYGo expansion and entry plans. The 2019 version of the PAYGo MAI now
covers 24 countries across Sub-Saharan Africa and Asia.

 The index provides businesses, policymakers and practitioners with a tool to assess these markets
along a 71-point indicator matrix under three main pillars: demand, supply and enabling factors.
In addition, we hope that development partners and policy makers will use the PAYGo MAI as a
diagnostic tool to highlight gaps and opportunities for policy interventions and reforms.

A critical factor to note is that this tool does not seek to supplement the equally vital qualitative
market research that companies should undertake to define their own value propositions, route
to market, unit cost economics of last mile distribution, and other elements. Neither was this tool
intended to classify, or rank countries based on their PAYGo attractiveness. Any such classification
is incidental, relative, and comparative to others. Finally, focus summaries for select countries have
been developed to provide a deep dive into specific PAYGo solar markets. These summaries are
due to be published throughout the 2019 calendar year.

We hope that this index provides an informative tool to inform strategic and policy reform plans.
We know that this business model holds great promise that will soon extend into the productive
use of solar energy in agriculture and beyond.

                                       Russell Sturm
                                       Global Lead For Energy Access
                                       IFC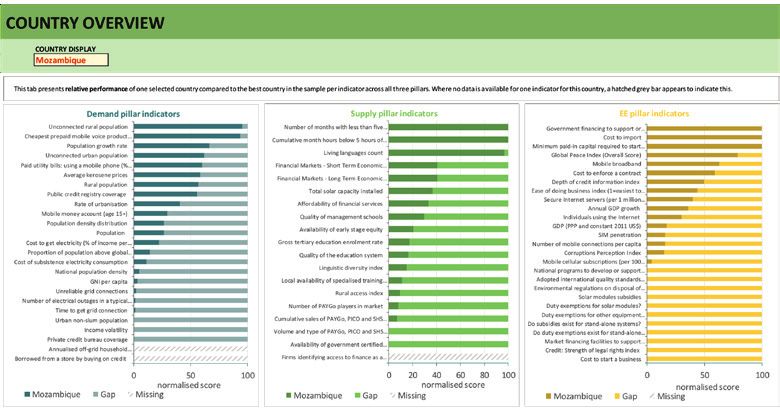
PAYGo Market Attractiveness Index 2019
vi

                   CONTENTS
                   Foreword........................................................................................................................................... v

                   1 Overview.........................................................................................................................................1

                       1.1 Objectives of the PAYGo Market Attractiveness Index (MAI)....................................................1

                       1.2 Key findings...............................................................................................................................1

                       1.3 Using the PAYGo MAI and this report.......................................................................................2

                   2 Introduction to the PAYGo MAI.....................................................................................................5

                       2.1 PAYGo MAI structure................................................................................................................5

                       2.2 What’s new in the PAYGo MAI 2019.........................................................................................6

                       2.3 Interpreting the PAYGo MAI 2019 results.................................................................................6

                   3 Summary of results of the PAYGo MAI 2019................................................................................8

                       3.1 Overall scores...........................................................................................................................8

                       3.2 Demand pillar results.............................................................................................................. 11

                       3.3 Supply pillar results................................................................................................................. 13

                       3.4 Enabling environment pillar results......................................................................................... 14

                   4 Closing remarks............................................................................................................................16

                       4.1 Overview summary of index results....................................................................................... 16

                       4.2 Emerging trends between the 2019 and 2018 editions of the PAYGo MAI............................ 17

                   Appendix A – PAYGo MAI structure...............................................................................................19

                       Demand side.................................................................................................................................20

                       Supply side....................................................................................................................................21

                       Enabling environment...................................................................................................................23

                   Appendix B – Methodology and user manual..............................................................................25

                       Overview.......................................................................................................................................25

                       Changes to the index between the 2018 and the 2019 editions...................................................26

                       Scoring and normalization.............................................................................................................27

                       Pillars and sub-pillars.....................................................................................................................29

                       Using the index.............................................................................................................................31

                   Complete list of indicators.............................................................................................................37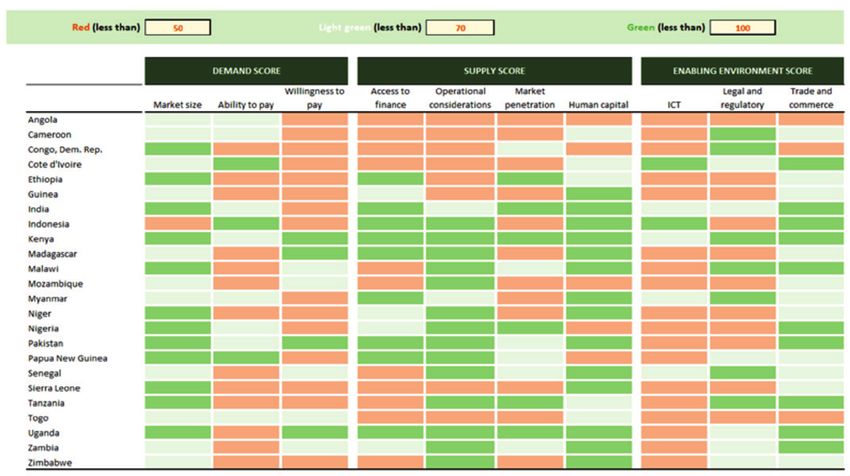
PAYGo Market Attractiveness Index 2019
                                                                                                                                                 vii

LIST OF FIGURES
Figure 1. Index structure and included indicators................................................................................3

Figure 2. The PAYGo MAI is structured across demand, supply, and enabling environment pillars.....5

Figure 3. PAYGo MAI 2019 – overall scores.........................................................................................8

Figure 4. Nigeria is ranked high in the PAYGo MAI demand pillar, but average for
enabling environment and supply indicators.......................................................................................9

Figure 5. Pakistan has the highest demand pillar score, closely followed by Kenya and Uganda...... 11

Figure 6. Kenya has the highest score on the supply pillar, Indonesia and India
come second and third respectively.................................................................................................. 13

Figure 7. Indonesia has the highest score on the enabling environment pillar,
followed by Cote d’Ivoire and Myanmar............................................................................................ 14

Figure 8. Heat map of country scores by pillar.................................................................................. 16

Figure 9. Heat map of country scores by sub-pillar........................................................................... 18

Figure 10. Index structure and indicators included............................................................................25

Figure 11. ‘PAYGo MAI’ tab................................................................................................................32

Figure 12. ‘COUNTRY OVERVIEW’ tab..............................................................................................33

Figure 13. ‘COUNTRY DEEP DIVE’ tab..............................................................................................34

Figure 14. ‘INDICATOR’ tab...............................................................................................................35

Figure 15. ‘HEAT MAP’ tab................................................................................................................35

LIST OF BOXES
Box 1. Country focus: Nigeria..............................................................................................................9

Box 2. Example indicator normalization: rural population..................................................................27

Box 3. Aggregating indicators to sub-pillar – worked example: India.................................................30

Box 4. Aggregating sub-pillars to pillar and to overall index – worked example: Pakistan.................31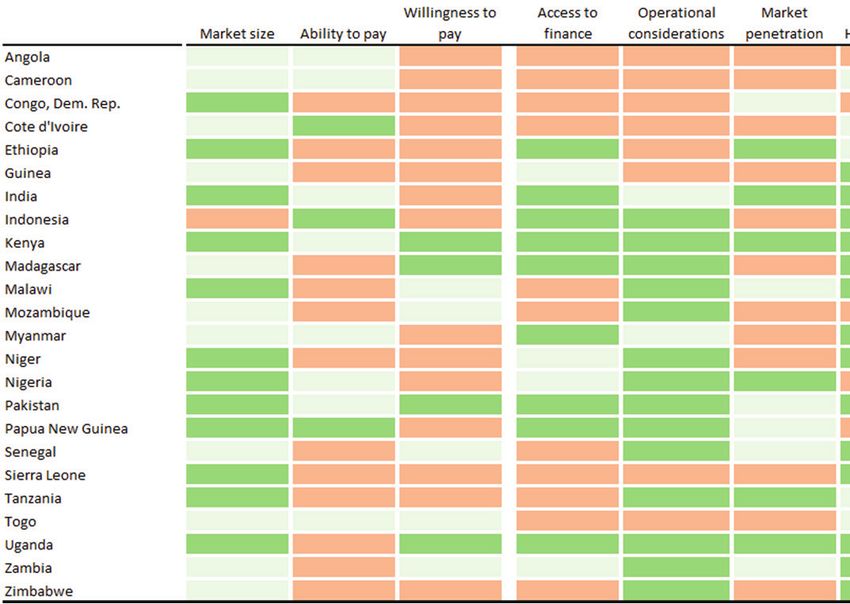
PAYGo Market Attractiveness Index 2019
  1

1 OVERVIEW
1.1 Objectives of the PAYGo Market                                                                   The metrics included are intended to give an
    Attractiveness Index (MAI)                                                                       indication of various aspects of market attractiveness
                                                                                                     (such as size of population not connected to reliable
This report introduces the updated PAYGo                                                             electricity sources and policy incentives from
MAI, a tool developed to provide information                                                         renewable energy development), and supplement
to companies, investors and policy makers on                                                         other quantitative and qualitative market research.
market attractiveness for pay as you go (PAYGo)
energy services in 24 countries across Sub-                                                          The index is not a substitute for investor due
Saharan Africa and Asia.                                                                             diligence, neither does it contain subnational
                                                                                                     analysis. It should be supported and complemented
The index comprises 71 indicators of market                                                          by targeted research conducted by the companies
attractiveness, organized under three main pillars                                                   and investors themselves to enable detailed analysis
– demand, supply and enabling environment - and                                                      supporting market entry decisions in specific
a variety of sub-pillars, explained in detail below. A                                               locations and business models. In aggregating
previous version1 of the PAYGo MAI released in 2018                                                  indicators to a national level, some indicators may
assessed the PAYGo market for 14 countries across                                                    lose valuable nuance that would be required to make
Sub-Saharan Africa. This updated version of the                                                      sub-national entry and expansion decisions.2
index has been developed for 24 countries across
Sub-Saharan Africa and Asia, selected with the aim                                                   The PAYGo MAI is an Excel based index built for
to provide a representative range of geographies,                                                    user-led comparison of country characteristics
market development, and context across each of the                                                   for market attractiveness. It is designed for user
supply, demand and enabling environment pillars.                                                     flexibility and ease. The index incorporates clearly
                                                                                                     highlighted user input options, automated updating
The 2019 version of the tool includes the following                                                  of results and a selection of outputs to quickly
countries: Angola, Cameroon, Dem. Rep. of Congo,                                                     access performance across the overall index and its
Cote d’Ivoire, Ethiopia, Guinea, India, Indonesia,                                                   pillars. It provides an overview of the performance
Kenya, Madagascar, Malawi, Mozambique, Myanmar,                                                      of a selected country, as well as the option to
Niger, Nigeria, Pakistan, Papua New Guinea,                                                          compare all countries across selected sub-pillars and
Senegal, Sierra Leone, Tanzania, Togo, Uganda,                                                       indicators.
Zambia and Zimbabwe.
                                                                                                     1.2 Key findings
The PAYGo MAI provides policymakers and
practitioners with a flexible and accessible                                                         The 2019 PAYGo MAI compares 24 country-level
tool that can be used to examine the factors                                                         markets across Sub-Saharan Africa and Asia on
that make a national market favorable for the                                                        71 indicators of relevance to the development
development of energy services through this                                                          of PAYGo technologies. This version of the index
business model and those that do not. The tool                                                       finds that Indonesia receives the highest overall
provides a structure for decision-making criteria                                                    score, supported by a high score (100/100) on both
for use on entry into a market, and for deepening                                                    the enabling environment and supply pillars. Kenya
market penetration. The purpose is to provide a                                                      is highly ranked across all three pillars, including
guiding framework and indicators that highlight the                                                  demand. India, Pakistan and Myanmar also receive
relatively more favorable conditions and challenges in                                               high scores in the overall index, indicating relatively
each market.                                                                                         strong performance from new countries added to
                                                                                                     the index in 2019 and in Asia in particular.

1 https://www.lightingglobal.org/resource/paygo-market-attractiveness-index-user-guide/
2 There are other tools available at a sub-national level. In particular: http://globalsolaratlas.info/ and https://solargis.
  com/maps-and-gis-data/download/
PAYGo Market Attractiveness Index 2019
2
Potential market segments within index
countries continue to grow. Despite continued 1.3 Using the PAYGo MAI and this report
urbanization across countries included in the index,
rural populations are growing and access to energy The PAYGO MAI (accessed at the link below)
remains a key development challenge. Urban allows for deep dive in any of the countries and
populations remain an important potential market customized weighting of the index – see appendices
as well and several countries in the index have high to this report for a user manual and full list of
scores within the demand pillar driven by a large indicators.
population with unreliable grid connections.
https://www.lightingglobal.org/resource/paygo-
PAYGo sales and use of mobile money market-attractiveness-index-user-guide/
technologies are growing across the index
countries, with early adopters deepening their A detailed user guide for the tool is presented in
markets. Kenya’s mobile money penetration has Appendix B along with a complete description
reached 73% penetration, an increase from 58% in of the individual indicators. The list of indicators
2014. In Myanmar, modest PAYGo sales have grown includes the description, year, source, impact
from 4,000 units in H2 2017 to 27,000 in H2 2018. In direction and rationale for each indicator.
Asia, micro-credit and credit bureaus are providing
a rapidly increasing route to market for potential The remainder of this summary report is
PAYGo customers. structured as follows:
• Section 2 provides an introduction to the
PAYGo market, the structure of this index and
reviews updates to the PAYGo MAI
The index incorporates clearly • Section 3 reviews key findings of the PAYGo
highlighted user input options, MAI across the demand, supply and enabling
automated updating of results and environment pillars
a selection of outputs to quickly
access performance across the • Section 4 summarises the state of the PAYGo
overall index and its pillars. market as demonstrated by the updated
PAYGo MAIPAYGo Market Attractiveness Index 2019
3
Figure 1: Index structure and included indicators
DEMAND PILLAR SUPPLY PILLAR ENABLING ENVIRONMENT PILLAR
Market size Access to finance ICT
D_1 Population size S_1 Firms who don’t identify access to EE_1 Mobile cellular subscriptions
D_2 National population density finance as a major constraint EE_2 Secure Internet servers
D_3 Population density distribution S_2 Affordability of financial services EE_3 Individuals using the internet
D_4 Rural population S_3 Avaailability of early stage equity EE_4 SIM penetration
D_5 Population growth rate S_4 Financial Markets - Short Term Economic EE_5 Mobile broadband use
Risk
D_6 Rate of Urbanisation EE_6 Number of mobile connections per capita
S_5 Financial Markets - Long Term Economic
D_7 Urban non-slum population Legal and regulatory
Risk
D_8 Unconnected rural population EE_7 Do national programs to develop or support
Operational considerations
D_9 Unconnected rban population stand-alone sysytems exist?
S_6 Rural access index
D_10 Unreliable grid connections EE_8 Has the government adopted international
S_7 Number of months with less than five quality standards for stand-alone systems?
D_11 Number of electrical outages in a typical hours of sunshine per day
month EE_9 Are there environment regulations on disposal
S_8 Cumulative month hours below 5 hours of solar devices and SHS components?
Ability to pay of sunshine per day
EE_10 Do subsidies exist for solar modules?
D_12 GNI per capita Market penetration
EE_11 Do duty exemptions for solar modules exist?
D_13 Annualised off-grid household S_9 Number of PAYGo players in market
expenditure on lighting EE_12 Do duty exemptions for other equipment
S_10 Total decentralised solar capacity related to stand-alone systems exist?
D_14 Proportion of population above global installed excluding minigrids
poverty level EE_13 Do subsidies exist for stand-alone systems?
S_11 Most recent sales volume of PAYGo,
D_15 Income volatility EE_14 Do duty exemptions exist for stand-alone
PICO and SHS products
systems?
Willingness to pay S_12 Cumulative sales volume of PAYGo, PICO
EE_15 Do government incentives exist for renewable
D_16 Borrowed from a store by buying on and SHS products since 2014
electricity?
credit Human capital EE_16 Do specific financing facilities exist for
D_17 Cost of substinence electricity S_13 Quality of management schools operators in energy access?
consumption
S_14 Local availabilty of specialied training Willingness to pay
D_18 Time to get connection services
EE_17 Depth of credit information index
D_19 Average kerosene prices S_15 Quality of the education sysytem
EE_18 Strehgth of legal rights index
D_20 Private credit bureau coverage S_16 Gross tertiary education enrolment rate
EE_19 GDP (PPP and constant 2011 US$)
D_21 Public credit registry coverage S_17 Living languages count
EE_20 Annaul GDP growth
D_22 Mobile money account (age 15+) S_18 Linguistic diversity index
EE_21 Ease of doing business index (1 = easiest to
D_23 Paid utility bills; using a mobile phone S_19 Availability of government certified 185 = most difficult)
(% paying utility bills, age 15+) training programmes for solar equipment
EE_22 Corruptions Perception Index
D_24 Cheapest prepaid mobile voice product installation
by country (in USD) EE_23 Global Perception Index
D_25 Cost to get electricity (% of income per EE_24 Cost of import
capita) EE_25 Cost to enforce a contract
EE_26 Cost to start a business
EE_27 Minimum paid-in-capital required to start a
business
Source: Vivid Economics© Azuri Technologies Ltd.
PAYGo Market Attractiveness Index 2019
 5

2 INTRODUCTION TO THE PAYGo MAI
2.1 PAYGo MAI structure                                                      of PAYGo and related products in the market,
                                                                             and access to human capital;
The market attractiveness index is structured
under three main pillars:                                                •   Enabling Environment: this covers broader
                                                                             conditions to support the development
     •    Demand: the size of the addressable market,                        of PAYGo markets that are not directly
          ability of customers to pay, and willingness to                    associated with the supply chain or in
          pay for PAYGo products;                                            generating demand. This includes: information
                                                                             and communication technology sectors
     •    Supply: access to finance, operational                             – mobile money, the legal and regulatory
          considerations to provide PAYGo products,                          environment - and conditions for trade and
          and potential partnership opportunities to                         commerce.
          support the PAYGo value chain, penetration

Figure 2: The PAYGo MAI is structured across demand, supply, and enabling environment pillars

                                 DEMAND                                                                SUPPLY
                  Market Size                                                             Access to finance
                  •     population size, density and demography                           •    private sector finance for the
                  •     current rate and means of access to energy                              PAYG sector
                  •     urban and rural populations                                       •    existence of government/donor finance

                                                                                          Operational considerations
                  Ability to pay
                                                                                          •    cost of sales and distribution
                  •     income and poverty levels
                                                                                          •    reliability of solar yield throughout
                  •     expenditure on energy
                                                                                               the year
                  •     income volatility and credit worthiness
                                                                                          •    potential for key partnerships
                  Willingness-to-pay                                                      Market penetration
                  •     cost and quality of alternatives                                  •    number of active PAYG companies
                  •     familiarity with credit products                                       in the market
                  •     access to use of mobile payment                                   •    volume of supply of solar technologies
                  •     aspirations for package of consumer goods
                                                                                          Human capital
                                                                                          •    local human capital - sales and
                                                                                               executive
                                                                                          •    labour regulation – including for
                                                                                               foreign workers
                                                                                          •    languages and linguistic diversity

                                                           ENABLING ENVIRONMENT
              Information and                                  Legal and regulatory                           Trade and commerce
              communication technology                         •   existence and enforcement                  •   ease of doing
              •       mobile and data                              of standards                                   business
                      connectivity                             •   banking regulation of the                  •   macroeconomic
              •       mobile service                               sector                                         conditions
                      infrastructure                           •   taxes and subsidies                        •   ease of acces to
              •       mobile phone penetration                     affecting PAYG business                        credit and information
              •       utilisation of mobile                        model
                      payments

Source: Vivid Economics
PAYGo Market Attractiveness Index 2019
6
2.2 What’s new in 2019?
Indeed, the overall score on the index depends on
The 2019 PAYGo MAI builds on the 2018 edition the weights placed on individual indicators, on each
of the index and incorporates a few changes. of the ten sub-pillars, and on the three main pillars.
More detail on these changes is provided in the By aggregating values of the 71 indicators (and
technical appendices to this report: the respective pillars and sub-pillars) results could
confirm expectations for one country and appear
• Index has been extended to cover 24 counter-intuitive for others. For this reason, the
countries; results of the index must be complemented with
further research and country focus studies.
• Some variables with important outlier values
are normalized to adjust and prevent ‘skewing’ There are two key reasons why index results
of results; alone should not be interpreted as defining
attractiveness of one country over another. First,
• Where data is missing, the approach to fill the data sources used are limited to a) sources
gaps has been updated to preserve the score with broad coverage across countries, b) official
for each country based on indicators where it sources, reported at the national level – often
does have data available; drawing on self-reported data (which may not pick
up on regional differences e.g. in India) and c) most
• Data sources have changed for a small recently published data. To build on and improve
number of indicators to ensure consistent this coverage, further in-country research, such
coverage across the extended range of as the included country focus Nigeria, as well as
countries; stakeholder engagement can provide a more robust
view of the market for PAYGo at the national or
• the publication of the 2018 index, some data regional level.
have become available and are updated in
the 2019 version, as detailed in the technical Second, default weightings for indicators, sub-
appendix of this report; pillars and pillars are set in the index to allow for
comparison across the 24 countries included in the
• Some indicator descriptions have been market. Users interested in a market segment or
updated to reflect changes to source data; characteristic can change these weightings at the
sub-pillar and pillar level, (see technical appendix).
• A supplementary country focus for Nigeria The ‘Country Deep Dive’ and ‘Indicator tab’ sheets
has been included and is summarised in Box 1 in the tool allow users to research more deeply
of this report. information on indicators of interest.
2.3 Interpreting the PAYGo MAI 2019 results Understanding the weightings can help users to
navigate and better understand the results. A few
The PAYGo MAI tool is just that – a tool – which examples include:
presents a wide array of information in a
comparable and consistent format. It should be • The demand pillar includes indicators for
used and interpreted to provide information in an both ‘populations with an unreliable grid
accessible format, as one source among many to connection’ and ‘unconnected populations;’
inform business and policy decisions.
• Given the novelty of PAYGo technologies
By its nature, the index will present information in many countries, PAYGo MAI presents
on countries which confirms some expectations, information that may be relevant for
presents new information, and at times may identifying future attractiveness for the
appear counter-intuitive. There is no ‘one size fits development of PAYGo products; and
all’ definition of market attractiveness for off-grid
solar (OGS) PAYGo products, and for this reason the • The supply pillar considers solar power
index does not intend to present countries that are generation and access to finance for
‘more’ or ‘less’ attractive. businesses alongside PAYGo market
penetration.PAYGo Market Attractiveness Index 2019
7
In the case of Nigeria, a relatively high level of grid • significant amounts of installed solar capacity
unreliability (100/100) drives a high-ranking score on (65/100)
the demand pillar (80/100). As shown in the Nigeria
country focus, unreliable grid connections have • operational considerations for PAYGo solar
driven a PAYGo market that largely serves urban power generation (77-100/100)
markets with poor connections, rather than the rural
unconnected markets as seen in other geographies. Outweighing relatively low scores in ‘PAYGo market
This example shows the relative interest of different penetration to date’ (17-38/100), producing a highly
parts of the index to different stakeholders. ranked supply pillar score for Pakistan (97/100).
This example demonstrates the logic behind the
Pakistan’s scores also provide an illustrative predefined weightings and indicators included in the
example of how the index can provide relevant index. PAYGo market penetration to date can be less
insights for future PAYGo activities. Pakistan’s important than other measures of market readiness
scores relatively high score in: for PAYGo operators to consider entering the market.
• access to finance for businesses (63-85/100)
© Off-Grid ElectricPAYGo Market Attractiveness Index 2019
8
3 SUMMARY OF RESULTS OF THE PAYGo MAI 2019
This section provides a summary of results 3.1 Overall scores
from the 2019 index as well as a suggestion on
how to interpret these results. It presents results Under default weights, Indonesia has the highest
under ‘default’ weights for each of the pillars and overall market attractiveness score, followed by
sub-pillars and explains how to interpret these. The Kenya, then Pakistan (Figure 3). These countries
default weights are coded into the tool, and can be score higher than all other countries in the sample
retrieved at any time, but users are encouraged to on a combined measure of demand, supply and
edit these weights to generate results based on the enabling environment indicators. Sierra Leone,
combination of pillars and sub-pillars best adapted to Angola and Mozambique score lower than other
their business models and factors of interest. countries in the sample. The default weights of the
three pillars in the PAYGo MAI place relatively larger
Overall scores reflect the weighted totals of weight on supply factors within the country, such
country scores across the demand, supply and as access to finance, operational considerations to
enabling environment pillars. The following pages provide PAYGo products, or potential partnership
provide a more detailed discussion of the overall opportunities. To better understand which respective
scores as well as country scores under each pillar. strengths of countries, drive these overall scores, it
In Box 1 we provide a worked example of the is necessary to examine results at the pillar level.
application of the tool to the country case study for
Nigeria. All data and index scores cited in this section A case study of PAYGo MAI application and
are included in the PAYGo MAI 2019, and all data supporting qualitative research is provided for Nigeria
sources are listed in the appendix. in Box 1.
Figure 3. PAYGo MAI 2019 – overall scores
100
90
80
70
60
50
40
30
20
10
0
Indonesia
Kenya
Pakistan
India
Uganda
Myanmar
Tanzania
Zambia
Senegal
Malawi
Nigeria
Papua New Guinea
Zimbabwe
Madagascar
Cote d’ Ivore
Niger
Ethiopia
Cameroon
Guinea
Congo, Dem. Rep.
Togo
Mozambique
Angola
Sierra Leone
Note: The overall score presents a weighted average of the respective scores within the three main pillars of the index:
demand, supply and enabling environment. The top-ranking country will always score 100. The default weights
assign 20% of the overall score to the demand pillar, 50% to supply, and 30% to the enabling environment.
Source: PAYGo MAI 2019PAYGo Market Attractiveness Index 2019
9
BOX 1: COUNTRY FOCUS: NIGERIA
The PAYGo MAI shows Nigeria’s significant potential demand for off-grid solar PAYGo energy services.
Nigeria’s off-grid solar PAYGo market has experienced rapid growth over recent years, with over 1.7 million
households now using off grid solar products. Current market penetration is nonetheless low, at 4% of the
potential market, reflecting high levels of unreliable grid connections and unelectrified populations.
The country’s performance on the supply pillar of the PAYGo MAI indicates market interest amongst
providers, but with barriers to scaling business models. Interest amongst PAYGo companies is high with
many entering the market, but lead-times for business development time can be up to three years before the
company makes its first sales. These start-up time requirements include developing local market intelligence,
training field agents and importing equipment into the country for distribution.
Though policy ambitions for future solar energy generation are high, few incentives are currently offered to
PAYGo companies. Direct policy support for PAYGo is limited, but national policies include targets aligned with
PAYGo market development. Policy goals include 8,000 MW of off grid solar power in rural areas by 2030,
expanded ICT access in rural areas and improvements in access to both electricity and financial services.
Recent Central Bank regulations aim to expand the mobile money offerings in the country by allowing mobile
network operators to serve as Payment Services Banks.
Figure 4 Nigeria is ranked high in the PAYGo MAI demand pillar, but average for
enabling environment and supply indicators
Rank Score Average
100 100
Demand 5 80 71
90 Market Size 90 72 90
Ability to pay 67 51
80 Willingness to pay 37 50 80
70 70
60 60
50 50
40 40
30 30
20 20
10 10
0 0
Pakistan
Kenya
Uganda
Malawi
Nigeria
Indonesia
Togo
Niger
Madagascar
India
Senegal
Cote d’ Ivore
Cameroon
Ethiopia
Papua New Guinea
Congo, Dem. Rep.
Tanzania
Zambia
Myanmar
Sierra Leone
Angola
Zimbabwe
Guinea
MozambiqueSierra Leone
0
10
20
30
40
50
60
70
80
90
100
0
10
20
30
40
50
60
70
80
90
100
Indonesia Kenya
Cote d’ Ivore Indonesia
Myanmar India
Kenya Pakistan
Senegal Uganda
India Zambia
Tanzania Papua New Guinea
Cameroon Tanzania
Zambia Myanmar
Source: Vivid Economics, based on PAYGo MAI
Zimbabwe Madagascar
Pakistan Niger
Nigeria Malawi
Malawi Nigeria
ICT
Uganda Senegal
Supply
Togo Zimbabwe
Human Capital
Ethiopia Ethiopia
Access to finance
Market Penetration
Legal & Regulatory
Trade & Commerce
Guinea Guinea
Enabling Environment
Operational Considerations
Papua New Guinea Mozambique
Sierra Leone Congo, Dem. Rep.
12
Rank
13
Congo, Dem. Rep.
Rank
Cameroon
Madagascar Angola
48
61
84
28
Angola
76
Score
42
71
56
72
Cote d’ Ivore
Score
Niger Togo
40
63
69
57
Mozambique Sierra Leone
72
49
61
58
70
PAYGo Market Attractiveness Index 2019
Average
Average
10PAYGo Market Attractiveness Index 2019
11
As explored in the Nigeria Country Focus, the West African nation stands apart from other PAYGo markets
in several ways. Innovative business models, including partnerships with mobile operators for airtime credit-
enabled PAYGo products and retail banks to leverage agent networks have helped some operators overcome
barriers to market in hard-to-reach areas and within a complex regulatory environment. A large existing
market in diesel and gas generators has inspired PAYGo companies to sell to urban markets where OGS
devices serve as secondary sources of electricity during frequent electrical outages.
Interviews with PAYGo companies and supply chain members identified a number of barriers in the market
that can be addressed by both policy and capacity development. Consumer finance is an issue as mobile
money platforms limit their engagement to their pre-existing bank account holders. Businesses find access
to finance a constraint on growth. Government support for legal frameworks that support innovative finance
to PAYGo companies (e.g. special purpose investment vehicles) may be an effective intervention to improve
access to finance.
3.2 Demand pillar results
Figure 5. Pakistan has the highest demand pillar score, closely followed by Kenya and Uganda
100
90
80
70
60
50
40
30
20
10
0
Pakistan
Kenya
Uganda
Malawi
Nigeria
Indonesia
Togo
Niger
Madagascar
India
Senegal
Cote d’ Ivore
Cameroon
Ethiopia
Papua New Guinea
Congo, Dem. Rep.
Tanzania
Zambia
Myanmar
Sierra Leone
Angola
Zimbabwe
Guinea
Mozambique
Note: The demand pillar score presents a weighted average of three sub-pillars; that is market size, ability to pay, and willingness to pay. As
with the overall index score, the top-ranking country will always score 100. The default weights assign 40% of demand pillar score to
market size, 30% to ability to pay, and 30% to willingness to pay.
Source: PAYGo MAI 2019PAYGo Market Attractiveness Index 2019
12
Under the default weights, Pakistan receives the people, it has a large share of rural population
highest score in the demand pillar, followed by (77%), and over 83% of the population live in
Kenya and Uganda (Figure 5) who score more medium density areas. In addition, 82% of the rural
than 10 points less. Pakistan is a large market with population are not connected to the grid.
especially strong scores in indicators relating to
‘willingness to pay’ and ‘market size’. Pakistan has a Uganda scores high on ‘willingness to pay’, as more
large population of nearly 200 million people, and a than 50% of the population have a mobile money
large share of its population lives in medium density account and 10% have already paid utility bills using
areas (70%). a mobile phone in the past year. Uganda has a lower
GNI per capita than most countries in the sample at
Furthermore, Pakistan has a relatively low level USD 600.
of income volatility and a large share of its
population is reported as living above global At the other side of the spectrum, Zimbabwe,
poverty levels. Pakistan also scores exceptionally Guinea and Mozambique have the lowest score
high on ‘willingness to pay’, as a large share of on the demand side pillar. Zimbabwe has a
the population has experience buying on credit relatively small addressable market, with a dispersed
where kerosene -- used here as a proxy for cost population (only 2% in ‘medium’ density areas, while
of alternatives to electricity -- is relatively more 78% live in ‘extremely low’ density areas), and a low
expensive. rate of population growth (2.2%).
Kenya received the highest score on ‘willingness Furthermore, it has a low GNI per capita (USD 1,170)
to pay’ indicators among the 24 countries. 73% and higher income volatility estimate than many
of the Kenyan adult population has a mobile money countries in the sample (18%). Guinea scores low
account, and 37% have paid utility bills using their for indicators around willingness and ability to pay. In
mobile phone in the past year. In addition, off- Mozambique, households have the lowest ability to
grid households in Kenya have significantly higher pay. Only 33% of the population are classified above
expenditures on lighting and mobile phone charging ‘poor’ income, and estimated income volatility is the
than in other countries, indicating relatively higher highest of the sample, at 24%, which may pose a
ability to pay. challenge in meeting the regular payments required
from the PAYGo credit service.
Kenya however scores only 68/100 on ‘ability to pay’
indicators, as income volatility is estimated to be A large number of countries score similarly well
relatively high at 14% and GNI per capita is lower on demand side indicators. This result indicates
than for most countries in the sample, at USD 1,460. that most countries score well in at least some sub-
pillars, and that these country strengths are relatively
Uganda scores high on market size and well distributed on the demand side. The distribution
‘willingness to pay’, offsetting a slightly weaker of scores does not provide any information on the
score in ability to pay indicators. While Uganda’s country variation in input data, as all indicators are
population is relatively small with only 43 million normalized.PAYGo Market Attractiveness Index 2019
13
3.3 Supply pillar results
Figure 6 Kenya has the highest score on the supply pillar, Indonesia and India come second and third respectively
100
90
80
70
60
50
40
30
20
10
0
Kenya
Indonesia
India
Pakistan
Uganda
Zambia
Papua New Guinea
Tanzania
Myanmar
Madagascar
Niger
Malawi
Nigeria
Senegal
Zimbabwe
Ethiopia
Guinea
Mozambique
Congo, Dem. Rep.
Cameroon
Angola
Cote d’ Ivore
Togo
Sierra Leone
Note: The supply side pillar is composed of 4 sub-pillars: access to finance, operational considerations, market penetration and human capital.
As with the demand side pillar, countries have an overall score, of which the top country scores 100. Of the 50% default weight assigned to
the supply-side pillar the sub-pillars have default weights of 30%, 30%, 20% and 20% respectively.
Source: PAYGo MAI 2019
Under the default weights, Kenya scores highest Indonesia is also exceptionally strong on human
on the supply-side pillar, followed by Indonesia. capital indicators, the quality of graduate schools
Kenya scores well on the supply side pillar, due and gross tertiary education enrolment rate, where it
to high scores across all sub-pillars. Kenya scores scores higher than all other countries in the sample.
highest on human capital indicators, with strong High scores on human capital indicators show that
scores on quality of graduate schools and quality the local labor market can supply PAYGo companies
of secondary education. A total of 33MW of total with many of the skills needed to construct and
decentralized solar capacity installed (excluding mini utilize client and supply networks.
grids) indicates higher decentralized solar uptake in
Kenya to date than in most other countries in the India and Pakistan are also highly-ranked
sample. Kenya also has a strong and reliable high countries on the supply pillar. India leads in the
solar yield year-round. ‘ access to finance’ and ‘market penetration’ sub-
pillars, which means it has the highest combined
Indonesia scores well on indicators around score of indicators within these sub-pillars. However,
access to finance, as financial services are India scores lower on operational considerations, as
affordable and there is a good availability of early rural access is less developed than in comparison
stage equity. In addition, long-term and short-term countries, and solar yield is lower in parts of the
risks on financial markets in Indonesia are classified country. Pakistan similarly has high scores across
as the lowest among countries in the sample. three out of four sub-pillars on the supply side, butPAYGo Market Attractiveness Index 2019
14
market penetration is significantly lower as shown by Sierra Leone faces a combination of low solar yield
low PAYGo sales. The PAYGo MAI does not provide and barriers in access to finance, as 65% of firms in
insights on a sub-national level. For heterogenous Sierra Leone identify access to finance as a major
countries like India, indicators on national level may constraint, and economic risk on financial markets is
not always be representative. classified as relatively high.
At the bottom of the ranking, Cote d’Ivoire, Togo There is a large difference between the highest
and Sierra Leone have the lowest supply side and lowest country scores on the supply pillar.
scores facing ‘access to finance barriers’, ‘barriers Countries on the low end of the distribution
to market penetration’ and ‘operational issues’, score considerably lower than the top countries
respectively. For Togo, the global database used in the sample on most sub-pillars, indicating that
(International Renewable Energy Association) does overarching barriers to market development may
not report any decentralized solar capacity installed, exist in these countries.
and sales volumes of PAYGo products have only
started to increase very recently.
3.4 Enabling environment pillar results
Figure 7: Indonesia has the highest score on the enabling environment pillar, followed by Cote d’Ivoire and Myanmar
100
90
80
70
60
50
40
30
20
10
0
Indonesia
Cote d’ Ivore
Myanmar
Kenya
Senegal
India
Tanzania
Cameroon
Zambia
Zimbabwe
Pakistan
Nigeria
Malawi
Uganda
Togo
Ethiopia
Guinea
Papua New Guinea
Sierra Leone
Congo, Dem. Rep.
Madagascar
Angola
Niger
Mozambique
Note: Enabling Environment is composed of three sub-pillars: Internet and Communication Technology (ICT), legal and regulatory, and trade
and commerce. The same structure applies with the top country scoring 100. Of the 30% default weight assigned to the pillar, the sub-
pillars have default weights of 50%, 30%, 20% respectively.
Source: PAYGo MAI 2019PAYGo Market Attractiveness Index 2019
15
Indonesia has the top score on the enabling Kenya, in contrast, scores well on both legal/
environment pillar, followed by Côte d’Ivoire. regulatory aspects and trade and commerce, but
Indonesia clearly leads the country sample on 5 low mobile cellular subscriptions (86%) and a low
out of 6 indicators within the ICT sub-pillar. No number of individuals using the internet (17%),
other country within the index has higher shares of among other ICT aspects, may hinder successful
mobile broadband coverage (84%), SIM penetration supply chains.
(133%) or secure internet servers per capita.
Furthermore, the country scores highly on trade and Niger and Mozambique have the lowest score on
commerce indicators, with relatively lower corruption supply side sub-pillars, scoring below average
perception, low cost to start a business and high across all three. Mozambique has exceptionally low
depth of credit information. SIM penetration (47%) and a low number of mobile
cellular subscriptions (40 per 100 people). It stands
Côte d’Ivoire’s high score results from high scores out, as there are only few measures in place to
across the ICT sub-pillar, where the country scores support developers.
high on percentage of individuals using the internet
(44%) and SIM penetration (128%). The country is Corruption perception is high, while strength of legal
similarly strong on trade and commerce sub-pillars, rights is classified as low. Niger, slightly stronger on
with the lowest cost to start a business and high commerce indicators and regulation, scores even
expected annual GDP growth (7.7%). lower across indicators within the ICT sub-pillar than
Mozambique. Only 10% of individuals are using
Myanmar and Kenya also score relatively high on the internet in Niger and there are only 41 mobile
the enabling environment pillar, with particularly cellular subscriptions per 100 people.
high scores on the legal and regulatory sub-pillar.
Myanmar is the country with the largest number of Like the supply pillar, there is a large diversity of
fiscal incentives such as solar module subsidies and country scores within the enabling environment
duty exemptions on equipment related to standalone pillar. The pillars under ‘enabling environment’
solar systems in place. include a set of indicators to evaluate the regulatory
frameworks in place. These indicators are binary
Myanmar’s ICT environment is above average, (values can only be 0 or 1) to partially explain the
the country’s trade and commerce landscape may varying differences in final scores.
however present difficulties to developers, as legal
rights are reported as low and corruption perception
is relatively high, signaling a challenging business
environment.
© Solar AidPAYGo Market Attractiveness Index 2019
16
4 CLOSING REMARKS
4.1 Overview summary of index results
The scores in the PAYGo MAI provide a high-level overview of Five countries score at the low
relative market attractiveness of the 24 countries in the index. end of the spectrum across all
Figure 8 shows the scores of each country in the index overall, and three pillars. They are Angola,
across the three main pillars, using a color coded scoring system, or Dem. Rep. Congo, Guinea,
“heat map”. Orange represents relatively poor scores, light-green mid- Mozambique and Sierra Leone.
range scores, and dark green the highest scores within each pillar.
Figure 6 provides a more
Figure 8: Heat map of country scores by pillar detailed comparison of the
scores across each of the sub-
pillars in the index. Some sub-
pillars have a comparable number
of countries marked orange,
light green and dark green
respectively, while some sub-
pillars show a more ‘clustered’
performance across countries.
For example:
• Most countries have
relatively low scores in
the willingness to pay
and ICT sub-pillars. This
is because one or more
countries in the sample
score particularly well
on these sub-pillars. The
index evaluates country
performance against
‘potential performance’,
as measured by the best
performing country in
the sample. Therefore,
the index shows that
on the ‘willingness to
pay’ and ICT sub-pillars,
there is large potential for
improvements across the
set of countries.
• Operational
Source: PAYGo MAI 2019 considerations have
mostly relatively strong
Indonesia leads the overall index score, but Kenya is the only or relatively weak
country to be ‘dark green’ and scoring highly across all three performers. Achieving a
pillars. Pakistan, Uganda and India also score well across two of the ‘good’ score on operational
three pillars, with medium scores on the remaining pillar. Tanzania and considerations is almost
Myanmar both score high on the supply and enabling environment a pre-requisite for the
pillars but score low on the demand pillar. development of a PAYGo
market at scale.PAYGo Market Attractiveness Index 2019
17
• The ‘trade and commerce’ pillar shows focus study demonstrates how urban households
many medium scores and only three with an unreliable grid connection can be a
countries score very low. This indicates significant market for PAYGo companies.
that, while there are a few countries that lack
behind and some that do very well, most Access to and use of mobile money is increasing
countries in the sample have a comparable across all countries, but not at the same rate
trade and commerce landscape and this and is only widespread in a few locations. On
aspect is not expected to be a barrier to customers with a mobile money account, between
market development in most countries. 2015 and 2017, coverage increased in Cameroon
from just 2% to 15%, and similarly in Guinea (1% to
• Kenya is the only country that scores mid- 14%), Malawi (4% to 20%), Senegal (6% to 32%)
range or high across all sub-pillars. and Togo (1 to 21%).
4.2 Emerging trends between the 2019 and The countries with the highest share of population
2018 editions of the PAYGo MAI using a mobile money account are Kenya (73%) and
Uganda (51%). In Kenya, the population share using
There have been several developments in key mobile money to pay utility bills has increased from
indicators between the 2019 PAYGo MAI and the 19% to 37%. Other countries where this share has
2018 edition. These are explored in the paragraphs increased significantly are Cote d’Ivoire, Senegal,
below. Tanzania, Zambia and Zimbabwe.
While the share of population in rural areas Alternative payment mechanisms and business
is falling, in absolute terms, rural populations models are emerging to the ‘classic’ mobile
are increasing and will remain a key market for money approach that enabled development
off-grid solar PAYGo products. All countries in of markets in East Africa. In Nigeria, PAYGo
the sample are experiencing growth in the share companies have formed partnerships with local
of urban population, with exception of Zimbabwe, banks to reach customers through their network of
where the share of urban population is decreasing agents, and their provision of consumer credit. In
very slightly. India, access to bottom of pyramid consumers and
provision of consumer credit has been achieved
However, population growth which outstrips the through partnership with micro-finance institutions
rate of urbanization means that in all counties (MFIs), rather than through direct sales of PAYGo-
except Indonesia, the size of the rural population technology-enabled products.
is increasing in absolute terms. Countries that
are experiencing the largest increase in total rural In India, credit bureau coverage, has grown to 55%
population are Niger (3.9% per year), Malawi (2.7% of population, and Indonesia has seen credit bureau
per year) and Uganda (2.6% per year). There is a coverage double from 18% to 38% in just one year
large overlap between the set of countries with high between the 2018 and 2019 editions of the PAYGo
absolute rural population growth and countries with MAI.
low access to electricity of rural population (Dem.
Rep. Congo, Guinea, Malawi, Mozambique, Sierra Across the 24 countries, sales of PAYGo products
Leone, and Zambia). increased 10% between the first and second
halves of 2018. In Cameroon, semi-annual product
As urban populations continue to grow faster sales have grown from 2,000 units in H2 of 2017
than rural populations, grid reliability continues to 55,000 in H2 2018. In Myanmar sales grew
to represent a challenge across a number of from 4,000 units, peaking at 72,000 units in H1
countries. In particular Nigeria, Pakistan, and Papua 2018 before falling to 27,000 H2 2018. Semi-annual
New Guinea appear to score poorly on reliability of sales in Ethiopia, Pakistan, Togo and Zambia more
grid services, and the ‘under the grid’ market can than doubled over this time period, while sales
represent an attractive customer base for off-grid significantly decreased in Congo, Madagascar,
solar PAYGo energy services, as these households Malawi and Uganda. India registered the highest
are often in easy to reach, densely populated areas, total units sold in H2 2018 at 1.2 million units, slightly
with relatively high incomes, but are unserved or below its sales levels in H1 2018.
underserved by the main grid. The Nigeria countryYou can also read