Turnout and Registration of Mobile European Union Citizens in European Parliament and Municipal Elections - FAIR EU
←
→
Page content transcription
If your browser does not render page correctly, please read the page content below
Turnout and Registration of Mobile
European Union Citizens in European
 Parliament and Municipal Elections
         FAIREU Analytical Report

     Derek S. Hutcheson and Luana Russo

          This research was funded by the European Union’s Rights, Equality
          and Citizenship Programme (2014-2020). The content of this report
                represents the views of the authors only and is their sole
             responsibility. The European Commission does not accept any
         responsibility for use that may be made of the information it contains.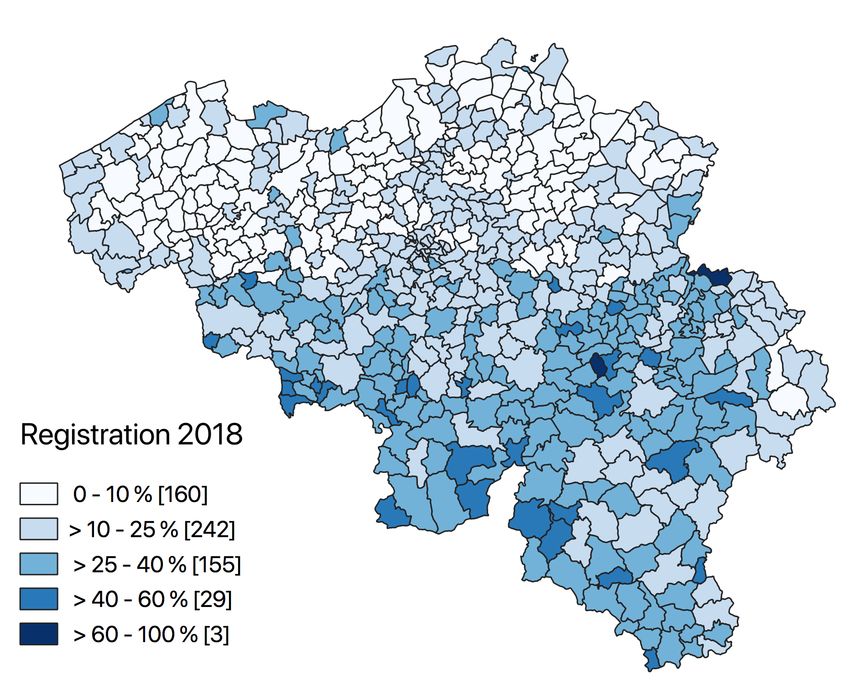
© Derek S. Hutcheson and Luana Russo, 2019

This text may be downloaded only for personal research purposes. Additional reproduction
for other purposes, whether in hard copies or electronically, requires the consent of the
authors. If cited or quoted, reference should be made to the full name of the author(s),
editor(s), the title, the year and the publisher.

Requests should be addressed to derek.hutcheson@mau.se.

The content of this report represents the views of the authors only and is their sole
responsibility. The European Commission does not accept any responsibility for use that may
be made of the information it contains

FAIR EU Analytical Report: Turnout and Registration of Mobile European Union
Citizens in European Parliament and Municipal Elections, v.1.0. [Deliverable D3.7]
Malmö & Maastricht, June 2019

                                             2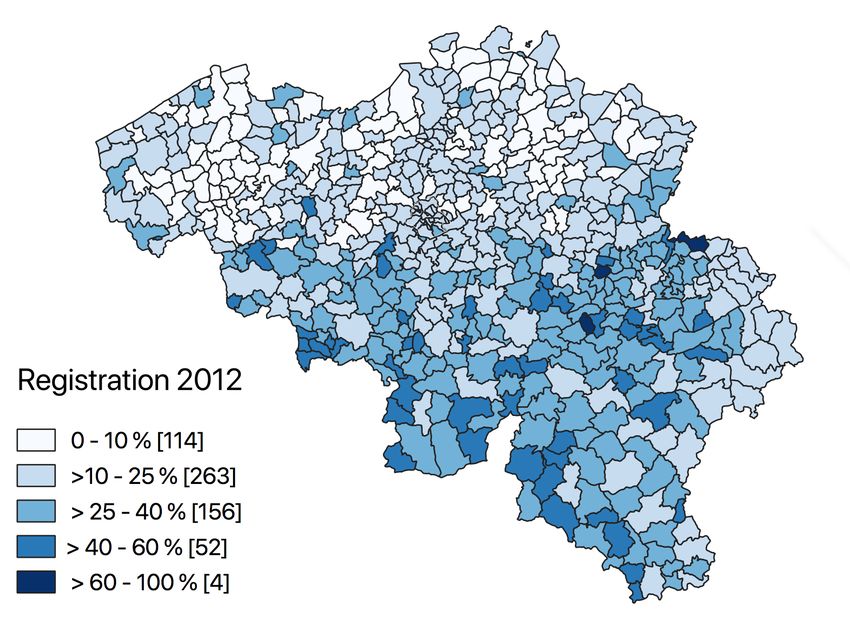
Contents
Contents ...................................................................................................................................... 3
List of Tables .............................................................................................................................. 4
List of Figures ............................................................................................................................ 5
1 Introduction ........................................................................................................................ 6
2 Scope of Directives 93/109/EC and 94/80/EC ................................................................... 7
3 The FAIREU database on turnout .................................................................................... 10
3.1 Methodology .............................................................................................................. 10
3.2 Scope of inventory ..................................................................................................... 10
3.3 Brief observations on data quality ............................................................................. 13
4 Comparative rate of participation: an overview ............................................................... 16
4.1 Municipal elections 2014-18 ..................................................................................... 16
4.2 European Parliament elections 2009 and 2014.......................................................... 20
5 Key country studies .......................................................................................................... 23
5.1 Selected old Member States ...................................................................................... 23
5.1.1 Belgium .............................................................................................................. 23
5.1.2 Luxembourg ....................................................................................................... 29
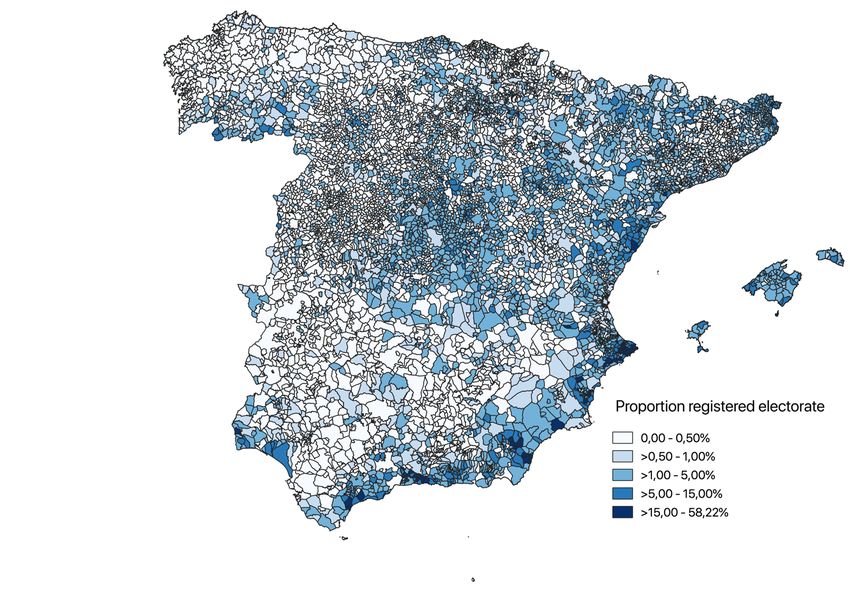
5.1.3 Spain ................................................................................................................... 35
5.2 Nordic States.............................................................................................................. 42
5.2.1 Denmark ............................................................................................................. 42
5.2.2 Sweden ............................................................................................................... 45
5.2.3 Finland ................................................................................................................ 50
5.3 New Member States................................................................................................... 53
5.3.1 Cyprus ................................................................................................................ 54
6 General Observations ....................................................................................................... 56
7 Policy Recommendations ................................................................................................. 59
Endnotes ................................................................................................................................... 62
3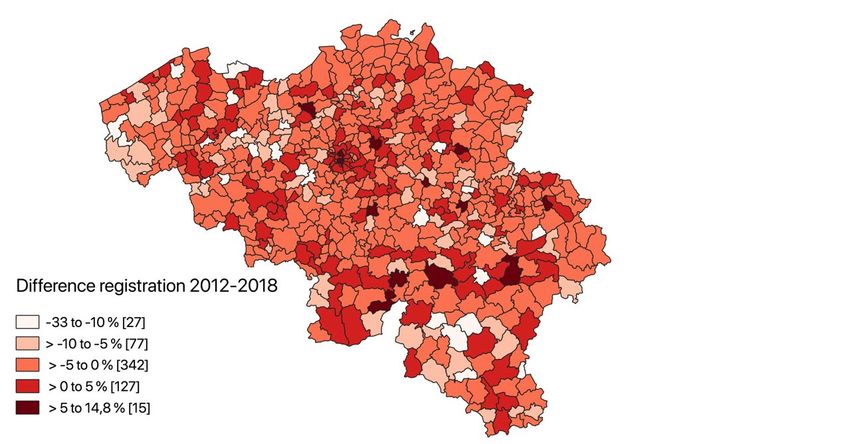
List of Tables
TABLE 1: LIST OF MOST RECENT MUNICIPAL ELECTIONS TO WHICH DIRECTIVE 94/80/EC APPLIED, PRIOR TO 1 JANUARY 2019 ....... 12
TABLE 2: REGISTRATION RATES AMONGST MOBILE EU CITIZENS, MOST RECENT MUNICIPAL ELECTIONS (2014-18) ....................... 17
TABLE 3: ELECTORAL WEIGHT OF MOBILE EU VOTERS (REGISTERED AND POTENTIAL), MUNICIPAL ELECTIONS 2014-18.................. 18
TABLE 4: TURNOUT RATES OF EU MOBILE VOTERS, MUNICIPAL ELECTIONS 2014-18 .............................................................. 19
TABLE 5: REGISTRATION RATES, RESIDENT MOBILE EU CITIZENS, EUROPEAN PARLIAMENT ELECTIONS 2009 AND 2014 ................. 20
TABLE 6: TURNOUT RATES, NON-RESIDENT CITIZENS (MOBILE EU VOTERS), EUROPEAN PARLIAMENT ELECTION 2014 ................... 22
TABLE 7: REGISTRATION RATES, EU CITIZENS, MUNICIPAL ELECTIONS 2018, BELGIUM ............................................................ 25
TABLE 8: REGISTRATION RATES BY REGION, MUNICIPAL ELECTIONS 2012 AND 2018, BELGIUM ................................................ 25
TABLE 9: REGISTRATION RATES, EU AND NON-EU CITIZENS (AMONGST THOSE ELIGIBLE), MUNICIPAL ELECTION 2017, LUXEMBOURG
      ..................................................................................................................................................................... 30
TABLE 10: MOBILE EU CITIZEN REGISTRATION RATES (NUMBER AND % OF ELIGIBLE), MUNICIPAL ELECTION 2017, LUXEMBOURG ... 32
TABLE 11: REGISTERED EU VOTERS, EUROPEAN PARLIAMENT ELECTIONS, LUXEMBOURG, 1994-2014...................................... 35
TABLE 12: REGISTERED VOTERS BY CATEGORY, MUNICIPAL ELECTIONS, 2003-2019, SPAIN ..................................................... 37
TABLE 13: REGISTERED VOTERS BY CATEGORY, EUROPEAN PARLIAMENT ELECTIONS, 2009-2019, SPAIN ................................... 37
TABLE 14: REGISTRATION RATES BY NATIONALITY, MUNICIPAL ELECTIONS, 2011, SPAIN (% OF VOTING-AGE POPULATION BY
      NATIONALITY) .................................................................................................................................................. 41
TABLE 15: TURNOUT BY PLACE OF BIRTH AND CITIZENSHIP, MUNICIPAL ELECTIONS, 2009-17, DENMARK ................................... 43
TABLE 16: ELECTORATE BY CITIZENSHIP, MUNICIPAL AND REGIONAL ELECTIONS 2002-2014, SWEDEN (PROPORTION OF ALL VOTERS)
      ..................................................................................................................................................................... 45
TABLE 17: VOTING TURNOUT (NON-SWEDISH-BORN) BY REGION OF BIRTH AND SWEDISH CITIZENSHIP STATUS, MUNICIPAL ELECTIONS
      2006-14, SWEDEN (% OF REGISTERED IN EACH GROUP) .......................................................................................... 47
TABLE 18: ELECTORAL PARTICIPATION IN EUROPEAN PARLIAMENT ELECTIONS, 2004 AND 2009 (% OF REGISTERED ELECTORATE, BY
      CATEGORY), SWEDEN ........................................................................................................................................ 50
TABLE 19: TURNOUT RATES MUNICIPAL ELECTIONS 2017, FINLAND (% OF REGISTERED ELECTORATE IN EACH CATEGORY) .............. 52
TABLE 20: TURNOUT IN EP ELECTION 2014 AMONG REGISTERED MOBILE EU VOTERS (ALL NATIONALITIES WITH MORE THAN 1,000
      REGISTERED VOTERS), CYPRUS ............................................................................................................................. 55

                                                                                     4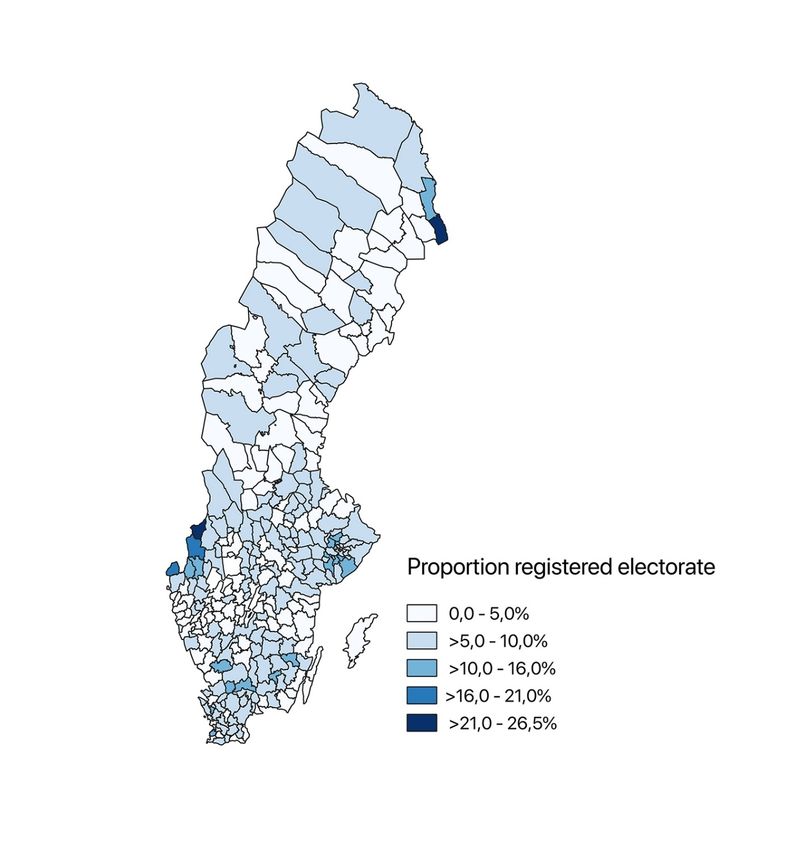
List of Figures
FIGURE 1: REGISTRATION RATES AMONGST MOBILE EU CITIZENS (% OF VOTING-AGE MOBILE EU CITIZENS RESIDENT IN COUNTRY),
      EUROPEAN PARLIAMENT ELECTIONS, 2009 AND 2014 ............................................................................................ 21
FIGURE 2: REGIONS IN BELGIUM ................................................................................................................................... 24
FIGURE 3: REGISTRATION RATES (% OF ELIGIBLE EU CITIZENS REGISTERED) BY MUNICIPALITY, 2012, BELGIUM ............................ 26
FIGURE 4: REGISTRATION RATES (% OF ELIGIBLE EU CITIZENS REGISTERED) BY MUNICIPALITY, 2018, BELGIUM ............................ 27
FIGURE 5: DIFFERENCE IN 2012 AND 2018 REGISTRATION RATES (RELATIVE TO 2012), MOBILE EU CITIZENS, BY MUNICIPALITY,
      BELGIUM ........................................................................................................................................................ 28
FIGURE 6: MOBILE EU REGISTRATION RATES BY MUNICIPALITY, EUROPEAN PARLIAMENT ELECTION 2014, BELGIUM .................... 29
FIGURE 7: REGISTRATION RATES OF FOREIGN CITIZENS, BY LENGTH OF TIME RESIDENT IN LUXEMBOURG (2017, % OF ELIGIBLE) ...... 31
FIGURE 8: PROPORTIONS OF VOTING-AGE POPULATION REGISTERED, NON-REGISTERED AND INELIGIBLE, BY NATIONALITY, MUNICIPAL
      ELECTION 2017, LUXEMBOURG (% OF TOTAL) ....................................................................................................... 33
FIGURE 9: REGISTERED NON-SPANISH VOTERS, BY MUNICIPALITY, 2015, SPAIN (% OF TOTAL ELECTORATE) ................................ 38
FIGURE 10: NUMBER OF REGISTERED NON-SPANISH VOTERS, MUNICIPAL ELECTIONS, SPAIN, 2015 (TOTAL NUMBER OF ELECTORS, BY
      AGE GROUP) .................................................................................................................................................... 39
FIGURE 11: REGISTRATION RATES BY AGE COHORT, FOREIGN CITIZENS, MUNICIPAL ELECTIONS, 2011, SPAIN (% OF ELIGIBLE
      ELECTORATE) ................................................................................................................................................... 40
FIGURE 12: ELECTORAL WEIGHT OF NON-SWEDISH CITIZENS, BY MUNICIPALITY (PROPORTION OF TOTAL ELECTORATE, %), 2018,
      SWEDEN ......................................................................................................................................................... 46
FIGURE 13: TURNOUT RATES IN MUNICIPAL ELECTIONS 2006-14 AMONG FOREIGN-BORN VOTERS, BY LENGTH OF TIME IN COUNTRY
      (YEARS), SWEDEN ............................................................................................................................................. 49

                                                                                   5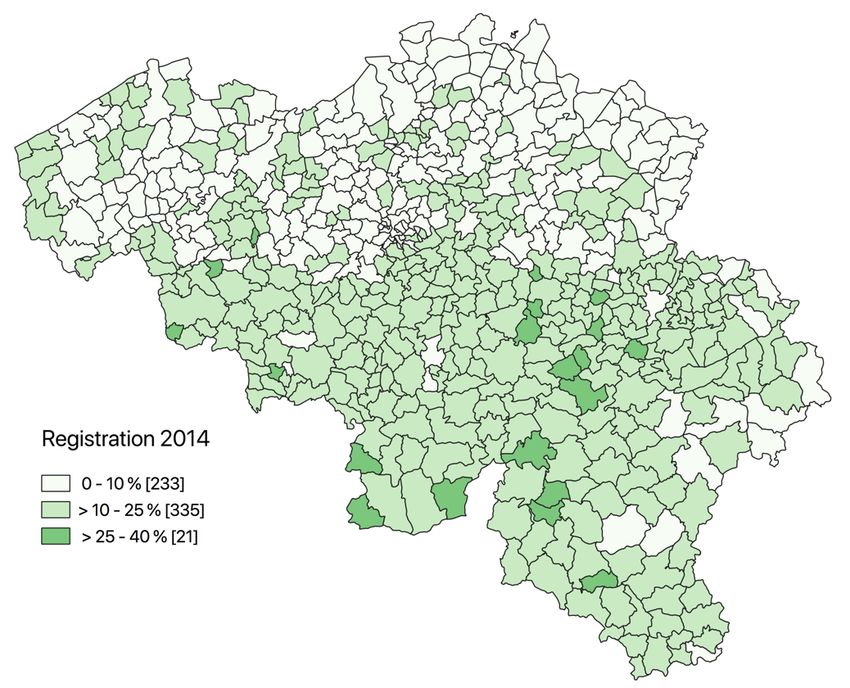
1 Introduction
Democracy is one of the fundamental values of the European Union (EU). 1 The starting point
of democracy is that it represents ‘rule of the people’. But which people should be
represented? In this report, we put a particular focus on the representation of ‘mobile EU
citizens’ – people holding the citizenship of one Member State who have used their freedom
of movement rights to live or work in another.
Since the Maastricht Treaty, national citizens of European Union (EU) Member States (MS)
have been vested with a derivative citizenship of the Union. Such citizenship gives them not
only the right to move and reside freely within the EU, but also the ‘to vote and to stand as
candidates in elections to the European Parliament (EP) and in municipal elections in their
Member State of residence, under the same conditions as nationals of that State’. 2
The 14.3 million people of voting age who live in an EU country other than their own
collectively form a group that is larger than the individual electorates of 21 of the 28 Member
States. Though a small proportion of the overall EU population, and dispersed across the
continent, residential concentration can mean that they represent a sizeable proportion of
potential voters in some locations. If they cannot fully access their democratic rights, the
result may be a ‘representation gap’, in which their views are systematically less represented
than those of other EU citizens. In other words, mobility potentially leads to diminution of
democratic participation and quality amongst the mobile citizens of the EU, unless voting
rights follow.
The Treaty provisions on electoral rights, and the Directives that give them substance –
93/109/EC (EP elections) and 94/80/EC (municipal elections) – are designed to address the
misalignment of national citizenship and electoral territories. They resolve it only partially.
First, they concern only EP and municipal elections – leaving electoral rights in national-level
elections subject to Member States’ own rules. It is entirely possible for a mobile EU citizen
to end up with limited or no voting rights in any national parliament election. With the partial
exception of the UK and Ireland, no EU states grant other EU citizens the right to vote in their
national-level elections, and not all states allow their own citizens to vote from abroad. 3
Second, Directive 93/109/EC concerns only EP voting rights of Union citizens in the country
in which they live, but not relative to their country of origin. Third, even where the Directives
imply an automatic right to voting rights in municipal elections, there is wide disparity in the
ease with which mobile EU citizens can access these rights, and the administrative powers of
the local government units to which they apply (as will be discussed below).
The Directives have been in place for a quarter of a century, but we still have remarkably little
knowledge of the extent to which mobile EU voters actually use their electoral rights. It is this
gap that this FAIREU report addresses. First, it looks at the scope and enactment of Directives
93/109/EC (EP elections) and 94/80/EC (municipal elections). Thereafter, it examines the
available information on registration and turnout rates amongst mobile EU voters, in the most
recent municipal elections and EP elections prior to 2019 in each Member State. Finally, it
examines the available registration and turnout data of mobile EU voters in a selection of key
countries. Based on these three levels of analysis, tentative are drawn conclusions about the
participation rates of mobile EU citizens in EP and municipal elections across the EU, and
policy suggestions are made based on them.
                                                6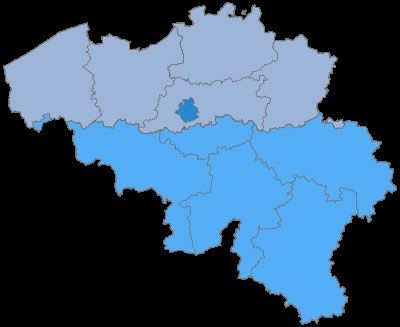
2 Scope of Directives 93/109/EC and 94/80/EC
Directive 93/109/EC (as amended) lays down detailed arrangements for mobile EU citizens to
vote and stand as candidates in EP elections in their states of residence. 4 In essence, the key
provision is that mobile EU citizens should have voting and candidacy rights in their country
of residence, unless deprived of their electoral rights in their home countries, if they fulfil the
same criteria as the Member State ‘imposes by law on its own nationals’ (Art. 3).
This formulation is important insofar as it does not create a universal electoral standard across
the Union. Voting and candidacy rights are accorded in line with national specificities. For
example, the minimum voting age in Austria (and Malta, with effect from 2019) is 16 years,
two years lower than in other EU states. The minimum age for candidacy varies from 18 to 25
years across the EU. Each Member State has different provisions on disenfranchisement based
on criminal convictions and mental incapacity. 5 Some states also impose residency and
registration restrictions, such as a requirement for permanent as opposed to temporary
residency; minimum periods of prior residency; or different procedures for registration
between EU and national citizens. In Belgium, Cyprus, Greece and Luxembourg, voting is
also compulsory once registered (at least formally). In other states, it is voluntary. 6
Electoral rights of mobile EU citizens as external citizens in their home countries also vary
widely. Directive 93/109/EC acknowledges a mobile EU citizen’s right to ‘vote and to stand
as a candidate in the Member State of which the citizen is a national’ and ‘to choose the
Member State in which to take part in European elections’. But it does not make this a
requirement, stating explicitly that these arrangements do not impinge on the prerogative of
Member States to determine their own external voting and candidacy rules. De facto,
therefore, some mobile EU voters have a choice of whether to vote or stand for election to the
European Parliament in their country of origin or of residence (with the caveat that double
voting is prohibited), while others do not.
A similar formulation features in Directive 94/80/EC (as amended), 7 in respect of mobile EU
citizens’ voting and candidacy rights in municipal elections. Once again, the key point is that
states may impose the same restrictions as they do on their own nationals (Art. 3), meaning
that different rules on minimum ages, registration requirements, etc. apply from country to
country.
There are two further specificities in municipal elections. The first is that the fundamental
definition of ‘basic local government unit’ differs from state to state. The applicable entities
vary in administrative importance and size. For example, mobile EU voters in France may
vote only in elections to their local commune (low-level territorial divisions with on average
fewer than 2,000 inhabitants), but not to larger subnational territorial units such as the 13
régions or 101 départements. At the other end of the spectrum, EU voters may vote in the
highest-level territorial subdivisions in Denmark (5 regioner), Croatia (20 županija), Sweden
(21 län) and Slovakia (8 samosprávny kraj), each of which can encompass several hundred
thousand voters.
Second, the Directive permits (but does not require) Member States to restrict certain
municipal executive offices (‘elected head, deputy or member of the governing college of the
executive of a basic local government’ – Art. 5.3) to their own nationals. Thus, even if it is

                                                 7
possible for mobile EU citizens to vote and to be elected as municipal deputies, it is not
always possible for them to exercise executive responsibility.
Successive implementation reports have indicated that there have been several obstacles to the
practical application of Directive 94/80/EC, such as arbitrary minimum residence periods and
failure to count time spent in other EU Member States in lieu. 8 Over the last few years, most
of these formal legal inconsistencies have been removed, 9 but in practice there remain
significant de facto obstacles to mobile EU citizens who wish to exercise their democratic
rights in municipal and EP elections. 10
Even if EU citizens have the right to vote in local and EP elections, it is unclear that anything
close to a majority of them can and will. There are several ‘filters’ on participation. The first
group of obstacles concerns eligibility and registration. Whereas registration on the electoral
roll is automatic in most countries for native citizens, in more than half the Member States
mobile EU voters are required to register themselves separately on the electoral register, even
if they are already living in the country. For local elections, this is the case in 15 of the 28 EU
Member States, and for EP elections, in no fewer than 25 of them. 11 Moreover, the definition
of residency differs from state to state and in some countries requires a minimum number of
months’ or years’ prior residence. In EP elections, as noted above, a majority of mobile EU
citizens (but not all, depending on their country of origin) may also have the option of voting
in their home country, which means that registration rates in countries of residence should be
considered alongside those in countries of origin.
Second, even where voters are registered, turnout amongst non-citizens may also be lower
than among native citizens. Unfamiliarity with the local political landscapes or language
barriers may act as a disincentive to participation, as well as specific national rules (such as
compulsory voting). The reason for a voter’s mobility may also affect his or her propensity to
participate: those whose main reason for mobility is a short-term work opportunity or other
temporary situation such as study may feel less commitment to vote in their country of
residence than long-term mobile EU citizens who plan a long-term future there. This also
draws attention to the fact that, even where the body of mobile EU citizens remains stable in
size, there may be turnover in the people who comprise it from one election to the next.
We have hitherto had remarkably little empirical information on the extent to which mobile
EU citizens actually do participate in local and European elections. Eurobarometer studies
have suggested that general awareness of EU mobile voting rights in local and European
elections has been falling in recent years – but these awareness figures are measured among
the general population, not mobile EU citizens themselves. 12 The Commission’s own reports
on the implementation of Directive 94/80/EC have indicated that registration and turnout rates
that are much below those for native citizens – but the depth of the studies has been hampered
by poor response rates from national authorities, and limited data. 13
The current report seeks to add to the foundational work done by these reports through the
compilation of a comprehensive database of registration and electoral results across EU
Member States in the most recent two EP elections and the most recent municipal elections. 14
It allows us to build a more comprehensive picture of registration and turnout rates amongst
mobile EU citizens across Europe in local and European Parliament elections. The overall
picture is of turnout rates that are universally much lower than those of national citizens in
                                                8
each state. But there is wide variation, and whether this primarily manifests itself through low
registration rates or low turnout rates, or a combination of the two.
Two further caveats are in order before continuing. First, there are many categories of
foreign-born or foreign-background voters, but the current report has a narrow focus primarily
on ‘mobile EU citizens’ – people who hold the citizenship of an EU state other than the one
they live in, but do not hold the citizenship of their state of residence. Some foreign-born
people may be citizens of their country of residence (e.g., through naturalisation or
derivatively from birth) – but in electoral statistics they are usually counted as part of the
resident citizenry, rather than as mobile EU citizens. Relevant distinctions should therefore be
made between ‘foreign-born’, ‘foreign citizen’ and ‘non-citizen’. There may also be other
electoral levels apart from EP and basic municipal elections in which non-national EU
citizens or non-EU citizens have voting rights - but these are afforded by national-specific
legislation. Our focus in this report is primarily on those whose voting rights in municipal and
EP elections derive directly from their status as EU citizens from another EU country, through
the application of EU law.
Second, the report focuses on active electoral rights – the uptake of the right to vote. This is
not to deny the importance of passive electoral rights for mobile EU citizens (the right to
stand as a candidate), which are covered in other parts of the FAIREU and previous
projects. 15 But this report primarily focuses on registration and turnout rates among mobile
EU voters in EP and municipal elections across the Union.
93 The FAIREU database on turnout
3.1 Methodology
In order to assess the participation of mobile EU citizens in municipal and EP elections, a
database was constructed for the most recent municipal elections prior to 1 January 2019 to
which Directive 94/80/EC applied, and also to the two most recent EP elections prior to the
May 2019 contest (2009 and 2014, except in Croatia where the first EP election took place in
2013). The 2019 EP election is not systematically included in the database, as not all states
had officially finalised and published their definitive results and/or deep-level breakdowns of
registration and turnout, at the time of going to press. Where relevant details are known from
the provisional results, they are included in the country reports in section 4.
Whereas the Commission’s reports on participation rates focus on questionnaire returns from
national authorities, 16 the database used for the current report prioritises publicly-available
official sources of electoral information, supplemented with other reliable and verifiable data
(including queries to national authorities).
For each election, the following sources of information were sought in order of priority. First,
registration and turnout figures for the election in general were identified. Thereafter, specific
registration and turnout data for mobile EU citizens were sought. The unavailability of data
through one source of information led to the continuation of the search through the next level
of enquiry:
• official data in the public domain (e.g., official results from electoral commissions and
parliamentary documents);
• Publicly available research data from reputable academic studies; 17
• Links to official figures from reputable secondary sources (e.g., European
Commission implementation report summaries, press releases and newspaper articles
based on official data which itself is no longer available); 18
• Approaches via FAIREU country experts to national authorities, with formal freedom
of information requests;
• Direct approaches from the current authors to national authorities, with informal
freedom of information requests or requests for clarifications.
• Gaps in data are filled in from the findings of the FAIREU country experts as
presented in the project’s country reports. 19
The data utilised are listed in a separate database available on the FAIREU website. 20
3.2 Scope of inventory
The data cover the 2009 and 2014 European Parliament election in all EU Member States and
the most recent municipal elections prior to 1 January 2019. Our focus is on voting rather
than on candidacy. For both EP and municipal elections, the criteria for inclusion were:
• Legislative elections
• Mobile EU citizens entitled to vote in the election in their country of residence, under
the provisions of Directives 93/109/EC (EP elections) or 94/80/EC (municipal
elections)
• Participation in voting (active electoral rights).
10For maximum comparability, the focus in the database is on municipal legislative elections, as
such bodies exist in every EU Member State, and mobile EU citizens are granted the franchise
to them through Directive 94/80/EC. In some countries, mobile EU citizens can also vote in
other forms of local government elections – for example, mayoral contests. Such electoral
rights vary from country to country and also reflect differences in local government
structures, but are not universal across the EU.
In some countries, national legislation on voting rights goes beyond the inclusiveness
requirements of Directive 94/80/EC. Twelve EU states (Belgium, Denmark, Estonia, Finland,
Ireland, Luxembourg, the Netherlands, Slovakia, and Sweden; plus Spain, Portugal and the
UK for selected nationalities) give voting rights to third-country citizens (TCCs) as well as
EU citizens in municipal elections, albeit typically after much longer waiting periods or only
by reciprocity. In the database, our focus has been on mobile EU citizens only, except where
no distinction is made in the registration data between different categories of non-national
voters (such as in Sweden, which simply records the number of ‘non-Swedish’ voters without
geographical breakdown of nationality).
Data were assembled or calculated for each election in respect of the following parameters,
where available:
• Registration:
o absolute number of mobile EU voters registered.
o proportion of registered EU electorate relative to the overall electorate (share
of electorate).
o proportion of registered EU electorate relative to mobile EU citizens of voting
age (registration rate).
• Turnout
o Absolute number of mobile EU citizens actually voting.
o Proportion of EU voters relative to the number of registered mobile EU
citizens (turnout as % of registered EU voters).
o Proportion of EU voters relative to the total number of EU citizens of voting
age (registered and non-registered) (turnout as % of eligible EU voters).
As explained further in section 2.3, not all countries had equally comprehensive data, and in
some cases it was not possible to ascertain with accuracy the registration or turnout rates.
As a methodological point, ‘turnout’ is not defined identically in each country’s electoral
legislation. For the purposes of comparison, it has generally been calculated as the number of
ballot papers given out (if this is different from the number of ballot papers in urns), relative
to the registered electorate. In this definition, invalid ballot papers are included (on the basis
that these are still cast by people who have turned out to vote, even if they are discounted
from final results). This may lead to minor deviations between official turnout rates
calculated according to national specificities, and this uniform measure. ‘Registration rates’
are defined according to the denominator of eligible people who could in principle register –
which sometimes involves a degree of estimation where it concerns populations of non-
citizens in decentralised countries (see sections 2.3 and 3.1).
11The database comprises turnout data on the 2009 and 2014 European Parliament elections for
each available country, and the most recent municipal elections to which Directive 94/80/EC
applied, held prior to 1 January 2019. The list of elections included is given in table 1.
Table 1: List of most recent municipal elections to which Directive 94/80/EC applied, prior
to 1 January 2019
Code Country name Election date Local government level
AT Austria Various Gemeinden
BE Belgium 14/10/2018 Commune/Gemeente/Gemeinde
BG Bulgaria 25/10/2015 Obshtina
BG Bulgaria 01/11/2015 Obshtina (2nd round)
CY Cyprus 18/12/2016 Δήμοι (Dimoi) – Municipalities
CZ Czech Republic 05/10/2018 Obec
DE Germany Various Gemeinde
DE Germany Various Kreise/Kreisfreie Städte/Gemeinde
DK Denmark 21/11/2017 Kommuner
DK Denmark 21/11/2017 Regioner
EE Estonia 15/10/2017 Linnad/vallad
EL Greece 18/05/2014 Δήμοι (Dimoi) – Municipalities
ES Spain 24/05/2015 Municipio
FI Finland 09/04/2017 Kuntaa/kommuner
FR France 23/03/2014 Commune
FR France 30/03/2014 Commune (2nd round)
HR Croatia 21/05/2017 Općina/grad
HR Croatia 21/05/2017 Županija (counties)
HR Croatia 04/06/2017 Općina/grad (2nd round)
HR Croatia 04/06/2017 Županija (counties) (2nd round)
HU Hungary 12/10/2014 Települések (communities)
IE Ireland 23/05/2014 County (26), city (3) + city & county (2)
IT Italy 25/05/2014 Comune (selected regions)
IT Italy 30/05/2015 Comune (selected regions)
IT Italy 05/06/2016 Comune (selected regions)
IT Italy 11/06/2017 Comune (selected regions)
IT Italy 10/06/2018 Comune (selected regions)
LT Lithuania 01/03/2015 Savivaldybė
LT Lithuania 15/03/2015 Savivaldybė (2nd round)
LU Luxembourg 08/10/2017 Commune
Novadi (municipalities) (110) + republikas pilsētas
LV Latvia 03/06/2017
(republican cities) (9)
MT Malta 11/04/2015 Kunsill lokali
NL Netherlands 21/03/2018 Gemeente
PL Poland 21/10/2018 Gmina
PL Poland 04/11/2018 Gmina (2nd round)
PT Portugal 01/10/2017 Assembleia de Freguesia
PT Portugal 01/10/2017 Assembleia Municipal
PT Portugal 01/10/2017 Câmara Municipal
12RO Romania 05/06/2016 Comune/oraşe
RO Romania 19/06/2016 Comune/oraşe (2nd round)
SE Sweden 09/09/2018 Kommun
SE Sweden 09/09/2018 Län
SI Slovenia 18/11/2018 Občine
SI Slovenia 02/12/2018 Občine (2nd round)
SK Slovakia 04/11/2017 Samosprávny kraj
SK Slovakia 10/11/2018 Obec; mesto; mestská časť
counties in England;
counties, county boroughs and communities in Wales;
regions and Islands in Scotland;
districts in England, Scotland and Northern Ireland;
UK United Kingdom Various
London boroughs;
parishes in England;
the City of London in relation to ward elections for
common councilmen.
Key: ISO/EU country codes.
In the majority of Member States, elections to municipal authorities are held simultaneously
across the whole country on the same day, at regular intervals. In some cases (for example,
Austria, Germany and the United Kingdom (UK)), municipal elections are held on different
cycles in different parts of the country. In Germany, there have been several exceptions made
to these term limits to create a gradual convergence in the majority of the federal states
between municipal and European Parliament electoral cycles.
3.3 Brief observations on data quality
Although this study arguably represents the most systematic attempt hitherto to map electoral
registration and turnout rates among mobile EU citizens in municipal and European
Parliament elections, it is still not completely exhaustive. There are a number of reasons for
this.
First, electoral commissions often do not publish more than a general summary of registration
and turnout numbers for the whole electorate. It is generally possible to ascertain overall
registration and turnout statistics – but relatively rare for published registration and turnout
figures to be disaggregated further by citizenship, gender, age or other demographic factors.
Second, the availability of registration/turnout data specifically on mobile EU citizens is
particularly patchy. When a breakdown by citizenship status does exist, it is more usual to be
found for registration figures than turnout data, for reasons explained below.
Only in a few cases (e.g., Bulgaria, Belgium, Denmark, Finland, Poland, Spain, Sweden) are
official registration rates published with a clear differentiation between national and non-
national citizens, particularly in municipal elections. Even then, the figures are sometimes
only published at polling station level (e.g., in Bulgaria and Poland) rather than collated
nationally; and they do not always distinguish EU and non-EU ‘foreign voters’ in general.
Even when EU citizens are demarcated from national citizens in electoral registers, it is
unusual for published figures to give a breakdown of these voters by nationality. Only for a
handful of countries (Belgium, Cyprus, Denmark, France, Luxembourg, and Spain) were such
data available in respect of municipal elections; plus Austria, Estonia and Romania for
13European Parliament elections. Even then, generally the numbers were found only in longer
analytical reports (rather than tabular electoral results), through secondary analysis (e.g.,
register-based academic studies in Denmark, Luxembourg, Spain) or through data available
from freedom of information requests (e.g., Belgium and Cyprus). In the main, however, we
know very little about the individual countries from which mobile voters EU hail.
For countries where external voting is possible in European Parliament elections, the
breakdown of resident and non-resident voters is not always made clear in each country’s
electoral statistics, nor the countries in which people voted.
A final problem is that in some cases different official documents may contradict each other
or contain slightly different information. 21 This means that a value judgement sometimes has
to be taken as to which of two different ‘official’ figures is the more accurate, even if the
differences are sometimes minor. In the case of turnout and registration data, generally the
more detailed of the two has been used – unless it clearly predates the less detailed but
possibly more definitive one.
Having identified some of the drawbacks of available data, we can briefly note the most
common causes of them:
• Registration procedures. Voter registration is often administered at municipal or
district level, which causes difficulties of data aggregation, particularly for external
voters (who are dispersed across the whole country’s electoral registers). In highly
decentralised states (such as the federal countries of Austria and Germany, and the
UK), it is particularly difficult to keep track of mobile EU voter turnout and external
voting. 22
• Lack of public data. In several countries, registration rates for mobile EU voters are
not published. For some, such as the UK, the data are simply not available. 23 Other
countries aggregate data privately, but do not publicly release it except by request or to
official bodies. Formal or informal freedom of information requests by the current
authors or the network of FAIREU country experts obtained aggregate-level figures
for Belgium, Bulgaria, Czech Republic and Cyprus that were not otherwise in the
public domain.
• A particular lack of turnout data availability:
o In some cases, once the qualification to enter the list of eligible voters for a
particular election has been established, no further distinction is maintained on
the electoral list between different categories of voter, on the basis that all are
equally entitled to vote – making it impossible to differentiate their turnout
rates.
o In other countries (such as the UK), turnout is recorded on voter lists manually.
Theoretically it would be possible to go through the marked registers and make
a manual count by type of voter, but it would require an army of researchers to
examine each page of each marked paper register for every municipality – an
impossible logistical task. 24
14o Different national electoral requirements on how to record/report official
election results mean that the distinction between EU and national citizens is
reported in some countries, but not in others.
154 Comparative rate of participation: an overview
In this section, we summarise the available information on registration and turnout rates in the
most recent municipal elections prior to 2019, and in the 2009 and 2014 European Parliament
elections.
As the literature has widely debated, European Parliament elections are not quite comparable
with municipal (and national) ones for several theoretical reasons. 25 We know from academic
literature that turnout levels vary substantially according to the type of election, and normally
European countries show higher turnout rates in national elections rather than in local and
European elections. 26 Although both local and municipal elections are considered to be
‘second-order’ to national contests, local elections generally have higher levels of turnout than
European Parliament ones. 27 The 2019 European Parliament election was the first ever to
record an increase in the average turnout rate compared with the preceding one. 28
Despite this empirical limitation, investigation of EU citizens’ registration and turnout rates is
crucial. In fact, as shown by Gaus and Seubert, ‘low turnout is related to social inequality of
voting. Socially weak EU-citizens are overrepresented in the group of non-voters’. 29 Whilst
the lack of individual-level data in the present study means that our focus is primarily on
analysing turnout comparatively rather than on engaging in causal investigation, it is worth
bearing in mind that the under-representation of mobile EU citizens is potentially a
democratic problem if their interests and concerns differ from those of other voters.
4.1 Municipal elections 2014-18
As noted above, the data have been combined from numerous official sources and represent
the best estimates available. The number of EU citizens of voting age (from which
registration rates are calculated) is estimated from Eurostat data, except in a few cases where
other figures are verifiably more accurate. 30
Table 2 shows headline registration rates for the most recent municipal elections in each EU
country prior to 2019. It is arranged in order of registration rates, as a proportion of those
eligible.
In the countries with automatic registration, registration is at or close to 100 per cent of the
eligible population of mobile EU voters. This is in sharp contrast to countries where
registration is voluntary, where the highest registration rate (in Spain) is only 26 per cent.
Registration rates are particularly low in the Czech Republic (where only 2 per cent of voting-
age mobile EU citizens are registered to vote), Bulgaria, Poland and Greece. Bulgaria also
has the smallest cohort of EU citizens on the electoral register, with only 414 individuals
across the entire country able to vote in its 2015 local elections.
Unfortunately, we cannot follow the behaviour of all 14.3 million mobile EU citizens in
municipal elections, since some of the countries for which detailed data on mobile EU
registration figures are lacking are also those with some of the largest populations of non-
native mobile EU citizens (particularly Germany and the UK). But focusing on the 21
countries for which registration data are available, the official figures allow us to find
electoral registrations in their countries of residence for 2.2 million mobile EU citizens, out of
around 6.8 million who could potentially be eligible in these countries.
16Table 2: Registration rates amongst mobile EU citizens, most recent municipal elections
(2014-18)
Estimated mobile EU Registered EU Registered as % of mobile EU
Country population of voting age voters voting age population
LV Latvia 5,386 15,053 279.5%
HU Hungary 74,184 108,994 146.9%
SI Slovenia 17,579 20,510 116.7%
FI Finland 81,051 81,051 100.0%
MT Malta 14,021 14,021 100.0%
RO Romania 40,846 40,846 100.0%
SE Sweden 535,857 535,857* 100.0%
SK Slovakia 67,768 67,768* 100.0%
LT Lithuania 4,870 4,524 92.9%
DK Denmark*** 173,480 157,879 91.0%
ES Spain 1,703,466 442,127 26.0%
FR France 1,250,364 278,000 22.2%
CY Cyprus 92,962 16,740 18.0%
BE Belgium 748,267 130,559 17.4%
LU Luxembourg 192,603 31,288 16.2%
IT Italy** 1,246,321 182,337 14.6%
PT Portugal 106,819 12,992 12.2%
EL Greece 163,855 19,102 11.7%
PL Poland 27,464 1,845 6.7%
BG Bulgaria 11,779 414 3.5%
CZ Czech Republic 202,222 4,038 2.0%
AT Austria 542,968 - -
DE Germany 3,484,779 - -
EE Estonia 14,944 - -
HR Croatia 13,760 - -
IE Ireland 342,722 - -
NL Netherlands 420,842 - -
UK United Kingdom 2,921,319 - -
Source: Multiple official sources 31
Notes:
*Figures refer to all non-national electorate, not just EU voters
**Figures for Italy reflect registration details from 2016 – not a particular municipal election
***Figures for Denmark are for 91 out of 98 municipalities.
17Table 3: Electoral weight of mobile EU voters (registered and potential), municipal
elections 2014-18
Difference: EU citizens’
Total EU citizens as proportion of population
population % of Registered EU >18 years and of
>18 years population >18 voters as % of registered electorate (as
Country (millions) years all voters % of pop.)
LU Luxembourg 0.5 40.6% 10.97% -29.6%
CY Cyprus 0.7 13.7% - -
IE Ireland 3.5 9.9% - -
BE Belgium 9.1 8.2% 1.60% -6.6%
AT Austria 7.4 7.3% - -
SE Sweden* 8.0 6.7% 7.15% 0.4%
UK United Kingdom 51.9 5.6% - -
DE Germany 69.0 5.1% - -
ES Spain 38.1 4.5% 1.26% -3.2%
MT Malta 0.4 3.9% 7.09% 3.2%
DK Denmark 4.6 3.8% 3.47% -0.3%
NL Netherlands 13.8 3.1% - -
IT Italy** 50.7 2.5% - -
FR France 51.4 2.4% 0.61% -1.8%
CZ Czech Republic 8.7 2.3% 0.05% -2.3%
HU Hungary 3.5 2.1% 1.33% -0.8%
FI Finland 4.4 1.8% 1.85% 0.0%
EL Greece 9.0 1.8% 0.19% -1.6%
SK Slovakia* 4.4 1.5% 1.51% 0.0%
EE Estonia 1.1 1.4% - -
PT Portugal 8.5 1.3% 0.14% -1.1%
SI Slovenia 1.7 1.0% 1.21% 0.2%
HR Croatia 3.4 0.4% - -
LV Latvia 1.6 0.3% 1.04% 0.7%
RO Romania 16.0 0.3% 0.22% 0.0%
LT Lithuania 2.4 0.2% 0.23% 0.0%
BG Bulgaria 6.0 0.2% 0.01% -0.2%
PL Poland 31.1 0.1% 0.01% -0.1%
Sources/key: as table 2
What is the ‘electoral weight’ of mobile EU citizens in each country? Table 3 – arranged in
order of the voting-age mobile EU population – casts light on this. Looking at the registered
voters of all types, mobile EU citizens have least influence in Poland, Bulgaria, the Czech
Republic, Portugal and Greece, where they accounted for less than 0.2 per cent of all people
on the electoral rolls in the most recent municipal elections prior to 2019. At the other end of
the scale, Luxembourg not unexpectedly has the highest proportion of mobile EU citizens
amongst its electorate, accounting for around 11 per cent of all registered voters, followed by
Sweden, Malta and Denmark, where they comprised 3 to 7 per cent of the registered
electorate. 32
18The number of mobile EU voters can be compared with population statistics to indicate in
which countries they are over- and under-represented in the electoral process. In a few
countries – Hungary, Romania, Denmark, Slovakia, Finland, Sweden, Lithuania and Slovenia
– the proportion of mobile EU voters as a share of the electorate is approximately in line with
their share of the population, with some small variations. At the other end of the scale,
mobile EU voters are statistically under-weighted in the countries with very low registration
rates such as the Bulgaria and Poland (which have relatively few mobile EU citizens in the
first place) and the Czech Republic, Greece and Portugal (which have more resident EU
citizens but relatively few who are registered to vote). Of particular interest are the states
with relatively large foreign populations, but fairly low registration rates – which means that
the interests of the mobile EU voters are particularly under-represented in determining
municipal affairs. In Luxembourg, the combination of a 5-year residence restriction (see
section 4.1.2 below) and low rates of voluntary registration mean that mobile EU voters, even
though they comprise 11 per cent of the registered electorate, are still substantially under-
represented compared with the 40 per cent of the population that they comprise. A similar
situation exists in Belgium, where mobile EU citizens are 8.6 per cent of the population but
only 1.6 per cent of the electorate, underweighting them by a factor of five. In France, mobile
EU citizens comprise 2.4 per cent of the population but only 0.6 per cent of the electorate.
Table 4: Turnout rates of EU mobile voters, municipal elections 2014-18
Overall election
Registered EU EU Turnout as % of Turnout as %
Countries turnout (all
voters turnout EU registered of EU eligible
voters)
CY Cyprus 16,740 10,977 65.6% 11.8% -
DK Denmark 157,879 41,295 26.2% 23.8% 70.8%
FI Finland 81,051 14,252 17.6% 17.6% 58.9%
PL Poland 1,845 1,381 74.9% 5.0% 55.2%
RO Romania 40,846 1,713 4.2% 4.2% 48.2%
Sources: Multiple official sources
Data on actual turnout rates (as opposed to registration rates) are less common, for the reasons
outlined in section 2. Table 4 presents the turnout figures for a selection of countries where
turnout by citizenship is recorded separately. Where registration is voluntary and requires
bureaucratic hurdles to be overcome, the majority of voters who enter the electoral roll then
go on to vote. In the three countries in table 4 that have automatic registration, the turnout
rates amongst registered voters are much lower.
To take account of the different methods of registration and the self-selection involved, the
registration rate relative to the voting-age population of mobile citizens can be used as a
comparable indicator. Table 4 shows that the overall turnout rates as a proportion of those
who could potentially have voted were higher in Denmark and Finland (which had automatic
registration) than in Cyprus and Malta (which had active registration) – but that the reverse
was true in Romania. Registration is clearly not the only hurdle to participation – but
complicated registration procedures can act as a ‘filter’ that removes all but the most active
members of the electorate at an early stage. Systems of automatic registration, by contrast,
are less exclusive before the election, but do not guarantee that overall participation will be
higher.
194.2 European Parliament elections 2009 and 2014
Table 5 shows the registration rates of mobile EU citizens in the European Parliament
elections of 2009 and 2014. For each election, the figures show the estimated number of
mobile EU citizens of voting age; the best estimate (from official figures) of the number of
voters from other EU states registered to vote in that country; and the relative proportion of
the total voting-age mobile EU population. As outlined in section 1, many but not all
nationalities have the option of voting either in their country of residence, or of origin. Thus
it is to be expected that registration rates will be lower in European Parliament than in
municipal elections. Moreover, in most countries, registration procedures for European
Parliament elections either involve opting-in, or, once registered, having the option to opt out
again if choosing to take up electoral rights in the country of origin.
Table 5: Registration rates, resident mobile EU citizens, European Parliament elections
2009 and 2014
2009 2014
Resident Resident Resident Resident
EU EU EU EU
citizens citizens Registration citizens citizens Registration
Country >18 years registered rate (%) >18 years registered rate (%) %
AT Austria 280,000 30,393 10.9% 431,173 33,184 7.7%
BE Belgium 592,380 66,343 11.2% 684,306 68,771 10.0%
BG Bulgaria - 115 - 26,590 55 0.2%
CY Cyprus 77,697 6,449 8.3% 112,012 7,712 6.9%
CZ Cz. Republic 139,192 696 0.5% 164,644 689 0.4%
DE Germany 2,142,810 141,425 6.6% 3,168,638 172,110 5.4%
DK Denmark 97,919 16,744 17.1% 130,631 15,940 12.2%
EE Estonia 8,649 951 11.0% 20,130 1,191 5.9%
EL Greece 114,377 6,519 5.7% 140,520 13,098 9.3%
ES Spain 1,970,778 284,443 14.4% 2,119,647 337,748 15.9%
FI Finland 45,536 6,211 13.6% 71,120 7,333 10.3%
FR France 1,156,209 223,148 19.3% 1,406,700 245,063 17.4%
HR Croatia - - - 5,293 8 0.2%
HU Hungary 105,648 5,542 5.2% 104,822 1,619 1.5%
IE Ireland 303,865 73,216 24.1% 323,460 71,735 22.2%
IT Italy - 65,904 - 1,287,200 - 0.0%
LT Lithuania 3,278 354 10.8% 3,993 278 7.0%
LU Luxembourg 107,691 17,340 16.1% 168,984 21,650 12.8%
LV Latvia 8,577 249 2.9% 8,967 326 3.6%
MT Malta 19,504 2,087 10.7% 45,917 7,868 17.1%
NL Netherlands 241,495 - - 380,600 48,169 12.7%
PL Poland 14,003 364 2.6% 24,495 0.0%
PT Portugal 84,727 10,930 12.9% 100,597 8,981 8.9%
RO Romania 28,273 84 0.3% 36,293 592 1.6%
SE Sweden 221,237 48,413 21.9% 248,066 49,092 19.8%
SI Slovenia 1,426 83 5.8% 18,806 668 3.6%
SK Slovakia 6,871 591 8.6% 55,900 33 0.1%
UK United K’dom 1,043,629 - - 1,921,000 160,000 8.3%
Source: Multiple official sources (see table 2 for notes)
20Having said that, there are a number of pertinent observations to be made about the figures in
table 5. First, registration rates are universally low and even more so than in municipal
elections. Second, registration rates were generally slightly lower in 2014 than in 2009 –
contrary to the expectation that participation might increase over time as people become more
aware of their rights and European Parliament elections gain in profile. The highest mobile
EU voter registration rate was in Ireland on both occasions, where the registration rate was
around 22 to 24 per cent of those eligible. In other words, three out of four mobile EU voters
were not registered to vote even in the country with the highest registration rate, and in the
majority of countries fewer than one in ten mobile EU citizens was registered to vote. This is
illustrated graphically in figure 1.
Figure 1: Registration rates amongst mobile EU citizens (% of voting-age mobile EU
citizens resident in country), European Parliament elections, 2009 and 2014
Sources: Authors’ calculations based on multiple official sources (as table 5)
In the new Member States, registration of resident EU citizens is so low as to be almost
insignificant. Croatia, Slovakia and Bulgaria, for instance, had only 8, 33 and 55 resident
mobile EU citizens on their electoral registers across the entire countries in the 2014
European Parliament elections. 33 In several of the other new Member States – most notably
Lithuania, Latvia, Romania and the Czech Republic – only a few hundred mobile EU citizens
were registered to vote. Admittedly the new Member States generally have fewer mobile EU
citizens in the first place – but these seven countries had around 300,000 resident mobile EU
citizens of voting age among them, indicating a particularly low level of engagement in EP
elections amongst their resident mobile EU citizens.
21The registration rates amongst resident mobile EU voters present only part of the story of
mobile EU voters in European Parliament elections. As noted above, in 23 of the 28 states it is
possible to choose to vote as an external voter relative to one’s country of citizenship, rather
than as an EU citizen in the country of residence. (In the 2009 European Parliament election
in Romania, for example, there were only 56 Community voters registered, but 89,373
Romanians indicated an intention to vote in other EU states. 34)
There are limits on how easy it is to establish participation rates for such external citizens,
however. Many countries’ records of their own external citizens are patchy. Some countries
(most notably Romania and Estonia) use the total number of votes cast abroad as the only
record of the number of external electors, giving an official turnout of 100 per cent among
them. Since it seems highly unlikely that this represents the sum total of all external citizens,
it only makes sense to examine turnout rates by external citizens only for countries that use
the number of registered non-resident citizens (rather than votes cast) as their starting points.
Table 6 shows turnout rates among external citizens for a selection of such countries,
indicating that around 4-11 per cent of external mobile EU voters cast ballots from their
countries of residence back to their countries of citizenship in 2014.
Table 6: Turnout rates, non-resident citizens (mobile EU voters), European Parliament
election 2014
Country Registered external voters (N) Turnout (N) % turnout
FI Finland 222,216 9,614 4.3%
FR France 1,063,607 117,422 11.0%
IT Italy 1,406,291 83,254 5.9%
PT Portugal 244,986 5,129 2.1%
SI Slovenia 70,170 7,183 10.2%
Source: as table 5
Another way of measuring the participation of non-resident citizens is by comparing the data
from national electoral commission notifications about double-registered voters.
Theoretically, the country of origin is supposed to delete the voter from their electoral register
when notified by the country of residence that an EU citizen has been registered in their
country of residence. In total, around 600,000 such notifications were made in 2014 across
the EU28 – but the success of the cross-referencing was extremely patchy, with less than half
able to be identified by their home country’s national authorities, and many exchanges of data
that were incomplete or too late. 35
225 Key country studies
The headline figures presented in section 3 give a useful comparative overview of the turnout
of mobile EU citizens across Europe, but they do not allow us to investigate what factors
correlate with lower or higher turnout. For example, does it make a difference what
nationalities the mobile EU voters hold? Are there any gender differences in turnout patterns?
Does it matter how long the EU citizens have lived in the country?
The data on these issues is very patchy at a pan-European level, as noted in section 2. Only in
a few states is it possible to obtain more detailed information that allows us to analyse
differences by age, gender, nationality, time of residence in the country, etc. These data are
not equally comprehensive for each state, nor are they prepared with the same methodologies
or categories. Taken on a case-by-case basis and cross-referenced, however, they expand our
understanding of the political participation of mobile EU citizens in European Parliament and
municipal elections.
This section examines in more detail the available data on registration and turnout in several
key states that represent different parts of the EU. First, we examine two of the original EU
states – Belgium and Luxembourg – that have detailed registration data and also feature
compulsory voting. Second, some of the other ‘old’ Member States are examined, including
Spain and the Nordic countries, where the combination of official data and survey research
allows a uniquely detailed examination of participation amongst mobile EU citizens. Finally,
a selection of new Member States – where participation rates of mobile EU citizens are
generally very low – are analysed.
5.1 Selected old Member States
5.1.1 Belgium
Belgium is a very interesting case to investigate for several reasons – not just because it is the
main location of the EU institutions and was one of the founder Member States.
First of all, registration for mobile EU non-Belgian citizens is not automatic but completely
voluntary, and it has to be done at the municipality of residence. Voters register only once –
and then they remain registered for all upcoming elections, unless they decide to de-register.
Because of the compulsory voting requirement, voters are compelled to vote once
registered. 36 The combination of voluntary (and complicated) registration, combined with the
compulsion to vote thereafter, means that registration can be in practice be assumed to
approximate to actual turnout.
Second, Belgium collects the registration data by municipality and makes them publicly
available. Thus, it is a privileged case study to understand patterns of EU citizen’s
participation in municipal and European elections.
In the analysis below, we will focus on the two most recent municipal elections, held
respectively in 2012 and in 2018, and on the 2014 European election. In particular, given that
Belgium is a federal country composed of three regions (characterized also by a language
divide that further divides the country into linguistic communities), 37 we will pay special
attention to regional differences in patterns of participation. These regions – Brussels (dark
blue), Flanders (grey-blue) and Wallonia (light blue) – are shown in figure 2, together with
the internal provincial boundaries.
23You can also read