Ultra-processed food and drink products in Latin America: Trends, impact on obesity, policy implications - IRIS PAHO
←
→
Page content transcription
If your browser does not render page correctly, please read the page content below
Ultra-processed food and drink products in
Latin America: Trends, impact on obesity,
policy implications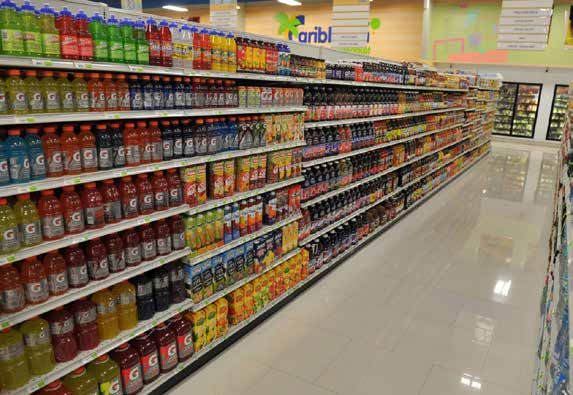
Ultra-processed food and drink products
in Latin America: Trends, impact on obesity,
             policy implications

       Noncommunicable Diseases and Mental Health

                  Washington D.C., 2015
Also published in Spanish (2015) with the title:
             Alimentos y bebidas ultraprocesados en América Latina: tendencias,
              efecto sobre la obesidad e implicaciones para las políticas públicas
                                     978-92-75-31864-5

PAHO HQ Library Cataloguing-in-Publication Data
***************************************************************************
Pan American Health Organization.

Ultra-processed food and drink products in Latin America: Trends, impact on obesity,
policy implications. Washington, DC : PAHO, 2015.

1. Obesity – prevention & control. 2. Public Policies. 3. Food Consumption.
4. Fast Foods – adverse effects. 5. Latin America. I. Title.

ISBN 978-92-75-11864-1                                   (NLM Classification: WD210)

The Pan American Health Organization welcomes requests for permission to reproduce or
translate its publications, in part or in full. Applications and inquiries should be addressed to
the Communication Unit (CMU), Pan American Health Organization, Washington, D.C., U.S.A.
(www.paho.org/publications/copyright-forms). The Department of Noncommunicable Diseas-
es and Mental Health, Unit of Risk Factors, (ncdbulletin@paho.org) will be glad to provide the
latest information on any changes made to the text, plans for new editions, and reprints and
translations already available.

                © Pan American Health Organization, 2015. All rights reserved.

        Publications of the Pan American Health Organization enjoy copyright protection in
accordance with the provisions of Protocol 2 of the Universal Copyright Convention. All rights
are reserved.
         The designations employed and the presentation of the material in this publication do
not imply the expression of any opinion whatsoever on the part of the Secretariat of the Pan
American Health Organization concerning the status of any country, territory, city or area or of
its authorities, or concerning the delimitation of its frontiers or boundaries.
        The mention of specific companies or of certain manufacturers’ products does not
imply that they are endorsed or recommended by the Pan American Health Organization in
preference to others of a similar nature that are not mentioned. Errors and omissions except-
ed, the names of proprietary products are distinguished by initial capital letters.
All reasonable precautions have been taken by the Pan American Health Organization to verify
the information contained in this publication. However, the published material is being dis-
tributed without warranty of any kind, either expressed or implied. The responsibility for the
interpretation and use of the material lies with the reader. In no event shall the Pan American
Health Organization be liable for damages arising from its use.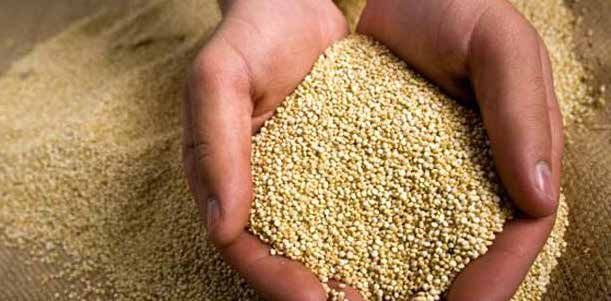
This Report was commissioned by the Pan American Health Organization
and prepared by Dr. Jean-Claude Moubarac of TRANSNUT, the WHO
Collaborating Centre on Nutrition Changes and Development at Université
de Montréal, Canada, and the Núcleo de Pesquisas Epidemiológicas em
Nutrição e Saúde (NUPENS) at Universidade de São Paulo, Brazil.

Advice and comments were received from Prof. Roberto De Vogli
(University of California–Davis, United States); Prof. Carlos Augusto
Monteiro (Universidade de São Paulo–São Paulo, Brazil); and Geoffrey
Cannon (NUPENS–São Paulo, Brazil). Maria Laura Louzada, Logan Mauney,
and Dr. Diana Parra Perez from NUPENS are also gratefully acknowledged.

                                                                          iii

Contents

Foreword�������������������������������������������������������������������������������������������������������������������� vii
Summary����������������������������������������������������������������������������������������������������������������������ix
Introduction����������������������������������������������������������������������������������������������������������������xi
1. What are ultra-processed products?�������������������������������������������������������� 1
   1.1. The NOVA food classification system������������������������������������������������ 1
   1.2. Problems with ultra-processed products����������������������������������������� 6
   1.3. Impact on nutrition, health, and well-being����������������������������������� 9
2. Methodology������������������������������������������������������������������������������������������������������ 11
3. Ultra-processed products sales����������������������������������������������������������������� 14
    3.1. Global trends��������������������������������������������������������������������������������������������� 14
    3.2. Retail sales in Latin America���������������������������������������������������������������� 19
    3.3. Fast-food purchases�������������������������������������������������������������������������������� 22
    3.4. Distribution������������������������������������������������������������������������������������������������� 24
    3.5. Market concentration���������������������������������������������������������������������������� 26
    3.6. Summary����������������������������������������������������������������������������������������������������� 30
4. Social and economic drivers����������������������������������������������������������������������� 31
    4.1. Urbanization���������������������������������������������������������������������������������������������� 32
    4.2. Increased income������������������������������������������������������������������������������������ 34
    4.3. Market deregulation������������������������������������������������������������������������������ 36
    4.4. Changes in retail sector������������������������������������������������������������������������� 37
    4.5. Marketing���������������������������������������������������������������������������������������������������� 39
    4.6. Summary����������������������������������������������������������������������������������������������������� 40
5. Impact on obesity��������������������������������������������������������������������������������������������� 41
6. Discussion and recommendations����������������������������������������������������������� 45
   6.1. Main findings��������������������������������������������������������������������������������������������� 45
   6.2. Study limitations�������������������������������������������������������������������������������������� 47
   6.3. Recommendations���������������������������������������������������������������������������������� 49
   6.4. Conclusion�������������������������������������������������������������������������������������������������� 51
References����������������������������������������������������������������������������������������������������������������� 53
Annex A: The NOVA food classification system�������������������������������������� 59
Annex B: Countries included in this report (n = 80) by region.������� 60

                                                                                                                                    v

Foreword

The increasing burden of ill health and premature deaths attributable
to chronic non-communicable diseases (NCDs), particularly affects low
and middle income countries and the key underlying but modifiable risk
factors are tobacco, harmful use of alcohol, physical inactivity and low
quality diet. Poor nutrition is a major cause of illness and mortality as
documented in the Global Burden of Disease Study 2010, with nutritional
factors now being a major contributor to years of life lost and years lived
with disease in the Americas.

This report is timely and provides an up-to-date comprehensive
perspective on global shifts in sales of ultra-processed food and drink
products over the past decade, while exploring the connection between
the surge in market share and the epidemic of obesity in Latin America. It
examines trends in sales of ultra-processed products, their distribution in
supermarkets and retail outlets, and market concentration. The report also
examines how sales are associated with socioeconomic drivers including
patterns of urbanization, income growth and market deregulation. While
sales volumes remain higher in high-income countries, the rate of growth
was faster in lower-income countries during the period 2000 to 2013.
Consistent with previous findings, sales of ultra-processed products are
associated with weight gain and obesity in Latin America. The solutions
to this epidemic of unhealthy diets can be found in sound public policies
and this monograph provides clear guidance on the way forward.

Anselm Hennis
Director
Department of Noncommunicable Diseases and Mental Health

                                                                              vii

Summary

Commercially, the most attractive markets for ultra-processed food and
drink products are no longer the fully industrialized high-income countries
of the Global North (North America, Western Europe, and developed
parts of East Asia). They are the middle-and low-income countries of the
Global South (Africa, economically developing countries in Asia, Eastern
Europe, and Latin America).

This study has analyzed sales of ultra-processed products from retail stores
(“off trade” purchases) and fast-food outlets (“on-trade” purchases) in
13 countries in Latin America between 2000 and 2013. Both retail sales
and fast-food transactions increased steadily in all 13 countries except
Argentina and Venezuela, where sales fluctuated during financial crises.
In Latin America, most ultra-processed products are increasingly sold
in convenience stores, supermarkets, and hypermarkets (“superstores”
or combination supermarket/department stores). Market of several
leading ultra-processed products is oligopolistic and often dominated by
transnational corporations.

Sales of ultra-processed products increase with urbanization, and when
national governments open their countries to foreign investment and
deregulate markets. While sales volume remains higher in high-income
countries, the rate of growth was faster in lower-income countries during
2000-2013. Lastly, consistent with previous findings, sales of ultra-
processed products are associated with weight gain and obesity in Latin
America.

As stated in the Pan American Health Organization five-year Plan of
Action on childhood obesity (2014–2019), to support and encourage
health dietary patterns, the strong increase in sales of ultra-processed
products throughout the Americas needs to be checked by statutory
regulations and the development of market opportunities to protect
and strengthen local and national healthy food systems and thus healthy
dietary patterns.

                                                                               ix
© Pan American Health Organization
xIntroduction
Obesity and related chronic noncommunicable diseases (NCDs) are
now epidemic throughout Latin America, among adults as well as
children and adolescents (1,2). In response, in October 2014, Pan
American Health Organization (PAHO) Member States approved a
five-year Plan of Action on childhood obesity (2014–2019) designed
to halt further increase of obesity in children and adolescents in the
region (3).
PAHO identifies the current environment as one that causes overweight
and obesity. It emphasizes the central importance of diet as well as trade
and agriculture policies in determining the quality of food supplies and
thus of dietary patterns. Its recommendations include fiscal policies and
other incentives for increased production and consumption of healthy
food; the regulation of marketing of unhealthy food; better labeling of
processed food and drink products; and improvement of school food and
increased physical activity among schoolchildren. The recommendations
build on public policies already initiated in Latin America, such as the
Mexican tax on sugary drinks and energy-dense snacks; regulation of
food marketing to children in several countries; and the Brazilian food-
and meal-based dietary guidelines (4). PAHO also emphasizes the need
for more government interventions to set, achieve, and monitor specific,
quantifiable targets.
The most effective policies and actions designed to improve the quality
of food supplies to reduce the incidence of overweight and obesity,
include the use of public regulations and market interventions (5). For
example, the efficacy of price, availability, and other statutory controls
on use of tobacco is well-documented (6). However, recent attempts to
use mandatory regulations to improve food supplies have been impeded
by misinformation and biased science, along with pressure from
commercially interested parties (7). Policies and actions to improve food
systems for healthier diets need strong political commitment, combined
with determined and sustained support from citizens—as voters and
parents—and leadership from civil society organizations and social
movements at all levels (national, state, and municipal).
xiPublic policies, recommendations and actions concerning nutrition and
health have conventionally been based on nutrients (for example, sodium
and saturated fats) or on types of foods (for example, fruits and vegetables,
and red meat). These methods of approaching and categorizing diets are
inadequate and misleading because they are based on a narrow vision
of nutrition (in which food are seen as the mere sum of nutrients), and
neglect the role of modern industrial food processing and its impact on
diet (8). Industrial food processing is now the main driving force shaping
what has become a global food system, as especially now affecting now
middle-and low-income countries (9).
The most striking change in food systems of high-income countries, and now
of low- and middle-income countries, is displacement of dietary patterns
based on meals and dishes prepared from unprocessed or minimally
processed foods by those that are increasingly based on ultra-processed
food and drink products (10–13). The result is diets with excessive energy
density, high in free sugars and unhealthy fats and salt, and low in dietary
fiber (14–15) that increase the risk of obesity and other diet-related NCDs
(16–19). The proportion of ultra-processed products in food supplies can
be seen as a measure of overall population diet quality (20).
More information on the manufacture, sale, and consumption of
ultra-processed products in specific countries that can be compared
internationally is needed in Latin America. Governments will then be able
to formulate, agree on, implement, and monitor policies and programs to
encourage healthy dietary patterns whose quality is strongly supported by
the evidence and directly relevant to the local context.
To help fill the information gap, this study analyzed sales of ultra-processed
products from retail stores (“off trade” purchases) and fast-food outlets
(“on-trade” purchases) in 13 countries in Latin America between 2000
and 2013. The resulting analyses and recommendations reported here
are based on the NOVA conceptual framework for classifying food (21)
devised by a research team at the University of São Paulo in Brazil. The
NOVA system classifies foods and diets according to the nature, purpose,
and extent of industrial food processing rather than in terms of nutrients
and food types.
The leading international scientific work based on the NOVA system has
come from Latin America and Canada (8–11, 13–16). Assessments of the
relationship between patterns of diet and patterns of obesity and related
xiidiseases need to consider the significance of industrial food processing,
with specific attention to ultra-processed products. This approach was
used in a briefing document supporting the PAHO Plan of Action (22) and is
set out in guidelines issued by the Food and Agriculture Organization of the
United Nations (FAO) (23). It is also the basis of national dietary guidelines
issued by the Brazilian Ministry of Health in November 2014 (4).
Scope of this report
This report describes trends in the sales of ultra-processed food and drink
products in 13 Latin American countries (Argentina, Bolivia, Brazil, Chile,
Colombia, Costa Rica, Dominican Republic, Ecuador, Guatemala, Mexico,
Peru, Uruguay, and Venezuela) as well as the social and economic factors
that drive them and associated implications for the rise, control, and
prevention of obesity and related diseases.
Chapter 1 (“What are ultra-processed products?”) provides a brief
summary of the NOVA food classification system (21) plus an overview of
ultra-processed food and drink products, their characteristics, and their
impact on human health. Chapter 2 describes the methodology used in
this report, including data sources and analysis.
Chapter 3 compares trends in sales of ultra-processed products in Latin
America with those in other regions of the world, and examines retail
sales of ultra-processed products and fast-food transactions (number of
single, completed purchases) in the 13 Latin American countries studied
as well as their distribution and market concentration.
Chapter 4 provides evidence from throughout the world on the correlation
of the sale of ultra-processed products with urbanization, economic
growth, and market deregulation, and briefly describes changes in the
retail sector in the Americas.
Chapter 5 compares changes over time in sales of ultra-processed
products with changes over time in body mass in 12 of the 13 Latin
American countries (all but Argentina). Chapter 6 describes policies and
actions that could help improve food supplies and dietary patterns to
protect health throughout Latin America.
Annex A provides details about the NOVA food classification system.
Annex B lists the countries covered in this report by region.
xiii© freeimages.com xiv Ultra-processed food and drink products in Latin America: Trends, impact on obesity, policy implications.
Chapter 1

What are ultra-
processed products?
Practically all food consumed today is processed in some way. If
processing is defined as methods in which raw food is made more edible
and enjoyable, or preserved for later use, food has been processed
throughout human history. Food processing has played a central role in
human evolution and adaptation in its contribution to securing adequate
nourishing food supplies and thus the development of societies and
civilizations, the protection of health and well-being, and the achievement
of social and emotional well-being through the sharing of meals (24,25).

Since industrialization, and particularly in the second half of the last
century, food processing has developed very rapidly and been profoundly
transformed through food science and other types of technology (26).
This transformation suggests the need for rigorous examination of the
impact of all forms of food processing on food systems and supplies;
dietary patterns; and nutrition, health, and well-being.

1.1 The NOVA food classification system

Food is not healthy or unhealthy simply because it is “processed.”
Meaningful discussion of food processing requires the use of specific
terminology with clear definitions that apply universally. Many types
of processing are essential, beneficial or harmless. Other types of food
processing are harmful in terms of human health and in other ways. A
proper understanding of the significance of food processing depends
on and can be derived from a classification of food supplies and dietary
patterns that distinguishes between types and uses of processing.

                                                                              Chapter 1   1
This report is based on the NOVA food classification system. The NOVA
system groups food according to the nature, purpose, and extent of its
processing (21,27). It has four groups, specified below and in more detail
in Annex A:
1. Unprocessed or minimally processed foods
2. Processed culinary ingredients
3. Processed foods
4. Ultra-processed food and drink products
The NOVA system enables the study of food supplies and dietary patterns
as a whole, within countries over time and between countries. It also
enables the study of individual food groups within the system.
Unprocessed or minimally processed foods
Unprocessed foods are parts of plants or animals that have not undergone
any industrial processing. Minimally processed foods are unprocessed
foods altered in ways that do not add or introduce any new substance (such
as fats, sugars, and salt) but may involve the removal of parts of the food.
They include fresh, dry, or frozen fruits, vegetables, grains and legumes,
nuts, meats, seafood, eggs, and milk. Minimal processing techniques
extend the food’s duration, aid its use and preparation, and improve its
palatability.
Unprocessed or minimally processed foods, including fresh, dry, or frozen fruits, vegetables, grains,
legumes, nuts, meats, seafood, eggs, and milk, are the basis of healthy dishes and meals.
2 Ultra-processed food and drink products in Latin America: Trends, impact on obesity, policy implications.Processed culinary ingredients
Culinary ingredients are substances extracted and purified by industry
from food constituents or obtained from nature (such as fats, oils, salt
and sugars). These substances are normally not consumed by themselves.
They are mainly used to prepare foods and to make palatable, diverse,
nourishing and enjoyable dishes and meals, which typically are shared
with others.
Processed culinary ingredients include fats, oils, salt, and sugars. They are used to prepare
foods, and to make palatable, diverse, nourishing and enjoyable dishes and meals.
Processed foods
Processed foods are manufactured by adding fats, oils, sugars, salt, and
other culinary ingredients to minimally processed foods to make them
more durable and usually more palatable. These types of foods include
simple breads and cheeses; salted and cured meats, and seafood; and
preserved fruits, legumes, and vegetables.
Processed foods include simple breads and cheeses; salted and cured meats and seafood; and
fruits, legumes, and vegetables preserved in brine, syrup, or oil. Depending on how they are
prepared and used in meals and dishes, these foods can be part of healthy diets.
Chapter 1 3Unprocessed or minimally processed foods prepared with processed
culinary ingredients, and sometimes combined with processed foods,
result in handmade dishes. When such dishes are made from a variety of
minimally processed foods, mostly of plant origin, and with moderate use
of culinary ingredients, the meals and diets they comprise protect health
and promote well-being (4,28–30). The new Brazilian dietary guidelines
(based on the NOVA food classification system) (4) and the proposed 2015
U.S. dietary guidelines (29) recommend mostly plant-based diets based on
minimally processed foods.
Handmade dishes combining unprocessed or minimally processed foods prepared with culinary
ingredients and combined with some processed foods are the basis of healthy meals.
4 Ultra-processed food and drink products in Latin America: Trends, impact on obesity, policy implications.Ultra-processed products
Ultra-processed food and drink products are industrial formulations
manufactured from substances derived from foods or synthesized from
other organic sources. In their current forms, they are inventions of
modern industrial food science and technology. Most of these products
contain little or no whole food. They are ready-to-consume or ready-to
heat, and thus require little or no culinary preparation.
Some substances used to make ultra-processed products, such as fats,
oils, starches, and sugar, are directly derived from foods. Others are
obtained through the further processing of food constituents, such as
hydrogenation of oils (which generates toxic trans fats), hydrolysis of
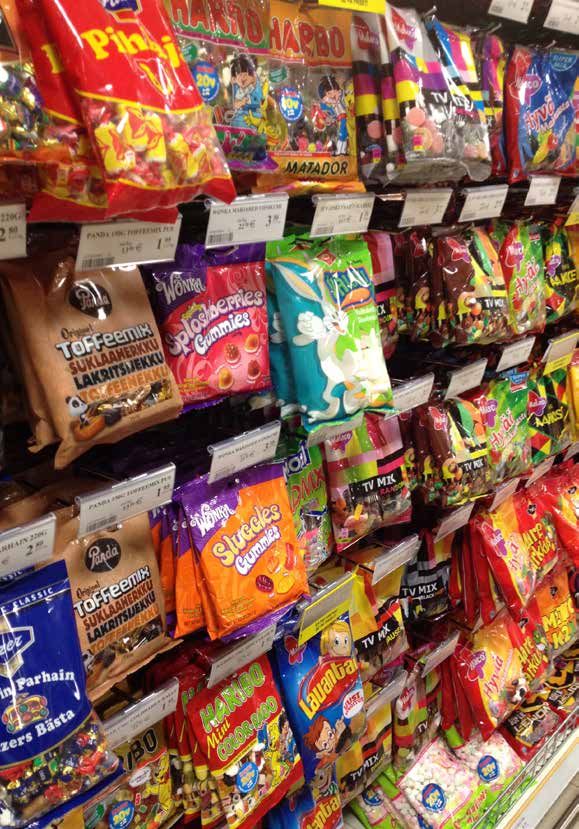
© freeimages.com
Most products sold in supermarkets, especially in central aisles and at the end of aisles, are
ultra-processed, along with most products in convenience stores and fast-food outlets.
Chapter 1 5proteins, and “purification” of starches. Numerically, the great majority
of ingredients in most ultra-processed products are additives (binders,
bulkers, colors, emulsifiers, flavors, preservatives, sensory enhancers,
solvents, stabilizers, and sweeteners). Ultra-processed products are often
bulked with air or water. Synthetic micronutrients may be added to “fortify”
them.
Examples of ultra-processed products (described in more detail in Annex A)
include chips (crisps) and many other types of fatty, salty, or sweet packaged
snack products; ice-cream, chocolate, and candies (confectionery);
packaged breads, buns, cookies (biscuits), pastries, and cakes; sweetened
breakfast cereals; energy bars; preserves; margarines; carbonated drinks
and energy drinks; sugar-sweetened milk drinks, including fruit yogurt
drinks; fruit and fruit nectar drinks; cocoa drinks; infant formulas, follow-
on milks, and other baby products; and “health,” and “slimming” products
such as powdered or “fortified” meal and dish substitutes. Ultra-processed
ready-to-heat or ready-to-consume products are now very commonly
consumed at home or at fast-food outlets. These foods, also known as
“ready-meals”, include reconstituted and pre-prepared meat, seafood,
vegetable, or cheese dishes; pizza; burgers and hot dogs; French fries
(chips); poultry and fish nuggets or sticks (fingers); and powdered and
packaged soups, noodles, and desserts. They often appear to be much
the same as home-cooked meals or dishes, but their ingredients lists show
that they are not.
1.2 Problems with ultra-processed products
Various nutritional and metabolic characteristics of ultra-processed
products are problematic, as are their social, cultural, economic, and
environmental impacts, especially when they amount to a substantial and
increasing proportion of national food supplies and diets (21, 31). These
foods are problematic in terms of human health because they have very low
nutritional quality and are usually hyper-palatable, and sometimes even
quasi-addictive; imitative of food, and falsely seen as healthy; conducive
to snacking; aggressively advertised and marketed; and culturally, socially,
economically, and environmentally destructive.
6 Ultra-processed food and drink products in Latin America: Trends, impact on obesity, policy implications.Very low nutritional quality
Ultra-processed food and drink products are energy-dense and
nutritionally unbalanced (14–15). They are characteristically fatty, salty,
or sugary, and depleted in dietary fiber, protein, various micronutrients,
and other bioactive compounds. They are often high in saturated fats
or trans fats. They often have high glycemic loads. Their true nature is
typically disguised by sophisticated use of additives. While some of these
additives are innocuous, the safety of others, singly or in combination
with other food substances, is unknown or disputed.
Hyper-palatable and quasi-addictive
Ultra-processed products are designed to satiate food cravings, they
are often hyper-palatable and habit forming, and sometimes even
quasi-addictive (32,33). Certain characteristics (tastes, properties, etc.)
engineered into these types of products through food science and other
technologies can skew mechanisms in the digestive system and brain that
signal satiety and control appetite, and cause overconsumption (31,34).
As a result, consumption of these products can impede the ability to
control dietary habits.
© freeimages.com
Chapter 1 7Imitative of food; falsely seen as healthy
By nature, ultra-processed products are not “modified food,” or any other
version of food, but their formulations often use technologies designed to
imitate the appearance, shape, and sensory qualities of food. Therefore,
they may be molded and extruded into food-like shapes, or contain
cosmetic and other additives that imitate the sensory qualities of food,
often in an intensified form. In addition, manufacturers often create a false
impression that ultra-processed products are healthy by including pictures
of natural foods in the labeling, packaging, and promotional material and/
or advertising the addition of synthetic vitamins, minerals, and other
compounds, which allows them to imply or make health claims.
Conducive to snacking
Ultra-processed products are usually sold in the form of snacks, drinks,
or ready-to-consume/ready-to-heat dishes. Most are designed and
packaged for immediate consumption. They are available at all sorts of
food retailers, as well as many non-food venues, many of which are open
24/7, and thus can be purchased at almost any time. Typically, they can
be and are consumed almost anywhere—in catering outlets, at drive-
ins and takeaways, at home, in the workplace, or in the street. They are
convenient, storable, easily transportable, and usually require no plates or
utensils. They are often consumed while focusing on something else (e.g.,
work, driving, or watching TV). These products displace freshly prepared
foods, and dishes and meals made from them, served at home or outside
the home (e.g., in restaurants and bars).
Aggressively advertised and marketed
Ultra-processed products typically are branded products of transnational
and other corporations that buy or make the required industrial ingredients
very cheaply and operate economies of scale. They are designed to be
extremely profitable. The biggest corporations allocate huge annual
budgets (up to US$ billions) to advertising and promotion, including cross-
advertising between their brands, to make their products attractive and
often glamorous (32). As with cigarettes and alcoholic drinks, marketing
strategies often use highly charged and seductive ideas, language, and
images that undermine the desire and ability to make rational and healthy
choices, and are particularly effective when targeting children, adolescents,
and other vulnerable groups (32).
8 Ultra-processed food and drink products in Latin America: Trends, impact on obesity, policy implications.Socially and environmentally destructive
Displacement of established food supplies and dietary patterns by ultra-
processed products can also damage social and cultural fabric, and
mental and emotional health. Freshly prepared meals enjoyed with
others are part of all civilizations. Traditional cuisines have evolved as
expressions of autonomy and identity (35). Typically, they also are suited
to specific climate and terrain, and generally sustainable, and they
support local businesses, rural economies, and biodiversity (35). All of
these benefits are undermined and can, eventually, be destroyed by the
ultra-processed products produced by the global industrial food system.
1.3 Impact on nutrition, health, and well-being
Healthy diets are based on fresh and handmade meals (like the example on the left)
derived from sustainable food systems and established food cultures. Diets largely
composed of the ready-to-consume ultra-processed products of the globalized
industrial food system (like the fast-food meal on the right), are unhealthy.
The 2014 PAHO Plan of Action (3) describes the most important factors
promoting weight gain/obesity and chronic noncommunicable diseases
as follows:
Authoritative publications, particularly from the World Health
Organization (WHO), the Food and Agriculture Organization (FAO),
and the World Cancer Research Fund […] agree that the most
important factors that promote weight gain and obesity, as well as
associated noncommunicable diseases (NCDs), are: a) high intake
of products poor in nutrients and high in sugar, fat, and salt […],
such as snacks and fast foods; b) routine intake of sugar-sweetened
beverages; and c) insufficient physical activity.
Chapter 1 9These types of products—snacks, fast-food, and drinks—are almost
invariably ultra-processed and should be identified as such. Because they
are nutritionally imbalanced, energy-dense, and possess unique non-
nutritional attributes that promote overconsumption, ultra-processed
products are most likely the main dietary cause of weight gain and chronic
diseases. This is now increasingly recognized by nutrition and public health
researchers (5,9,31) and well understood (if not publicly admitted) by food
technologists and industry executives (32).
Studies that examine the impact of ultra-processed products on obesity
and chronic NCDs show consistent results. In several countries, the level of
consumption of ultra-processed products is tightly correlated with overall
diet quality (14, 15). Higher consumption of ultra-processed products
is associated with dyslipidemia in children (17), and thus higher risk for
cardiovascular disease; metabolic syndrome in adolescents (19); and adult
obesity in Brazil (16).
Evidence from the United States shows that consumption of various
ultra-processed products such as cookies (biscuits), white bread, candy
(confectionary) and desserts; sugar-sweetened drinks; processed meats;
and French fries (chips) and chips (crisps) is associated with weight gain in
adults (18). Increase in fast-food sales predicts an increase in body mass
in high-income European, North American, and other countries of the
Organization for Economic Co-operation and Development (OECD) (36).
More studies using the NOVA classification system and methodology are
needed to supplement the current findings, particularly those producing
data that can be compared across countries. However, the lack of
supplemental studies should not delay the use or dilute the significance of
the PAHO Plan of Action findings and recommendations for the Americas,
which could serve as a guide for other regions.
The basic principles of a healthy diet are now well known. Dietary patterns
based on meals made from unprocessed or minimally processed food
prepared with culinary ingredients are consistently associated with
relatively low incidence of disease, as well as good health and well-
being (4,29,30). This is a result of the nutritional quality of these foods
and ingredients as well as the emotional, mental, and social benefits of
preparing and sharing them in meals with others (24,37).
10 Ultra-processed food and drink products in Latin America: Trends, impact on obesity, policy implications.Chapter 2
Methodology
This report describes trends in sales of ultra-processed food
and drink products with a focus on Latin America. It is based
on data from the Passport Global Market Information Database
published online by Euromonitor International, an independent provider
of strategic marketing research (38). Euromonitor is an established
source of commercial data, including internationally standardized
statistics on packaged food as sold through retail outlets and on fast food
transactions.
Throughout the report, ultra-processed products are defined and
identified according to the NOVA food classification system. These include
the following product categories in the Euromonitor Passport database
and reported on here: carbonated drinks, breakfast cereals, sweet and
savory snacks, confectionery (candy), ice cream, biscuits (cookies),
fruit and vegetable juices, sports and energy drinks, spreads, sauces,
and ready-meals. The report also includes data on ultra-processed
products purchased from fast food outlets (defined as offering limited
menus prepared quickly where customers order, pay and pick up from a
counter), also obtained from Euromonitor.
In Chapter 3, trends in annual sales of ultra-processed products from
retail outlets are reported by volume (in kilotons1) and per capita
by global region (see Annex B for the list of countries studied in each
region). Trends in annual sales of ultra-processed products from retail
outlets and transactions at fast-food outlets for the 13 Latin American
countries studied are also described, and compared with data for Canada
and the United States.
Chapter 3 also includes data on ultra-processed product retail sales
described in terms of outlet distribution and company market share.
Distribution is mainly from “modern” grocery retailers (convenience
1
1 kiloton = 1000 metric tons.
Chapter 2 11stores, discounters, forecourt retailers2, hypermarkets, and supermarkets)
as opposed to “traditional” grocery retailers (small independent grocers,
specialty food sellers, and other food retailers, including those selling
other types of goods such as tobacco). Market share data were used to
calculate corporate concentration—the percentage of total sales value of
a given national market represented by the four largest companies (39).
Markets with ratios less than 50% were defined as competitive, while
those between 50% and 80% were defined as oligopolies (control by a
small number of companies), and those above 80% as highly concentrated
oligopolies. Trends in market share were estimated for 2005–2013 (the
period for which data were available). Market share data were also used to
describe the level of transnationalization, defined here as the proportion
of ultra-processed products owned by transnational corporations.
In Chapter 4, correlation analyses are used to show how ultra-processed
product sales vary according to three social and economic determinants:
urbanization, economic growth, and market deregulation. Analyses
were done in 74 of the 80 countries studied (Annex B). The following six
countries were excluded: United Arab Emirates (because of the extremely
large proportion of expatriates); Singapore and Hong Kong (because they
are city-states); and Argentina, the Philippines, and Taiwan (because of
incomplete data on social and economic factors).
Country-specific data for urbanization and economic growth were taken
from World Bank datasets (40). Urbanization was measured as the
percentage of a total population living in urban areas. Economic growth
was measured by gross national income (GNI), adjusted for purchase
power parity. The degree of market deregulation was measured using the
2009 Index of Economic Freedom created by the Heritage Foundation
in partnership with the Wall Street Journal (41). This index indicates the
extent to which a country has adopted market deregulation policies,
calculated as the mean of 10 subcomponents measuring different aspects
of economic freedom as determined from national laws and regulations
as well as assessments by experts and investors, on a scale from 1 to 100.
In Chapter 5, an ecological analysis shows the relationship between sales
of ultra-processed products and obesity prevalence in 2010 in 12 of the
Latin American countries studied (all but Argentina, because of missing
data) plus Canada and the United States. Obesity prevalence was taken
2
Areas at gas stations where snacks and other food and drinks are sold.
12 Ultra-processed food and drink products in Latin America: Trends, impact on obesity, policy implications.from the WHO 2014 Global status report on noncommunicable diseases
(2). The chapter also includes a cross-national time-series analysis in the
12 Latin American countries to test the association between changes
in annual sales per capita of ultra-processed food and drink products
(expressed in kilograms) and changes in age-standardized mean body
mass in adults (expressed as body mass index (BMI) scores), adjusting
for social and economic variables. Argentina was excluded because of
missing data on economic variables. A fixed-effect regression model
was used for the analysis, with gross national income, urban population,
and population size as covariates. Covariate data were obtained from
World Bank sources (40). BMI data were obtained from the World Health
Organization (WHO) Global Burden of Disease database (42).
© gettyimages.com
Chapter 2 13Chapter 3
Ultra-processed product sales
This chapter contains information on sales of ultra-processed products in
13 countries in Latin America from 2000 to 2013, plus some international
comparisons. It includes trends in volume and per capita retail sales, fast
food transactions, distribution, and market concentration. The information
here relates to those ultra-processed products that can be identified as
such in the Euromonitor database.
3.1 Global trends
Volume sales of ultra-processed food and drink products vary greatly
across different regions of the world. Table 1 shows sales in 2000 and 2013
in seven regions. The figures include volume sales (in kilotons), overall
growth for the period, year-to-year growth, and global market share of
sales in 2000 and 2013.
Globally, sales of ultra-processed products increased by 43.7% over the
period (from 328 055 kilotons in 2000 to 471 476 kilotons in 2013), with
important differences across regions. In 2000, volume sales of ultra-
processed products in North America (the United States and Canada)
amounted to 102 868 kilotons, representing the biggest single market in
the world, with 31.4% of global volume sales. The second biggest market
in 2000 was Asia and the Pacific (with 19.5% of global volume share),
followed by Western Europe (19.3%) and Latin America (16.3%).
14 Ultra-processed food and drink products in Latin America: Trends, impact on obesity, policy implications.Table 1
Volume, growth (%), and market share of global sales of ultra-processed food and drink products by
region, 2000 and 2013
Volume sales Growth Market share
Region (kilotons*) (%) (%)
2000 2013 2000–2013 Yearly 2000 2013
North America 102,868 105,276 2.3 0.2 31.4 22.3
Asia and the Pacific 64,076 137,687 114.9 6.1 19.5 29.2
Western Europe 63,168 74,863 18.5 1.3 19.3 15.9
Latin America 53,458 79,108 48.0 3.1 16.3 16.8
Middle East and Africa 22,275 38,182 71.4 4.2 6.8 8.1
Eastern Europe 17,789 30,835 73.3 4.3 5.4 6.5
Australasia 4,420 5,526 25.0 1.7 1.3 1.2
World 328,055 471,476 43.7 2.8 100 100
* Kiloton: one thousand tons. Ultra-processed products here include carbonated soft drinks, sweet and savory snacks, breakfast
cereals, confectionery (candy), ice cream, biscuits (cookies), fruit and vegetable juices, sports and energy drinks, ready-to-drink
tea or coffee, spreads, sauces, and ready-meals. Quantity in liters is converted into tons. Data are from the Euromonitor Passport
Database (2014) (38).
Important shifts occurred between 2000 and 2013. In North America and
Western Europe, total volume sales growth was not impressive and began
to decline in 2012. Global market share in these two regions decreased
by 9.1% and 3.4% respectively. In contrast, throughout Asia and the
Pacific, sales increased by 114.9%. In 2013, this region overtook North
America as the overall global market leader in terms of volume sales,
with 29.2% of the global market. During the same period, Latin American
sales increased by almost 50%, and maintained a steady overall global
market share of more than 16%. Volume sales during the period also
grew substantially in the Middle East and Africa and in Eastern Europe
(by 71.4% and 73.3% respectively), but from lower baselines.
Changes in the volume of sales of carbonated soft drinks in the Americas
between 2000 and 2013, shown in Figure 1, were striking. In 2000, total
sales were US$ 61 billion in North America and US$ 38 billion in Latin
America. However, by 2013, the situation had transformed. Sales in
North America in 2000–2013 increased overall by about 25% and totaled
US$ 76 billion, having leveled off and, if anything, declined after 2012.
In contrast, sales in Latin America doubled between 2000 and 2013,
Chapter 3 15overtaking those in North America, at US$ 81 billion. Clearly, the potential
market for this leading range of ultra-processed products is now greater in
Latin America.
Figure 1
Sales value of carbonated soft drinks in North America and Latin America, 2000–2013
90,000
80,000
70,000
Sales value of carbonated
soft drinks (US$ billion)
60,000
50,000
Latin America
40,000
North America
30,000
20,000
10,000
0
2000
2001
2002
2003
2004
2005
2006
2007
2008
2009
2010
2011
2012
2013
Sales include both off-trade purchases (retail) and on-trade purchases (at bars, restaurants). Data are from the Euromonitor
Passport Database (2014) (38). North American data were from Canada and the United States. Latin American data were
from Argentina, Bolivia, Brazil, Chile, Colombia, Costa Rica, Dominican Republic, Ecuador, Guatemala, Mexico, Peru,
Uruguay, and Venezuela.
Figure 2 shows trends in annual sales per capita of ultra-processed
products from 2000 to 2013 in the seven world regions. In 2000, the
highest sales volume was in North America (the United States and
Canada), and Australasia (Australia and New Zealand). In 2000, per capita
sales in North America (328.9 kg) were almost 20 times higher than in Asia
(18.4 kg). From 2000 to 2013, sales per capita dropped by 9.8% in North
America (from 328.9 kg to 299.6 kg), and showed only a slight increase in
Australasia (from 192 kg to 200.5 kg). During the same period, sales grew
by 79.8% in Eastern Europe (from 52 kg to 93.3 kg), and almost doubled
in Asia and the Pacific (from 18.4 kg to 33.6 kg). In Latin America, the
increase was 26.7% (from 102.3 kg to 129.6 kg), and the region remained
the fourth biggest market in terms of sales per capita.
16 Ultra-processed food and drink products in Latin America: Trends, impact on obesity, policy implications.Figure 2
Retail sales per capita of ultra-processed food and drink products in global regions, 2000 and 2013
350 328.9
299.6
Annual retail sales per capita of
ultra‐processed products (kg)
300
250
200.5
192
200
152.4
139.5 2000
150 129.6
102.3 2013
93.3
100
52
33.6
50 23 28.6 18.4
0
North Australasia Western Latin Eastern Middle East Asia Pacific
America Europe America Europe and Africa
Ultra-processed products here include carbonated soft drinks, sweet and savory snacks, breakfast cereals, confectionery
(candy), ice cream, biscuits (cookies), fruit and vegetable juices, sports and energy drinks, ready-to-drink tea or coffee, spreads,
sauces, and ready-meals. Quantity in liters is converted into kilograms. Data are from the Euromonitor Passport Database
(2014) (38).
As shown in Figure 3, there were large variations in retail sales per
capita of ultra-processed products between the 80 countries available
in Euromonitor. The heaviest buyers of ultra-processed products by far
were in the United States (at 307.2 kg per capita per year or almost 6
kg per week), followed by Canada (229.8 kg) and Germany (218.5 kg).
In Western Europe, sales in France (125.4 kg) and Italy (113.3 kg) were
far lower than in Germany (218.5 kg), Belgium (210 kg), and the United
Kingdom (201.1 kg). In the Global South, high annual sales per capita
of ultra-processed products (> 150 kg) were only found in the higher-
income countries of Latin America (Mexico, 212.2 kg; Chile, 201.9 kg; and
Argentina, 185 kg). Elsewhere (Asia, Eastern Europe, and the Middle East
and Africa), consumption was less than 150 kg. Sales were very low in low-
income countries in these regions such as India (6.7 kg), Kenya (11.9 kg),
and Cameroon (12.1 kg).
Chapter 3 17Figure 3
Annual retail sales per capita of ultra processed food and drink products in 80 countries, 2013.
United States 307.2
Canada 229.8
Germany 218.5
Mexico 214
Belgium 210
Australia 208.3
Chile 201.9
Norway 201.7
United Kingdom 201.1
Japan 199.3
Switzerland 193.9
Netherlands 192.3
Ireland 187.8
Argentina 185
New Zealand 180.1
Finland 172.7
Austria 171.6
Israel 165.4
Spain 159.5
Sweden 158.4
Denmark 152.4
Saudi Arabia 149.6
Uruguay 149.5
Poland 130.5
Hong Kong 130.2
France 125.4
Serbia 125.3
Estonia 120.9
Slovakia 120.6
Costa Rica 120.4
Bulgaria 116.4
Guatemala 114.6
Italy 113.3
Brazil 112.9
Czech Republic 112
Taiwan 108.7
Portugal 102.9
Macedonia 102.9
Bolivia 102.5
Latvia 100.2
Venezuela 99.4
Hungary 99.2
Croatia 99
Lithuania 98
Dominican Republic 97.8
Singapore 96.8
South Africa 95.6
United Arab Emirates 93
Russia 92.3
Slovenia 92
Colombia 90.2
Romania 88.6
Ecuador 88
Greece 87.4
Kazakhstan 86
Belarus 83.7
Peru 83.2
South Korea 82.5
Tunisia 82.3
Turkey 81.1
Thailand 75.2
Ukraine 71.9
Bosnia and Herzegovina 68
Georgia 62.5
Algeria 60
Iran 59.7
Malaysia 56.6
Philippines 52.9
China 50.5
Azerbaijan 48.8
Vietnam 37
Morocco 32.9
Egypt 32.3
Uzbekistan 28.3
Indonesia 23.8
Nigeria 16.7
Cameroon 12.1
Kenya 11.9
Pakistan 9.6
India 6.7
0 50 100 150 200 250 300 350
Annual retail sales per capita of ultra‐processed products (kg)
Ultra-processed products here include carbonated soft drinks, sweet and savory snacks, breakfast cereals, confectionery (candy),
ice cream, biscuits (cookies), fruit and vegetable juices, sports and energy drinks, ready-to-drink tea or coffee, spreads, sauces,
and ready-meals. Quantity in liters is converted into kilograms. Data are from the Euromonitor Passport Database (2014) (38).
183.2 Retail sales in Latin America
This section shows trends in retail sales per capita of ultra-processed
food and drink products in 13 Latin American countries between 2000
and 2013, plus some comparisons with the United States and Canada.
Figure 4 shows that between 2000 and 2013, annual sales per capita of
ultra-processed products increased—steadily, for the most part—in all
Latin American countries except Argentina and Venezuela, where sales
fluctuated. There were wide variations in regional averages. In 2000, the
highest sales volume was in Argentina (194.1 kg), Mexico (164.3 kg), and
Chile (125.5 kg). These figures were between two and five times higher
than those in Uruguay (60.6 kg), Peru (40.2 kg), and Bolivia (44.6 kg).
Sales in North America were far higher, at 337.6 kg (United States) and
247.9 kg (Canada).
The fluctuations in sales observed in Argentina and Venezuela coincided
with economic crises. Sales in Argentina fluctuated between 181 kg and
212 kg during 2000–2013 but dropped sharply (by 19%) (from 194.1
kg in 2000 to 157.9 kg in 2002) when the national economy shrank by
28% (43). In Venezuela, sales increased overall during 2000–2013 but
dropped on two occasions. The first drop (of 15%) occurred suddenly
in 2002–2003 when the country was in crisis and lost 29% of its gross
national income. Sales then rose steadily (by 48%) from 2003 to 2008 but
dropped again (by 18%) during 2008–2013, when the country lost 7.2%
of its gross national income (44).
Table 2 shows 2000 and 2013 annual sales per capita of ultra-processed
food and drink products, separately and for all 13 countries. It also shows
sales growth for the 2000–2013 period and year-to-year growth.
The fastest rates of growth in sales of ultra-processed products, taken
together for the study period, were in Peru (107%), Bolivia (129.8%),
and Uruguay (146.4%). In other countries, growth during this period
ranged from 8% to 59.8%, except in Argentina, which experienced a drop
of 4.4%. In comparison, in North America, sales dropped by 9% in the
United States and by 7.3% in Canada in the 2000–2013 period.
Growth in sales of ultra-processed food and drink products during the
2000–2013 period ranged from 1.5% in Ecuador to 68.4% in Uruguay. In
Chapter 3 19Venezuela, there was a decrease of 4.9%. The increase in ultra-processed
drinks was greater than for food products, ranging from 9.8% in Costa Rica
to 172.5% in Uruguay. Sales of drinks in Argentina decreased by 7.9%.
Figure 4
Annual retail sales per capita of ultra-processed food and drink products in 13 Latin American countries,
2000–2013
240
220
200
Annual retail sales per capita of ultra‐processed products (kg)
Argentina
180
Bolivia
Brazil
160
Chile
Colombia
140 Costa Rica
Dominican Republic
120 Ecuador
Mexico
100 Peru
Uruguay
80 Venezuela
Guatemala
Latin America
60
40
20
2000
2001
2002
2003
2004
2005
2006
2007
2008
2009
2010
2011
2012
2013
Ultra-processed products here include carbonated soft drinks, sweet and savory snacks, breakfast cereals, confectionery (candy),
ice cream, biscuits (cookies), fruit and vegetable juices, sports and energy drinks, ready-to-drink tea or coffee, spreads, sauces, and
ready-meals. Quantity in liters is converted into kilograms. Sales data are from the Euromonitor Passport Database (2014) (38).
20 Ultra-processed food and drink products in Latin America: Trends, impact on obesity, policy implications.Table 2
Retail sales per capita of ultra-processed food and drink products in 13 Latin American countries, 2000–2013
Ultra-processed food products Ultra-processed drink products Ultra-processed food and drink products
Countries Sales (kg) Growth (%) Sales (l) Growth (%) Sales (kg) Growth (%)
2000 2013 Period Yearly 2000 2013 Period Yearly 2000 2013 Period Yarly
Argentina 24.7 29.5 19.4 1.4 169.4 156.1 –7.9 –0.6 194.1 185.6 –4.4 –0.3
Bolivia 7.0 8.3 18.6 1.3 37.6 94.2 150.5 7.3 44.6 102.5 129.8 6.6
Brazil 16.5 21.4 29.7 2.0 69.5 90.9 30.8 2.1 86.0 112.3 30.6 2.1
Chile 21.3 30.4 42.7 2.8 104.2 170.2 63.3 3.8 125.5 200.6 59.8 3.7
Colombia 8.4 10.7 27.4 1.9 65.3 81.5 24.8 1.7 73.7 92.2 25.1 1.7
Costa Rica 13.3 15.9 19.5 1.4 94.5 103.8 9.8 0.7 107.8 119.7 11.0 0.8
Dominican Republic 7.7 8.3 7.8 0.6 62.6 88.3 41.1 2.7 70.3 96.6 37.4 2.5
Ecuador 6.8 6.9 1.5 0.1 66.6 81.0 21.6 1.5 73.4 87.9 19.8 1.4
Guatemala 10.0 12.4 24.0 1.7 80.7 101.1 25.3 1.7 90.7 113.5 25.1 1.7
Mexico 20.3 27.3 34.5 2.3 144 184.9 28.4 1.9 164.3 212.2 29.2 2.0
Peru 5.5 9.1 65.5 3.9 34.7 74.1 113.5 6.0 40.2 83.2 107 5.8
Uruguay 15.2 25.6 68.4 4.1 45.4 123.7 172.5 8.0 60.6 149.3 146.4 7.2
Venezuela 14.2 13.5 –4.9 –0.4 77.8 85.9 10.4 0.8 92.0 99.4 8.0 0.6
Latin America 14.9 19 27.5 1.9 87.9 110.7 25.9 1.8 102.8 129.7 26.2 1.8
Ultra-processed food products here include sweet and savory snacks, breakfast cereals, confectionery (candy), ice cream, biscuits (cookies), spreads, sauces, and ready-meals. Ultra-processed
drink products include carbonated soft drinks, fruit and vegetable juices, sports and energy drinks, and ready-to-drink tea or coffee. Quantity in liters is converted into kilograms. Data are
from the Euromonitor Passport Database (2014) (38). Latin American data were from Argentina, Bolivia, Brazil, Chile, Colombia, Costa Rica, Dominican Republic, Ecuador, Guatemala, Mexico,
Peru, Uruguay, and Venezuela.
Chapter 3
213.3 Fast-food purchases
Retail sales do not include ultra-processed food and drinks purchased
in fast-food restaurants (“on trade” purchases). Therefore, this section
describes trends in fast-food consumption in Latin American countries
based on sales purchases at fast-food outlets (defined as establishments
offering limited menus prepared quickly where customers order, pay, and
pick up from a counter). Figure 5 shows annual per capita transactions
(number of single, complete purchases, which may include more than one
meal) from fast-food outlets in 13 Latin American countries from 2000 to
2013, with some comparisons with the United States and Canada.
In Latin America, the number of fast-food per capita purchases increased
by 38.9% over the study period (from 13.6 in 2000 to 18.9 in 2013). Latin
American per capita fast-food purchases increased continuously in all
countries except Argentina. They doubled or more than doubled in Bolivia,
Colombia, Costa Rica, Dominican Republic, Peru, and Chile. The fastest
growth was in Peru (265%), where the number of purchases grew from
8.7 in 2000 to 31.8 in 2013, and Bolivia (275%), which grew from a much
lower baseline of 0.8 to 3.0. Sales growth was between 40% and 75% in
Guatemala, Mexico, Uruguay, and Venezuela, and was 25% in Brazil. There
was a drop of 36% in Argentina (from 19.4 to 12.5) from 2000 to 2002,
during the financial crisis. Sales then rose by 23% (from 12.5 to 15.4)
between 2002 and 2013.
In 2013, in Latin America, Brazilians and Peruvians were by far the biggest
consumers of fast-food, with 10 times more purchases than Bolivia. They
remain, however, far behind Canada and the United States, were purchases
amounted to 134.9 and 120.9 respectively in 2013.
22 Ultra-processed food and drink products in Latin America: Trends, impact on obesity, policy implications.Figure 5
Annual number of purchases per capita in fast-food outlets in 13 Latin American countries, 2000–2013
32
30
Annual number of purchases per capita in fast -food outlets
28 Argentina
Bolivia
26
Brazil
24
Chile
22 Colombia
20 Costa Rica
18 Dominican Republic
16 Ecuador
Latin America
14
Guatemala
12 Mexico
10 Peru
8 Uruguay
6 Venezuela
4
2
0
2000
2001
2002
2003
2004
2005
2006
2007
2008
2009
2010
2011
2012
2013
Purchases refers to single, completed purchases (which may include more than one meal).Fast-food outlets are defined as
establishments offering limited menus prepared quickly where customers order, pay, and pick up from a counter. Data are from
the Euromonitor Passport Database (2014) (38).
Chapter 3 23You can also read