Quarterly Gas Review: The impact of COVID-19 on global gas markets - Oxford Institute for Energy Studies
←
→
Page content transcription
If your browser does not render page correctly, please read the page content below

MAY 2020

                       Quarterly Gas Review:
The impact of COVID-19 on global gas markets

 Introduction
 In this Quarterly Review we provide an initial assessment of the most important issue facing global
 energy markets in 2020, namely what will the impact of the COVID-19 pandemic and its economic
 consequences be? We have seen the dramatic effect that the lock-down of many global economies has
 had on the oil price as the transport sector, which contributes a majority of oil consumption, has
 effectively ground to a halt. When combined with a collapse in OPEC+ production restraint during March
 this led to a huge oversupply of crude oil which, for a short period, led to negative prices for the US
 benchmark WTI.
 Our analysis focuses on the gas market and highlights a number of key differences with oil. Firstly, the
 gas market has been oversupplied for some time due to the emergence of new LNG supply over the
 past 18 months from projects which took investment decisions in the mid-2010s. This supply has
 entered the market at a time when global demand has failed to meet growth expectations, and so the
 COVID-19 pandemic has exacerbated a current problem rather than catalysed a crisis. The situation
 for suppliers was already bad in the gas market, and it has just been made significantly worse. One
 mitigating factor, however, is the second difference with oil, namely that gas demand is less focused on
 one sector and therefore the impact of the crisis is somewhat diversified. Furthermore, low gas prices
 have allowed gas to become even more competitive relative to its major competitor, coal, which has
 also offset some of the demand decline caused by the slump in the global economy. Despite all this,
 though, the gas sector faces a worrying time for the rest of 2020, especially over the summer months
 when a demand slump could cause a rapid filling of storage in Europe towards its capacity limits.
 This Quarterly Review addresses these issues across a number of essays from our research fellows.
 Following the opening section where we review global gas prices over the past quarter, James
 Henderson analyses the link between global GDP growth and global gas demand and finds a close
 correlation in good and bad times, with worrying consequences for gas in 2020. Then Jack Sharples
 looks at the short-term impact of the crisis in the first four months of 2020 focusing on the balancing
 market for LNG – Europe. He highlights some key shifts in gas flows, some worrying demand trends
 and an emerging issue with storage. We then consider the regional impacts of COVID-19, looking at
 China (Michal Meidan), India (Anupama Sen), Europe (Anouk Honoré), Russia (Tatiana Mitrova) and
 the US (Mike Fulwood), with a number of differing themes emerging. Mike Fulwood then analyses the
 potential global supply-demand balance for 2020 based on the IMF forecast of a 3% decline in global
 GDP and finds that, even in the event of an optimistic V-shaped economic recovery, global gas supply
 in Q3 2020 will need to be restrained if a WTI-like gas storage crisis is to be averted. Finally, Jonathan
 Stern and Tatiana Mitrova consider the longer-term outlook for gas in a post-COVID-19 energy
 economy and find some glimmers of hope amid the overall threats to demand for hydrocarbons.
 James Henderson
 Director, Natural Gas Programme
 james.henderson@oxfordenergy.org

        The contents of this paper are the authors’ sole responsibility. They do not necessarily represent the views of
                                the Oxford Institute for Energy Studies or any of its Members.
1. Pricing Analysis

Before we outline our thoughts on the impact of COVID-19 on the global gas market, it is worth briefly
reviewing the five price-related charts that are the standard opening for our Quarterly Review as all
demonstrate the impact of the continuing oversupply situation that was prevalent before the pandemic
and is now being exacerbated by it even further.

1.1 LNG Tightness – cash margins have gone negative
Firstly we consider our ‘LNG Tightness’ analysis as an indicator of whether the gas market is providing
any indication that new projects are required to balance the market or whether, alternatively, there is
no need for new FIDs in an oversupplied global situation. The graph below is based on data from Argus
Media and shows the prices for TTF in the Netherlands, the ANEA spot price in Asia and the Henry
Hub price in the US. It then calculates the highest netback from Europe or Asia to the Gulf of Mexico
based on the relevant transport costs. The LNG Tightness calculation is then shown on a historical
basis and also based on futures prices, and provides an indication of whether developers in the US can
expect to recover the cost of liquefaction on the Gulf Coast (which is generally estimated at around
$3/MMBtu based on the traditional Cheniere contract). A margin above this level would provide an
obvious incentive for new projects while a margin well below this would suggest an oversupplied market.
Figure 1.1: An assessment of ‘LNG Tightness’
            12
            11
            10
            9
            8
            7
  $/MMBtu

            6
            5
            4
            3
            2
            1
             -
            (1)
              Jan-16 Jul-16 Jan-17 Jul-17 Jan-18 Jul-18 Jan-19 Jul-19 Jan-20 Jul-20 Jan-21 Jul-21 Jan-22 Jul-22 Jan-23 Jul-23

                     LNG Margin                  LNG Margin (Forward)       HH                          TTF
                     ANEA                        HH (Forward)               TTF (Forward)               ANEA (Forward)
Source: OIES, based on data from Argus Media (Forward curve as of May 1st)

Given the current state of the global gas market, it should be no surprise that the indicator is not showing
a need for new projects at present as the margin has shrunk dramatically over the past three months.
It has now gone negative (based on futures prices) for the whole of the rest of 2020 and does not regain
the $3 level that would catalyse new developments throughout the period to the end of 2023. This
suggests that some LNG supply could actually be shut-in during the rest of 2020 (as will be discussed
in our later analysis of COVID-19) and also that new FIDs are unlikely for some time, based on the price
outlook. Of course, a number of caveats should be added. Various issues need to be taken into
consideration when contemplating the shut-in of supply, for example offtakers of US LNG may continue
to take deliveries for strategic or contractual reasons. Equally, FIDs for new projects are taken on the

   The contents of this paper are the authors’ sole responsibility. They do not necessarily represent the views of the Oxford
                                      Institute for Energy Studies or any of its Members.
                                                                                                                                2
basis of forecasts of long-term LNG demand starting from the mid-2020s and stretching out over the
following two to three decades. Nevertheless, the fact that the implied margin is so low at present is a
clear signal that the market is very fully supplied and is likely to remain so for some time.

1.2 The Russian gas price and TTF versus US LNG in Europe
The difficulties for LNG suppliers can be illustrated by an examination of prices in Europe, the market
of last resort for global LNG supplies, relative to the cost of US LNG. Figure 1.2 compares the average
Russian export price with TTF and then compares both with the long- and short-run marginal cost of
US LNG, based on the Cheniere formula.1 It can give some indication of the level of competition in
Europe between LNG and pipeline gas from Russia, Norway and other major importers.
As can be seen in Figure 1.2, for which the data was only available to March and therefore does not
reflect the full impact of the COVID-19 lockdowns, the price of TTF, the most liquid European hub, has
fallen below even the short-run marginal cost of US LNG, while the Russian gas price is heading in the
same direction. This does not mean that no LNG can arrive in Europe – indeed volumes are high due
to the fall in energy demand across the globe and the need for LNG producers to find a home for surplus
supply. However, it does reiterate the point that the market is very competitive and that the price
incentive to deliver higher cost LNG to Europe has all but disappeared.
Figure 1.2: Russian gas price and TTF versus US LNG in Europe
                 12.00

                 10.00

                  8.00
     US$/mmbtu

                  6.00

                  4.00

                  2.00

                  0.00
                         Jan-15   Jul-15   Jan-16   Jul-16   Jan-17   Jul-17     Jan-18   Jul-18     Jan-19   Jul-19   Jan-20

                                           TTF          Ave Russia             US SRMC             US LRMC

Source: OIES, with data from Argus Media

1.3 The price on Gazprom’s Electronic Sales Platform
Another indicator of Gazprom’s sales strategy in Europe can be found by examining the activity on the
company’s Electronic Sales Platform. The ESP, as it is known, has been used to sell extra Russian gas
to fill pipeline export capacity and to top-up long-term contract sales. Indeed, for some time now the
ESP Index (the average of ESP prices across a number of delivery points) has shown a price lower

1
  The Long Run Marginal Cost of US LNG (LRMC) is calculated as ((Henry Hub Price x 1.15) + $3 liquefaction tolling fee + $0.7
transport cost to Europe + $0.4 regasification cost in Europe). The Short Run Marginal Cost (SRMC) is the same calculation
without the liquefaction fee.

    The contents of this paper are the authors’ sole responsibility. They do not necessarily represent the views of the Oxford
                                       Institute for Energy Studies or any of its Members.
                                                                                                                                 3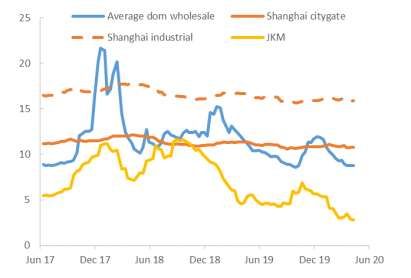
than Gazprom’s long-term contract (LTC) price, and this has continued in 2020. However, while January
and February showed a dramatic increase in volumes of short-term gas on the Platform, indicating that
Gazprom was offering very competitive gas to make up for a decline in long-term contract sales (as
buyers had been nominating down to take-or-pay levels due to lower demand and the availability of
cheap gas on European hubs), March has shown a significant change in strategy. Although the ESP
price has remained very competitive, the majority of sales are now for month, quarter, season or even
year ahead, indicating that Gazprom has no intention of actively engaging in a short-term price war but
is now trying to lock in longer-term sales in a very difficult market. As a result, although Russian gas
remains very price competitive and is certainly a threat to LNG arriving in Europe, it would at least seem
that Gazprom is not keen to see the short-term price in Europe go any lower. Allegedly it has a target
price of $100/Mcm, ($2.80/MMBtu or €8.61/MWh), which seems rather optimistic at present but may be
reasonable once the European economy starts to become more active as lockdown restrictions are
eased.
Figure 1.3: The Price at Gazprom’s Electronic Sales Platform versus European Hubs

             ESP vs Average of Day-Ahead and Month-1 European Hub Prices (EUR/MWh)
 30.00    28.77
                  27.45
                      25.46
                              23.63
 25.00                                21.11

                                          18.01
                                               16.09                                                 15.56
                                                       14.86                                15.52
 20.00
                                                               12.02                13.54               11.98
                                                                    11.52     11.76                             11.17
                                                                         11.71
                                                                                                                        10.04
 15.00
                                                                                                                            8.66

 10.00

                                                                                                     Apr-20, 6.68
  5.00

               ESP Index              TTF-Gaspool              NCG-Czech          Austria-Slovakia           Gazprom LTC

Source: GazpromExport, Argus Media, OIES

1.4 JKM spot price versus LNG contract price in Asia
The relationship between contract and spot prices in Asia is becoming increasingly interesting. As we
have noted in various pieces of research, customers tend to demand change in the formation of prices
when their impact causes them to suffer very substantial financial losses. This certainly occurred in
Europe when spot and contract prices diverged and customers began to demand a move from oil-linked
pricing to hub-based prices, catalysed by new EU rules on market liberalisation. The trend away from
oil-linked pricing in Asia has been much more gradual, and indeed some might argue that it has barely
started, but as Figure 1.4 shows, a significant divergence between spot and contract prices has
emerged in 2019 and has widened in 2020 to date, creating a significant incentive for customers to act.
The instance of arbitration cases has started to increase, albeit from a low base, and rumblings of
discontent from those tied into higher-priced oil linked contracts has grown. Although COVID-19 issues

   The contents of this paper are the authors’ sole responsibility. They do not necessarily represent the views of the Oxford
                                      Institute for Energy Studies or any of its Members.
                                                                                                                                   4
remain more important at present, there seems little doubt that if this trend persists we could see a real
challenge to oil-linked pricing of LNG in Asia, with the JKM marker already becoming an increasingly
liquid and important price benchmark. Of course, at a current oil price of around $20-30 per barrel the
pressure may ease in Q4 when this lower level starts to impact long-term LNG contracts, but even then
it will not completely solve the problem if spot gas prices remain at their current levels.
Figure 1.4: JKM spot price versus Japan LNG contract price ($/MMBtu)
25.00
20.00
15.00
10.00
5.00
-
Mar-12
Mar-14
Mar-16
Mar-18
Mar-20
Mar-09
Mar-10
Mar-11
Mar-13
Mar-15
Mar-17
Mar-19
Sep-09
Sep-10
Sep-11
Sep-12
Sep-13
Sep-14
Sep-15
Sep-16
Sep-17
Sep-18
Sep-19
JKM Japan Contract
Source: Platts data, OIES analysis
1.5 Chinese domestic price versus LNG import price
An increasingly important indicator in Asia will be the Chinese domestic gas price versus the LNG import
price level, and we are now monitoring this on a quarterly basis. The market continues to expect that
low spot JKM prices will filter through to domestic prices, leading to an increase in China’s gas demand.
But as the chart below highlights, domestic city gate prices (taking Shanghai as an example) are
disconnected from JKM (and from other international prices for that matter). Chinese domestic prices,
which are assessed by the National Bureau of Statistics every 10 days, have been falling steadily over
Q1 2020 (in no small part thanks to changes in the RMB/$ exchange rate) and are now roughly
$3/MMBtu lower than their 2018-19 averages. However, they have not fallen as fast as JKM and at
$8.70/MMBtu they still represent a hefty burden for industrial and commercial users. Going forward, the
government has mandated cuts to city-gate prices, and with oil-linked contract prices also expected to
decline in the second half of the year as the impact of lower oil prices kicks in, the differential to JKM
should start to narrow.
As a result, the impetus for changing the domestic pricing mechanism is increasing. While the
government is unlikely to liberalize prices altogether, it will want to see domestic prices reflect
international movements more regularly. Yet, while Beijing wants lower prices to encourage end-user
demand, it would also like to maintain sufficient incentives for the majors to keep producing domestic
gas, suggesting that some level of administrative intervention will remain. Nevertheless, reform efforts
do seem to be continuing, despite the overwhelming impact of the COVID-19 pandemic, and we will
continue to monitor this price trend through 2020.
The contents of this paper are the authors’ sole responsibility. They do not necessarily represent the views of the Oxford
Institute for Energy Studies or any of its Members.
5Figure 1.5: Chinese gas prices compared to JKM ($/MMBtu)
Source: NBS, SHPGX, Platts, OIES
The contents of this paper are the authors’ sole responsibility. They do not necessarily represent the views of the Oxford
Institute for Energy Studies or any of its Members.
62. The impact of COVID-19 on global gas markets
Executive Summary
The impact of the COVID-19 pandemic and its economic consequences on energy demand has shown
marked differences by fuel. The immediate impact on oil has been dramatic due to the rapid decline of
consumption in the transport sector as countries have implemented lock-down policies that have
constrained movement of people and goods. The impact on gas has been less immediate, but our
analysis suggests that a decline that is closely correlated with global GDP is inevitable over time. In line
with the reference case forecast from the IMF we have assumed a 3% decline in global GDP in 2020
which then leads to a 3% decline in gas demand. However, the implied V-shaped economic recovery
increasingly looks like an optimistic best-case outcome rather than a base case, and an obvious
conclusion is that any worsening of the economic outlook will lead to a similar deterioration in gas
demand. We note that the recent IEA report on the impact of COVID-19 sees a 6% decline in global
GDP in 2020 and a 5% decline in gas demand.
In terms of the immediate impact of the crisis, in the period up to the end of April we find it particularly
useful to look at the balancing market for global LNG, namely Europe. It is interesting to observe that
LNG imports into Europe for the entire 4 months to date have been higher than the same period in 2019
due to an excess of global supply and lower than expected demand in Asia. In Q1 this caused a fall in
pipeline imports but following the collapse in demand in April it has caused a surge in storage injection,
with the result that capacity is now more than 60% full already. In 2019 it only reached this level at the
start of June, and in 2017 and 2018 it was reached only at the end of July. The consequence is that if
injection continues at normal rates storage could be completely full by early August, perhaps earlier.
In terms of the regional impact, experiences have been colored by the current role of gas in the energy
balance and its competitive position relative to alternative fuels. In the US, for example, demand has
been hit, but the low price relative to coal has meant that the impact has been offset somewhat in the
power sector. Across the world, though, expectations for demand have declined, and although this does
not always mean an absolute year-on-year fall in consumption compared with 2019 it does mean that
in a world of increasing LNG supply the surplus of gas in 2020 is only set to grow. Resulting low prices
will underpin demand in some countries, with India being a prime example of a country that has capacity
to use more cheap gas in its power sector, but this will not be enough to offset the overall impact of
lower economic activity. Meanwhile, gas demand growth in China will still be positive in 2020 but lower
than expected.
In Europe, while the data for March showed a mixed impact on gas across individual countries, April
has shown consistent and sharp decline in consumption. Demand in Germany has fallen by 9%, while
the UK Spain, Italy and France have all seen year-on-year declines at around 20% or more. Signs of a
relaxation of lockdown measures offer some hope for the rest of 2020, but even if a V-shaped recovery
does take place we suggest that annual gas demand in Europe will be down by 6%, with the beneficial
impact of low gas prices being offset by the increasing availability of renewables in the power sector.
Meanwhile in Russia the impact of the virus seems to be increasing and the government is taking steps
to protect its citizens by keeping regulated prices frozen and countenancing an increased level of non-
payment. Even so, experience of previous crises suggests that gas demand, which accounts for over
50% of Russian energy supply, will at least fall in line with GDP, which the IMF expects to decline by
5.5% in 2020.
Taking these regional views into consideration, we have modelled one possible outcome for the global
gas market, based on the IMF reference case mentioned above. We see a 3% decline in global gas
demand in this relatively benign scenario but this still results in a level of surplus gas heading to the
European market that could overwhelm storage during the summer months. We estimate that almost
50bcm of ‘stranded’ gas would need to be curtailed to provide any hope of balancing the market. Clearly,
this is a world in which low prices are set to persist for some time and in which a storage crisis similar
to that seen with West Texas Intermediate (WTI) oil in the US could emerge unless producers start to
show significant restraint. Shut-ins appear inevitable, both for LNG and pipeline gas, with those
suppliers (along the whole value chain) with the highest variable costs being the most likely to be forced
into action.
The contents of this paper are the authors’ sole responsibility. They do not necessarily represent the views of the Oxford
Institute for Energy Studies or any of its Members.
7In the short-term then, the outlook looks bleak unless the health and economic situations improve much
faster than seems likely at present. For the longer term, though, the impact of the crisis on natural gas
appears somewhat more benign. Low prices may not be sustainable for producers for long, but they
can encourage a re-think about gas’ role in the energy transition and could delay the most negative
impacts. Indeed, in some countries there could be a significant boost to demand if current market forces
combined with a rekindled desire for clean air catalyse an accelerated demise for coal. Low spot prices
could also accelerate the transition away from oil-linked LNG contracts, which could further improve the
competitive position for gas, especially in Asian countries which are expected to account for the majority
of the increase in global demand. It will also be instructive to see whether this helps to ease the path
for gas in energy transition policy-making even in a world in which governments are being encouraged
to focus economic support on green investment. Our initial conclusion is that the strategic direction of
the energy transition is unlikely to be altered, but its implementation may be delayed, providing the gas
industry with a little additional breathing space to develop the decarbonisation strategy which we
continue to believe will be vital for its long-term survival.
As far as the corporate landscape is concerned, the major energy companies had already been shifting
their portfolios away from oil and towards gas, and although this process is likely to continue, it will be
important to see whether a low price environment significantly undermines the appetite for new
investment and whether banks and investors start to shift their priorities away from all hydrocarbons.
This could create the potential for a price spike later in the decade if supply is insufficient to meet a
rebound in demand, but we do not see this as an issue over the next five years unless a significant
number of projects which have already taken investment decisions are deferred or cancelled due to the
impact of the pandemic.
One further strategic observation is that, in a market where collapsing prices have reduced the
differentials between regions to almost zero, the incentive for larger companies to continue with their
portfolio approach to LNG may diminish as the returns from switching gas between markets decline.
This could further undermine investment in new projects. A counter argument to this may be that the
need for portfolio optimization and creative trading will become even more important during a period
when margins are very tight, meaning that large players with multiple options may be able to survive
the market downturn and benefit from the commercial problems of smaller companies. As a result,
further consolidation in the gas sector may be an inevitable consequence.
A final conclusion is that it goes without saying that all these outcomes are highly dependent on the
ultimate course of the health crisis and the timing and pace of any economic recovery. We can only
hope that the human tragedy caused by COVID-19 can be alleviated as quickly as possible by the
courageous work being done by health services all over the world and by the speedy development of a
vaccine and/or effective anti-viral drugs. In the meantime, government action to mitigate the economic
consequences and ultimately to return countries to growth will be critical, and energy consumption will
clearly respond to this. As we describe, the gas sector will certainly be hit in the short-term, and indeed
the outcome could be significantly worse than we describe as the IMF reference case assumption for
global GDP which we have used looks increasingly over-optimistic. As a result, a significant demand
crisis may emerge this summer, with the implication that storage in Europe could be full by mid-summer
leading to a further slump in prices or a significant adjustment in production and exports by major
suppliers. However, amid this gloom we do see the prospect of some more benign consequences over
the medium term when economic growth returns and if gas is seen as having a positive role to play in
sustaining some of the environmental benefits that have been witnessed over the past two months of
lock-down.
James Henderson (james.henderson@oxfordenergy.org)
The contents of this paper are the authors’ sole responsibility. They do not necessarily represent the views of the Oxford
Institute for Energy Studies or any of its Members.
82.1 Global overview – gas markets and economic crises
Views on the economic impact of COVID-19
There seems to be little doubt that the COVID-19 pandemic will cause the greatest economic shock
since the Great Depression almost 100 years ago as the lock-down implemented in many countries
brings travel and business activity to a temporary halt. However, that is where the consensus among
forecasters ends, due to the range of uncertainties around the length of the lock-down, the risk of a
second wave of the pandemic, the impact of policies to safeguard businesses during the downturn and
the medium term response of the private sector. One potentially worrying observation, though, is that
most of the options being modelled by economists only show downside scenarios from their base case,
suggesting that concerns over a worse-than-expected outlook abound.
A good starting place for an overview of the situation is the World Economic Outlook published by the
International Monetary Fund (IMF), the latest version of which appeared in early April 2020. 2 The base
case forecast outlined what would be best termed a ‘classic V-shape’ decline and recovery, based on
the assumption that the maximum impact of COVID-19 will be felt in Q2 2020 and that the virus will
then be largely contained and economic activity will be able to re-start, albeit gradually. The red bars in
Figure 2.1 show the outcome of this analysis, which results in a decline in global GDP of -3.0 per cent
in 2020 followed by a sharp rebound to growth of +5.8 per cent in 2021. This essentially implies an
adjustment of -6.3 per cent in the IMF’s forecast for 2020 compared to its estimate from January this
year (the January estimate is shown in the green bars, and an estimate from October 2019 is shown in
grey), underlining the dramatic change in circumstances in only three months.
Figure 2.1: Comparison of IMF forecasts for global GDP
8
6
4
GDP Growth (%)
2
0
2019 2020 2021
-2
-4
-6
-8
Oct (2019) Est Jan (2020) Est
April (2020) Est Longer outbreak in 2020
New outbreak in 2021 Longer 2020, New 2021
Source: Data from IMF WEO, April 2020
However, as can be seen from the dotted lines in Figure 2.1, the IMF paints three alternative scenarios
based on the predicted outcomes of the pandemic. In the first (the yellow line) the pandemic lasts for
longer in 2020, implying an extended lockdown and a more dramatic impact on economic activity. This
leads to a GDP decline of -5.8 per cent in 2020 and a rebound of +3.8 per cent in 2021, both well below
the base case. It is interesting to note that in the case of an extended lockdown the OECD has offered
a rule of thumb that each extra month equates to approximately 2 per cent removed from global GDP
on an annual basis.3 A second scenario (blue line) sees a new outbreak in 2021, which has no impact
on the base case forecast for 2020 but reduces growth in 2021 to only +1.55 per cent. The third, and
2
IMF World Economic Outlook, April 2020, at https://www.imf.org/en/Publications/WEO/Issues/2020/04/14/weo-april-2020
3
OECD Interim Economic Outlook, ‘Coronavirus: the world economy at risk’ at https://www.oecd.org/economic-outlook/
The contents of this paper are the authors’ sole responsibility. They do not necessarily represent the views of the Oxford
Institute for Energy Studies or any of its Members.
9most pessimistic scenario (black line), sees a combination of the first two outcomes, with an extended
lockdown in 2020 and a second wave of the virus in 2021, leading to two years of global recession.
However, these alternative cases only paint half of the picture because another key dynamic is the
policy response from governments, which can itself help or hinder economic recovery in any of the
health-based outcomes painted by the IMF. Indeed, Oxford Economics have argued in recent papers
that these responses will have a much more profound impact on the future of the global economy than
the virus itself, and indeed have suggested that a V-shaped recovery is far from a certainty. 4 In fact
their analysis shows that only around 60 per cent of GDP slumps caused by major crises have been
followed by strong rebounds, and furthermore that the extent of the rebound is not strongly correlated
to the size of the slump. As a result, government action is absolutely vital, with a clear divide being
noted between ‘governments that spend early and aggressively to counter an economic downturn and
those that do not.’ Also crucial is the ability to preserve industrial activity through the slump so that it is
ready to re-start once the crisis is passed, with a particular focus on avoiding financial collapse due to
excessive bankruptcies, loan defaults and commodity price slumps. It is interesting to note that Oxford
Economics’ downside scenario sees the potential for a global GDP decline of -8 per cent in 2020, much
worse than the IMF, if the correct policies are not implemented.5
While this outlook appears remarkably gloomy, with only negative scenarios around the base case,
some glimmers of hope have been identified. The consultants McKinsey & Co. have created a matrix
of potential outcomes based on public health response and economic policies which identifies all the
cases mentioned above but also sees variations in which the pandemic is effectively controlled and
governments intervene in a strong and positive fashion.6 This still leads to an economic decline in the
short-term, although the magnitude is lower at -1.5 per cent for 2020, before a strong recovery in 2021.
Nevertheless, even this research sees more negative than positive potential outcomes and also
highlights a further risk, namely that the effect on emerging markets could ultimately be more painful
than for developed markets that are currently feeling the worst of the impact.
This theme is picked up by other analysts who highlight that, although developed markets are likely to
have a worse short-term outcome, the shock could be limited by aggressive intervention and by the
relative strength of country balance sheets. 7 For emerging markets, the health crisis is taking longer to
develop (possibly because of less extensive travel infrastructure) but could ultimately be more
damaging and last longer because of poorer health facilities. In addition, the economic downturn could
be exacerbated by a more limited ability to use significant state investment as a lever of economic
growth and also due to the higher existing debt levels in many poorer nations.
Overall, then, while the economic outlook is obviously bad the key questions are how bad and for how
long? The two key drivers behind the answers have different characteristics. On the one hand the
spread of COVID-19 and the temporal extent of its impact are still relatively unknown and could cause
further exogenous shocks. On the other, government responses are within our control, but uncertainty
remains as to how forcefully and effectively they will be implemented. The outcome would appear to be
a global GDP decline of between 3 and 8 per cent in 2020, with a potential return to growth in 2021, but
the impact will be felt differently across countries and regions, with OECD markets suffering more in
the short-term but with non-OECD markets likely to feel a more significant long-term effect.
What could this mean for the global gas market?
Energy demand growth is broadly related to economic activity and population growth, with the latter
providing a more stable long-term trend while the former can obviously be much more volatile, as we
are experiencing at present. In fact, when we look at the historic data for global total primary energy
supply (TPES) and world GDP growth, in the period 1990-2018 the correlation between the two has
been fairly tight, with an r2 of 0.79 rising to 0.87 for the past decade. 8 During previous economic
4
Oxford Economics (April 2020). ‘After the pandemic: Medium-term growth uncertainties’
5
Oxford Economics (April 2020). ‘A downside scenario for the global economy’
6
McKinsey & Co. (March 2020). ‘Safeguarding our lives and our livelihoods: The imperative of our time’
7
Morgan Stanley (April 2020). ‘Global Macro Briefing: The Great Covid-19 Recession aka GCR’
8
Global GDP growth data from World Bank database, global TPES from BP Statistical Review of World Energy 2019
The contents of this paper are the authors’ sole responsibility. They do not necessarily represent the views of the Oxford
Institute for Energy Studies or any of its Members.
10downturns in 1998, 2001 and 2008/09 total energy demand has fallen in line with the slowdown in
economic activity, and there is clearly no reason to believe that the same will not occur during 2020 –
indeed we are already seeing significant evidence of this.
When considering the current impact of COVID-19 it would be logical to assume that the major decline
would be seen in oil demand. Transport activity, which accounts for the majority of oil consumption, has
fallen dramatically as almost all forms of travel have been severely impacted by the lockdowns imposed
by governments to halt the spread of COVID-19. However, it is interesting to note that this is something
of an anomaly when looking at the historic trends, which suggest that oil demand has moved up or
down at around 50 per cent of the rate of GDP (see Figure 2.2). In fact, it is gas demand that is much
more closely related to economic activity. Over the period 1998 to 2018 the average annual movement
in gas demand over the entire period has been 91 per cent of the movement in GDP, compared to 46
per cent for oil, and as can be seen in Figure 2, this average has trended towards 100 per cent in the
past decade.
Figure 2.2: Oil and gas demand growth versus GDP growth
2.0
Demand Growth / GDP Growth
1.5
1.0
0.5
0.0
1990 1992 1994 1996 1998 2000 2002 2004 2006 2008 2010 2012 2014 2016 2018
-0.5
-1.0
Oil Demand / GDP Gas Demand / GDP
Linear (Oil Demand / GDP) Linear (Gas Demand / GDP)
Source: Data from World Bank and BP Statistical Review of World Energy, analysis by OIES
Some of this difference may be explained by the fact that gas has been increasing its market share
relative to other fossil fuels over the past two decades. Indeed, this might also explain why the
correlation between the annual movements of GDP and gas demand is not as close, especially for the
1990s when the growth in gas’s market share (especially in the power sector) was a major driving force.
Nevertheless, since 2000 the correlation between economic growth and gas demand growth has been
increasingly tight, with an r 2 of 0.75 for the two decades since 2000 and of 0.81 for the period since
2009. Furthermore, it is interesting to note the very close link between the two in the most recent
economic slumps in 2001 and 2008/09, when the declines almost mirrored each other (see Figure 2.3).
While we cannot necessarily conclude that a 3-8 per cent decline in the global economy in 2020 will
lead to a similar fall in gas demand, it would not be unreasonable to suggest that, although the fall in oil
demand has been immediate and dramatic, a more gradual but nevertheless significant fall in gas
demand would seem equally inevitable.
The contents of this paper are the authors’ sole responsibility. They do not necessarily represent the views of the Oxford
Institute for Energy Studies or any of its Members.
11Figure 2.3: Global GDP growth compared with gas demand growth (1990-2018)
8.00%
6.00%
4.00%
YoY Change (%)
2.00%
0.00%
1990 1992 1994 1996 1998 2000 2002 2004 2006 2008 2010 2012 2014 2016 2018
-2.00%
-4.00%
Gas GDP
Source: Data from World Bank and BP Statistical Review of World Energy, analysis by OIES
There are a number of caveats around this overall analysis which should be acknowledged, however.
The first, and perhaps most obvious, is the weather impact, which can clearly exaggerate any upswing
or downturn. For example, the winter in the northern hemisphere in 2019/20 has been relatively warm,
implying the likelihood of even lower gas demand, although this could clearly be reversed in winter
2020/21. The second is country and regional differences in the energy mix. Any country which uses gas
as a major part of its fuel for power generation and industry (e.g. the UK) might expect a more significant
decline in gas demand than a country where coal-to-gas switching is still continuing (e.g. the US in
2020). These differences will be discussed in the analysis of various regions in section 2.3.
Figure 2.4: Relationship between GDP growth and gas demand growth in OECD and non-OECD
countries (gas demand growth/GDP growth, 1991-2017)
6.00
5.00
4.00
3.00
2.00
1.00
0.00
2004
2014
1991
1992
1993
1994
1995
1996
1997
1998
1999
2000
2001
2002
2003
2005
2006
2007
2008
2009
2010
2011
2012
2013
2015
2016
2017
-1.00
-2.00
OECD Non-OECD Linear (OECD) Linear (Non-OECD)
Source: Data from World Bank and BP Statistical Review of World Energy, analysis by OIES
However, even at a high level it is worth observing the different relationship between GDP growth and
gas demand growth in OECD and non-OECD countries, which is shown above in Figure 2.4. Although
the trend lines for both regions seem to be converging at a relationship of around 0.9 (gas demand
The contents of this paper are the authors’ sole responsibility. They do not necessarily represent the views of the Oxford
Institute for Energy Studies or any of its Members.
12growth/GDP growth), the relationship between gas demand and GDP in each region is very different.
The correlation between the two in the OECD has an r2 of 0.62 over the past decade, for example, while
for non-OECD the r2 is -0.26, clearly underlining the variability of response across regions. This variation
could be explained, for example, by different reactions to low prices, with demand in developing gas
markets being particularly responsive to price movements.
The final area of difference is between sectors, and this again will differ by country. Figure 2.5 shows
an analysis of the global use of gas in the industrial and residential sectors as an illustration. The
relationship between industrial gas demand and GDP growth since 2000 has been very close, with the
average growth of the former divided by the latter being 1.0, while the correlation has also been
relatively tight with an r2 of 0.72. By contrast the average movement of residential gas demand versus
GDP growth has been a much lower 0.47 over the same period, with an r2 of 0.17 – essentially very
little correlation.
Figure 2.5: Relationship between GDP growth and gas demand growth in global power
generation and industrial sectors (gas demand growth/GDP growth, 1991-2017)
7.00
6.00
5.00
4.00
3.00
2.00
1.00
0.00
1995
1996
1997
1998
1991
1992
1993
1994
1999
2000
2001
2002
2003
2004
2005
2006
2007
2008
2009
2010
2011
2012
2013
2014
2015
2016
2017
-1.00
-2.00
-3.00
Industry Residential
Linear (Industry) Linear (Residential)
Source: Data from World Bank and BP Statistical Review of World Energy, analysis by OIES
While the conclusion from this analysis might seem rather obvious – gas demand in industry is more
correlated to economic activity than gas demand in households – it nevertheless underlines the contrast
with oil demand (where use in one sector dominates demand) and also encourages a closer look at the
sectoral breakdown of gas demand movements in an economic downturn.
Despite these caveats, though, the overall conclusion seems to be that we should not be complacent
about the impact of an economic crisis on gas demand. The residential sector may provide something
of a buffer and demand in the power sector may hold up in some countries if gas is not the main fuel of
choice or if it is very competitive on price as, for example, is the current situation in the US, where low
gas prices continue to encourage a switch away from coal use in the power sector. However, more
broadly the examples of 1998, 2001 and 2008/09 suggest that gas demand will fall sharply in 2020 and
will only rebound once the global economy starts to recover in a meaningful manner.
The next section examines the trends evident in the data from the first 4 months of 2020, while section
2.3 examines some of the regional differences that have been alluded to above. Section 2.4 then looks
at the question of whether the gas market might experience a phenomenon similar to the oil market in
April 2020, namely a storage crisis and a dramatic fall in prices, while section 2.5 considers potential
medium- and longer-term consequences for the gas sector as a result of the pandemic.
James Henderson (james.henderson@oxfordenergy.org)
The contents of this paper are the authors’ sole responsibility. They do not necessarily represent the views of the Oxford
Institute for Energy Studies or any of its Members.
132.2 Supply to Europe and implications for storage
Introduction
This analysis of the supply-side picture in Europe examines whether the COVID-19 lockdowns have
had a significant impact on European gas supplies, in the form of pipeline imports, LNG imports, and
net storage withdrawals, and therefore by implication on gas consumed by customers in Europe. The
focus is on the most recent data for April 2020, with additional consideration being given to
developments in Q1-2020 to provide context. Two points of analytical comparison are made: the year-
on-year comparison with April 2019, and the short-term comparison with February 2020 (the last full
‘pre-lockdown’ month).
Pipeline gas supplies
In broad terms, 2020 began with a sharp decline in pipeline flows into Europe, 9 and those flows have
yet to recover to the levels of recent years. 10 Monthly average flows between January and April 2020
have yet to surpass 775 MMcm/d, while monthly average flows for the whole of the period 2017-2019
only dipped below that level in June 2017 and August-September 2019.
In Q1 2020, pipeline flows were, on average, 134 MMcm/d lower than in Q1 2019. The largest year-on-
year decline occurred in January 2020 (-206 MMcm/d, or -22 per cent), while the flows in February (-
111 MMcm/d, or -13 per cent) and March (-83 MMcm/d, or -10 per cent) showed smaller year-on-year
declines. However, a renewed decline emerged in April, when pipeline flows into Europe showed a
year-on-year drop of 137 MMcm/d (-15 per cent).
Figure 2.6: Monthly average pipeline flows to Europe 2017-20 (MMcm/d)
1,000
950
Apr-2018, 892 Apr-2019, 884
900
Apr-2017, 845
850
800
750
700
Quarterly average:
Q1-2017: 906 mmcm/d Q1-2018: 893 mmcm/d Apr-2020, 747
650
Q1-2019: 889 mmcm/d Q1-2020: 755 mmcm/d
600
Data source: ENTSOG Transparency Platform
The picture is one of a major year-on-year decline in January, an incomplete recovery in February and
March, and a second substantial year-on-year decline in April. Russia accounted for 77 per cent (-103
MMcm/d) of the Q1 year-on-year decline, while flows from North Africa (-28 MMcm/d) and Norway (-3
MMcm/d) fell more modestly. In April 2020, Russia (-113 MMcm/d) accounted for 83 per cent of the
9
Europe is defined here as the EU plus Switzerland and the Balkans, but minus Finland and the three Baltic states
10
This flow data covers the following: 1) From Norway to the UK, France, Belgium, Netherlands, and Germany; 2) From Russia
to Europe via Nord Stream, Belarus, Ukraine, and Turkey (at the Turkey-Bulgaria border); 3) From North Africa to Spain and
Italy. Flows from Russia to the Baltic states, Finland, and Turkey (via Blue Stream, Turkish Stream, and the Trans-Balkan
Pipeline) are excluded
The contents of this paper are the authors’ sole responsibility. They do not necessarily represent the views of the Oxford
Institute for Energy Studies or any of its Members.
14total year-on-year decline, with the remainder of the fall largely borne by North Africa (-19 MMcm/d) as
Norwegian flows declined on slightly year-on-year (-5 MMcm/d).
Detailed analysis of the data shows that Russian flows via Ukraine in Q1 2020 were down by 107
MMcm/d (-50 per cent), having fallen from 213 MMcm/d in Q1 2019 to 106 MMcm/d in Q1 2020. In
April, Russian flows via Ukraine fell by 46 per cent (-115 MMcm/d) from 250 MMcm/d in April 2019 to
135 MMcm/d in April 2020. The year-on-year decline in Russian flows may be largely explained by the
effects of the ‘non-disruption’ of Ukrainian transit, which has enabled Gazprom to draw on gas from
stocks in Europe that were no longer needed as a hedge against a possible disruption, and to reduce
its export flows via Ukraine accordingly. This was particularly felt in Q1, when storage facilities were
being operated in ‘net withdrawal’ mode.
Compared to February 2020, total pipeline flows in April 2020 were 27 MMcm/d lower (-3.5 per cent).
While Russian flows increased by 15 MMcm/d, North African flows declined by 9 MMcm/d and
Norwegian flows dropped by 33 MMcm/d. In February (the last ‘pre-lockdown’ month), pipeline flows
were lower than usual due to competition from LNG cargoes and higher storage withdrawals. In April,
storage had switched to net injections, and yet pipeline flows were even lower than in February. As
discussed below, LNG supplies increased slightly between February and April 2020, meaning that
pipeline flows suffered from both competition from LNG and a dramatic decline in demand.
LNG supplies
While LNG supplies to Europe remained within an approximate range of 80 to 160 MMcm/d between
January 2017 and September 2018, those volumes have since grown substantially. In Q1 2020, total
LNG supplies to Europe were 84 MMcm/d (+34 per cent) higher than in Q1 2019. This undoubtedly
contributed to the lower pipeline imports in Q1.
In April 2020, LNG supplies were just 1 MMcm/d (-0.3 per cent) lower than the average for April 2019,
and almost double the monthly averages for April 2017 and 2018. Notably, European LNG imports in
April 2020 (349 MMcm/d) were 14 MMcm/d (+4 per cent) higher than in February 2020 (334 MMcm/d).
This increase was not driven by higher demand for LNG in Europe, but rather by a lack of demand in
the rest of the world and LNG looking for a home in the market of last resort. In any case, that slight
increase in LNG supply failed to offset the 27 MMcm/d decline in pipeline supplies to Europe between
February and April 2020.
Figure 2.7: LNG supplies to Europe 2017-20 (monthly average MMcm/d)
400
Apr-2020, 348
Quarterly average: Apr-2019, 349
350 Q1-2017: 127 mmcm/d
Q1-2018: 107 mmcm/d
300
Q1-2019: 248 mmcm/d
250 Q1-2020: 332 mmcm/d
200
Apr-2017, 153 Apr-2018, 157
150
100
50
0
Source: Data from Platts LNG
The contents of this paper are the authors’ sole responsibility. They do not necessarily represent the views of the Oxford
Institute for Energy Studies or any of its Members.
15Pipeline and LNG supplies combined
Given the flows discussed above, it can be concluded that combined pipeline and LNG flows into
Europe in Q1 2020 (1,087 MMcm/d) were 49 MMcm/d (-4 per cent) lower than in Q1 2019 (1,136
MMcm/d) – a decline that was largely caused by the non-disruption of Russian gas transit via Ukraine
and related higher storage withdrawals, with the greatest impact occurring in January 2020.
In April 2020, combined pipeline and LNG flows were down by 138 MMcm/d year-on-year (-11 per
cent). However, it should also be noted that such supplies were 4.5 per cent higher than in April 2018
(+47 MMcm/d), and 10 per cent higher than in April 2017 (+98 MMcm/d). Compared to February 2020,
combined pipeline and LNG flows were down by 12.5 MMcm/d - a modest decline of 1.4 per cent.
Figure 2.8: Combined pipeline and LNG supplies to Europe 2017-20 (monthly average MMcm/d)
1,300
Apr-2020, 1,096
1,200
1,100 Apr-2018, 1,049
Apr-2017, 998
Apr-2019, 1,234
1,000
900
Feb-2020, 1,108
800
Quarterly average: Mar-2020, 1,124
700
Q1-2017: 1,033 MMcm/d
600 Q1-2018: 1,000 MMcm/d
Q1-2019: 1,136 MMcm/d
500
Q1-2020: 1,087 MMcm/d
400
Source: Data from ENTSOG Transparency Platform and Platts LNG
Storage
European storage peaked at a record 101.4 Bcm on 27 October 2019 and remained high to reach an
end-of-year record of 91.5 Bcm – 20 Bcm higher than at the end of 2018. Storage withdrawals in Q1
2020 were 25 per cent higher than in Q1 2019 (+78 MMcm/d, up from 314MMcm/d in Q1 2019 to
392MMcm/d in Q1 2020) despite broadly similar weather conditions. However, this still left stocks at
the end of Q1 at a record level of 56 Bcm, leaving just 47.5 Bcm of storage capacity available for filling
during the forthcoming summer.
Most importantly, though, net storage injections averaged 287 mmcm/d in April 2020. In April 2019, net
storage injections averaged 257 MMcm/d, similar to April 2018 (248 MMcm/d) and substantially higher
than April 2017 (147 MMcm/d). Therefore, storage injections in April 2020 were substantially higher
(+11%) year-on-year. For the month-by-month comparison, in January 2020 net monthly storage
withdrawals averaged 574 MMcm/d, with lower figures for February (388 MMcm/d) and March (217
MMcm/d).
The combination of higher opening stock levels, higher year-on-year storage withdrawals in Q1, and
quicker-than-average stock replenishment in April means that the European market faces the rest of
the summer with stocks already at 62.5 per cent of storage capacity – a record for the end of April. In
previous years’ stocks did not reach 62.5 per cent of storage capacity until 6 June 2019, 5 August 2018,
and 31 July 2017.
The contents of this paper are the authors’ sole responsibility. They do not necessarily represent the views of the Oxford
Institute for Energy Studies or any of its Members.
16Figure 2.9: European gas in storage 2017-20 (Bcm)
95
Q1 Net withdrawals (bcm) April net Injections (bcm)
85 2017: 38.4 2019: 28.3 2017: 4.4 2019: 7.7
2018: 47.2 2020: 35.7 2018: 7.5 2020: 8.6
75
30-Apr, 64.6
65
55 30-Apr, 49.6
45
35 30-Apr, 31.0
25
15 30-Apr, 25.6
2020 2019 2018 2017
Data source: Gas Infrastructure Europe (AGSI Platform)
Total supplies to the European market and implications for demand levels
By subtracting storage injections from (or adding storage withdrawals to) ‘domestic’ European
production plus pipeline and LNG imports to the European market, it is possible to calculate how much
gas was available to final consumers.
In Q1 2020, higher LNG imports (+84 MMcm/d) and higher storage withdrawals (+78 MMcm/d) were
not sufficient to offset the decline in production (-37 MMcm/d) and lower pipeline imports (-134
MMcm/d). Total supply dropped by 8 MMcm/d (0.4 per cent), from 1,735 MMcm/d in Q1 2019 to 1,727
MMcm/d in Q1 2020.
In April 2020, production was 33 MMcm/d lower than in April 2019, pipeline imports were 137 MMcm/d
lower, LNG imports were virtually unchanged (-1 MMcm/d), and storage injections were 29 MMcm/d
higher. Therefore, total supply fell from 1,224 MMcm/d in April 2019 to 1,024 MMcm/d in April 2020 – a
decline of 200 MMcm/d (16 per cent).
These figures are highlighted in Figure 2.6 (pipeline imports), Figure 2.7 (LNG imports), and Figure 2.9
(storage stocks) above. Below, Figure 2.10 shows the production/import/storage balance for January
to April 2019, Figure 2.11 shows the balance for January to April 2020, and Figure 2.12 shows the year-
on-year changes between 2019 and 2020.
The figures for Q1 2020 suggest that, prior to the impact of COVID-19 from mid-March, European gas
demand was relatively similar to that in Q1 2019. The major difference was in how that demand was
met. In particular, Russian pipeline flows to Europe via Ukraine declined and related storage
withdrawals increased, larger volumes of LNG flowed to Europe from an oversupplied global market,
and European production declined (mostly in the Netherlands and to a lesser extent in the UK and
Denmark).11
The figures for April 2020 compared to April 2019 are indicative of a substantial decline in demand
leading to oversupply. That implied decline in demand is consistent with the analysis of European
demand in section 2.3 of this paper, and with the scenario for European demand in Q2 2020 highlighted
11
Production data from the ENTSOG Transparency Platform and JODI Gas Database are used for the UK, Netherlands,
Romania, Germany, Poland, Italy, Ireland, Hungary, Croatia, Austria, Czechia, and France. These countries accounted for 99.9
per cent of EU gas production in 2019.
The contents of this paper are the authors’ sole responsibility. They do not necessarily represent the views of the Oxford
Institute for Energy Studies or any of its Members.
17in section 2.4. The oversupply in April 2020 would have been even greater if production had not declined
year-on-year. Although storage injections increased year-on-year to absorb some of that oversupply,
the main competition was between pipeline and LNG imports. As Figure 2.12 (below) shows, it was the
pipeline suppliers that were impacted by the decline in European gas demand, as LNG import volumes
remained almost unchanged.
Figure 2.10: Pipeline, LNG, and storage supplies in Jan-Apr 2019 (MMcm/d)
2200 2,013
2000
1,737
1800
1600 1,454
1400 1,224
1200
925 885 884
1000 855
800
559
600
300 348 287 349
400 228 278 226 273 247
200 39
0
-200
-400 -257
Jan-2019 Feb-2019 Mar-2019 Apr-2019
Production Pipe LNG Storage Total
Data source: ENTSOG Transparency Platform, Platts LNG, and Gas Storage Europe
Figure 2.11: Pipeline, LNG, and storage supplies in Jan-Apr 2020 (MMcm/d)
2000 1,865
1,754
1800
1,563
1600
1400
1200 1,024
1000
720 774 772 747
800
573
600
311 334 388 352 348
400 262 258 222 217 214
200
0
-200
-400 -287
Jan-2020 Feb-2020 Mar-2020 Apr-2020
Production Pipe LNG Storage Total
Data source: ENTSOG Transparency Platform, Platts LNG, and Gas Storage Europe
The contents of this paper are the authors’ sole responsibility. They do not necessarily represent the views of the Oxford
Institute for Energy Studies or any of its Members.
18Figure 2.12: Year-on-year change in production, pipeline, LNG, and storage supplies in 2019-
2020 (MMcm/d)
250
200 177
150 109
108
100 82
66
40
50 14 17
0
-1
-50 -20 -29
-39 -33
-51
-100
-83
-150 -111
-148 -137
-200
-206 -200
-250
Jan Feb Mar Apr
Production Pipe LNG Storage Total
Data source: ENTSOG Transparency Platform, Platts LNG, and Gas Storage Europe
Given the context of a pre-existing year-on-year decline caused by warmer temperatures, it is useful to
test the extent of the impact of the COVID-19 lockdowns in April relative to February - the last fully ‘pre-
lockdown’ month.
In February 2020, total supplies to the European market averaged 1,754 MMcm/d, falling by 730
MMcm/d to 1,024 MMcm/d in April – a decline of 42 per cent. Production (-8 MMcm/d) and LNG imports
(-4 MMcm/d) fell slightly between February and April, while pipeline imports fell by a greater amount (-
25 MMcm/d). However, it was storage that supplied a swing of 675 MMcm/d, from net withdrawals of
388 MMcm/d to net injections of 287 MMcm/d.
Given that a major determinant in the decline in gas demand between February and April of any given
year is the impact of weather-related demand, it is instructive to note that between February and April
2019, the equivalent decline in total supply was 513 MMcm/d (-30 per cent). This leads to the conclusion
that the impact of COVID-19 exacerbated the regular seasonal decline in gas demand between
February and April by an additional 217 MMcm/d – a figure broadly in line with the year-on-year decline
in total supply of 200 MMcm/d between April 2019 and April 2020.
Conclusion
In a supply-long global gas market, the dramatic decline in volumes being delivered to the European
market is undoubtedly being driven by demand-side factors, namely warmer weather and latterly the
reduction in economic activity caused by the lockdowns associated with the COVID-19 public health
crisis. The year-on-year comparison for April shows increased storage injections partially compensating
for much lower demand in a market that remained oversupplied despite the substantial decline in
pipeline supplies, a decline in European production, and almost no change in LNG supplies, leading to
an overall decline in gas supplied to the market of around 16 per cent.
Before the impact of COVID-19 was felt, the major development in Q1 2020 was the substantial year-
on-year decline in pipeline imports and increase in both LNG imports and storage withdrawals, as the
market adjusted to the ‘non-crisis’ in Ukrainian transit. The impact of COVID-19 in April has been to
keep pipeline imports down and ramp up storage injections as the market attempts to stay in balance.
The decline in day-ahead TTF prices to below $2 per MMBtu in the second half of April suggests that
market is struggling to cope with the excess supply.
The contents of this paper are the authors’ sole responsibility. They do not necessarily represent the views of the Oxford
Institute for Energy Studies or any of its Members.
19Comparing April 2020 to the immediate ‘pre-lockdown’ period, the picture is one of storage providing
the swing as production, pipeline imports, and LNG imports only fell very slightly between February and
April. The role of storage in absorbing excess supply in an oversupplied market will remain key, given
the likely market conditions of continued suppressed demand and plentiful supply throughout the
summer of 2020. The ability of storage facilities to absorb excess supply will decrease considerably
throughout Q2 as capacity is filled from its already-high levels. In May-July 2019, net storage injections
averaged 382 MMcm/d. With 38.9 Bcm of total European storage capacity currently remaining unfilled,
storage injections at a similar rate would see European storage completely full by early August, that is,
long before the end of Q3.
The main conclusion to be drawn is that if demand remains depressed as storage reaches full capacity,
the competition between pipeline and LNG supplies will intensify with the result being severe downward
pressure on prices. Therefore, the risk of the European gas market repeating the American oil
experience of supply overwhelming demand in the context of limited storage, resulting in the collapse
of prices from already low levels, will most likely occur in Q3 2020.
Jack Sharples (jack.sharples@oxfordenergy.org)
The contents of this paper are the authors’ sole responsibility. They do not necessarily represent the views of the Oxford
Institute for Energy Studies or any of its Members.
20You can also read