2018 Economic Forecast for Metro Denver - January 2018 Including Adams, Arapahoe, Boulder, Broomfield, Denver, Douglas, and Jefferson Counties
←
→
Page content transcription
If your browser does not render page correctly, please read the page content below

2018 Economic Forecast
for Metro Denver
Including Adams, Arapahoe, Boulder,
Broomfield, Denver, Douglas, and Jefferson
Counties

January 2018

Prepared By:
Development Research Partners specializes in economic research and analysis for local and state
government and private sector businesses. Founded in 1994, Development Research Partners
combines extensive experience in real estate economics and economic development to provide clients
with reliable consulting services in four areas of expertise:
Economic and Demographic Research
Research in support of business and community activities, ranging from community profiles to
evaluating and forecasting economic and market conditions.
Industry Studies
Specialized research projects including industry cluster research, industry trends analysis, and
strategic competitive analysis.
Fiscal and Economic Impact Analysis
Comprehensive custom analysis and analytical tools to evaluate and forecast site‐specific
activities and model business and government costs and benefits.
Real Estate and Public Finance Economics
Analysis and strategy for infill redevelopment, adaptive reuses, and property development
including market and feasibility studies, public investment analysis, and public‐private
partnering opportunities.
Patty Silverstein, President & Chief Economist
David Hansen, Senior Economist
10184 West Belleview Avenue, Suite 100
Littleton, Colorado 80127
www.DevelopmentResearch.net
303.991.0070
TABLE   OF
  Table of   CONTENTS
           Contents
EXECUTIVE SUMMARY ................................................................................................................................. i
U.S. ECONOMY ............................................................................................................................................ 1
   International Economy ................................................................................................................................................ 1
   Gross Domestic Product .............................................................................................................................................. 2
      Household Spending .......................................................................................................................................................... 2
      Business Spending .............................................................................................................................................................. 5
      Government Spending ....................................................................................................................................................... 6
      Net Exports ......................................................................................................................................................................... 7
   Interest Rates.............................................................................................................................................................. 7
   Employment & Unemployment ................................................................................................................................... 8
   Income ........................................................................................................................................................................ 9
   Inflation ...................................................................................................................................................................... 9
   National Business Cycle ............................................................................................................................................. 10
COLORADO ECONOMY.............................................................................................................................. 12
   Employment & Unemployment ................................................................................................................................. 13
   Colorado Exports ....................................................................................................................................................... 16
   Population ................................................................................................................................................................ 17
   Income & Spending ................................................................................................................................................... 17
   Inflation .................................................................................................................................................................... 18
METRO DENVER ECONOMY ...................................................................................................................... 20
   Population ................................................................................................................................................................ 21
   Income ...................................................................................................................................................................... 22
   Residential Real Estate .............................................................................................................................................. 23
   Employment & Unemployment ................................................................................................................................. 25
   Industry Overviews ................................................................................................................................................... 27
      Natural Resources & Construction ................................................................................................................................... 27
      Manufacturing .................................................................................................................................................................. 32
      Wholesale & Retail Trade ................................................................................................................................................. 33
      Transportation, Warehousing & Utilities ......................................................................................................................... 34
      Information ...................................................................................................................................................................... 35
      Financial Activities ............................................................................................................................................................ 35
      Professional & Business Services ..................................................................................................................................... 36
      Education & Health Services ............................................................................................................................................ 37
      Leisure & Hospitality ........................................................................................................................................................ 38
      Other Services .................................................................................................................................................................. 39
      Government ..................................................................................................................................................................... 39
   Industry Clusters ....................................................................................................................................................... 40
DATA APPENDIX ........................................................................................................................................ 45
REFERENCES .............................................................................................................................................. 46

                                                Metro Denver Economic Development Corporation | January 2018
Executive Summary
U.S. Economy
The United States continued on an expansionary path through 2017 with gross domestic product growing at a
2.3 percent pace, employment increasing by 1.5 percent, and the unemployment rate falling to 4.4 percent. The
nation’s businesses generated more than 2.1 million jobs, consumer confidence exceeded pre‐recession peaks,
there was continued wage growth, and strong business investment activity.
While gross domestic product grew at a pace slower than the historic average since 1980 of 2.7 percent, growth
in 2017 accelerated from the 1.5 percent pace posted in 2016 and was faster than the average since 2010 (2.1
percent). The improvement in 2017 was partially due to stabilized oil and gas prices that had impacted
employment in several energy‐producing states and affected oil and gas investment activity and corporate
profits. Gross domestic product will grow at a 2.4 percent pace in 2018 as the country enters its ninth year of the
current economic expansion. Gross domestic product will be boosted by the recent tax reform act that was
passed in December 2017 that will influence disposable personal income and business investment activity. The
unemployment rate is expected to fall to 4.3 percent while employment growth slows to 1.2 percent as a result
of tight labor markets and persistently low labor force participation rates.
Inflation accelerated at the beginning of the year before falling back below the Federal Reserve’s medium‐term
objective by the end of the year. Inflation is expected to post a stable, 2 percent rate in 2018. While the low
unemployment rate and wage growth will contribute to inflationary pressure, the Federal Reserve is expected to
continue to increase the target federal funds rate. The Federal Reserve announced three rate hikes in 2017,
increasing the target rate to a 1.25 percent to 1.5 percent range. Additionally, the Federal Reserve announced in
October 2017 that it began the process of shrinking its balance sheet that grew to historic levels during the
Great Recession. Oil prices are expected to average about $56 per barrel and prices of medical care and housing
will continue to grow faster than average.
The greatest risks to U.S. economic growth include the possible renegotiation of NAFTA and trade agreements
with China, Asia, and the European Union. International political tension is also a risk with escalating tension
with North Korea and ongoing conflicts in the Middle East. Additionally, unexpected increases or decreases in
energy prices remain a risk as well as the speed and pace that the Federal Reserve normalizes its balance sheet.
As these risks influence business and consumer confidence, which in turn influence overall spending patterns,
stability in these situations is needed for the U.S. expansion to remain on track.
Colorado Economy
The pace of growth in Colorado will likely slow in 2018 as net migration tapers gradually and the unemployment
rate remains near historic lows. Still, Colorado will likely be among the top 10 states for employment growth
during 2017. Employment is anticipated to increase 2.2 percent in 2017 and 1.9 percent in 2018. In 2018,
employment will reach 2.71 million workers, representing the addition of 50,500 jobs from 2017 to 2018. The
unemployment rate fell to 2.6 percent in 2017 and will rise to an anticipated 2.7 percent in 2018. As companies
consistently increased staffing levels, and Colorado’s labor force continued to tighten, the unemployment rate in
2017 reached its lowest monthly and annual levels in the history of the data series going back to 1976. The
previous monthly low was recorded in October 2000, which was 0.2 percentage points higher than the 2.2
percent rate posted in August 2017. Colorado is expected to benefit from in‐migrants, but as labor markets
tighten across the country, net migration in Colorado is expected to slow.
Professional and business services, education and health services, and leisure and hospitality are anticipated to
contribute the most to absolute employment growth in 2018. All eleven supersectors in Colorado are expected
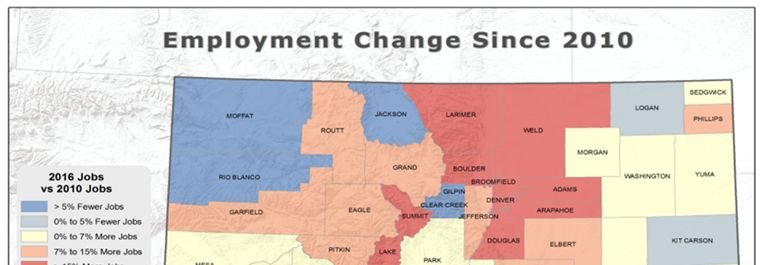
to add employment in 2018. The fastest growing regions in the state were along the Front Range. In 2017, the
Metro Denver Economic Development Corporation | January 2018 | Page i
Executive Summary
Greeley MSA was once again one of the fastest growing metro regions in the state while Grand Junction has
continued to struggle since the Great Recession.
Total personal income increased a robust 4.1 percent in 2017 due to increasing wages, rising housing and asset
prices, and higher transfer payments. The pace of growth will increase to an estimated 5 percent in 2018. Low
unemployment and rising personal income bode well for consumer confidence and spending activity in 2018.
Retail trade sales increased by about 4.9 percent in 2017 and are expected to post a 4.7 percent increase in
2018. Overall, the Colorado economy is expected to have another strong year of growth in 2018.

Metro Denver Economy
Metro Denver recorded a strong year of growth in 2017 with rising employment levels and falling
unemployment rates. However, the pace of growth is slowing as population growth slows and tight labor
markets limit employment growth. Net migration levels in Metro Denver remain strong, but have declined from
peak 2015 levels. Job growth in 2017 pushed down the unemployment rate in Metro Denver to 2.5 percent, the
lowest level recorded since 2000 (2.6 percent). The rate fell as low as 2.1 percent in August, but increased to 2.8
percent in November. The pace of Metro Denver job gains slowed during 2017, finishing out the year with 2.1
percent growth and the addition of 33,300 jobs.
All of Metro Denver’s 11 supersectors recorded employment growth between 2016 and 2017. Additionally,
Metro Denver’s key industry clusters recorded robust and broad‐based growth over the past year. The three
supersectors that added the most jobs in 2017 were professional and business services, leisure and hospitality,
and natural resources and construction. The fastest growing supersectors were the transportation, warehousing,
and utilities supersector, the other services supersector, and the natural resources and construction
supersector. Growth in transportation, warehousing, and utilities was particularly strong as airlines at Denver
International Airport recorded strong employment growth and several companies have opened large
distribution and fulfillment centers in response to demand for e‐commerce. Another notable growth sector was
computer systems design and software engineering that represented one of the strongest areas of growth in
professional and business services.
The residential real estate market continued at a strong pace in 2017. Metro Denver home sales increased 2.9
percent in 2017 from 2016 home sales, and posted a new record high. In addition, the median home price
continued to rise through 2017 as low inventory and population growth drove up prices. According to the S&P
CoreLogic Case‐Shiller Index, home prices in Metro Denver have increased year‐over‐year for 71 consecutive
months. Meanwhile, commercial construction activity in the office and industrial markets may be approaching a
peak. According to a measure of market cycles, Denver’s office market was still in an expansionary phase, while
industrial moved further into hypersupply. The retail market appears to be at an equilibrium level. In 2017,
construction in the retail sector was close to its long‐run average.
Looking ahead, employment will increase 1.9 percent in 2018 with gains in all 11 supersectors. Once again, the
transportation, warehousing, and utilities supersector will record the fastest pace of growth, followed by the
natural resources and construction and the education and health services supersectors. The unemployment rate
is expected to move up slightly to 2.6 percent in 2018 and remain near historic lows. Home sales activity is
expected to fall in 2018 after six consecutive years of increases, declining by an estimated 1.5 percent. Overall,
slower net migration activity, lower affordability, and higher interest rates should temper home price growth in
2018. Home price growth is expected to slow to 5 percent, similar to a national rate. The pace of construction
activity will remain strong in 2018 as several million square feet of office and industrial space will continue to
bolster the market. Additionally, large scale infrastructure projects and other public/nonprofit investment
activity will continue at a robust pace. The Metro Denver region’s eighth consecutive year of expansion will
provide diverse employment opportunities and increasing housing options for its 3.2 million residents.

                               Metro Denver Economic Development Corporation | January 2018 | Page ii
U.S.U.S.
     ECONOMY
         Economy
The United States continued on an expansionary path through 2017 with gross domestic product growing at a
2.3 percent pace, employment increasing by 1.5 percent, and the unemployment rate falling to 4.4 percent. The
nation’s businesses generated more than 2.1 million jobs, consumer confidence exceeded pre‐recession peaks,
there was continued wage growth, and strong business investment activity.
While gross domestic product grew at a pace slower than the historic average since 1980 of 2.7 percent, growth
in 2017 accelerated from the 1.5 percent pace posted in 2016 and was faster than the average since 2010 (2.1
percent). The improvement in 2017 was partially due to stabilized oil and gas prices that had impacted
employment in several energy‐producing states and affected oil and gas investment activity and corporate
profits. Gross domestic product will grow at a 2.4 percent pace in 2018 as the country enters its ninth year of the
current economic expansion. Gross domestic product will be boosted by the recent tax reform act that was
passed in December 2017 that will influence disposable personal income and business investment activity. The
unemployment rate is expected to fall to 4.3 percent while employment growth slows to 1.2 percent as a result
of tight labor markets and persistently low labor force participation rates.
Inflation accelerated at the beginning of the year before falling back below the Federal Reserve’s medium‐term
objective by the end of the year. Inflation is expected to post a stable, 2 percent rate in 2018. While the low
unemployment rate and wage growth will contribute to inflationary pressure, the Federal Reserve is expected to
continue to increase the target federal funds rate. The Federal Reserve announced three rate hikes in 2017,
increasing the target rate to a 1.25 percent to 1.5 percent range. Additionally, the Federal Reserve announced in
October 2017 that it began the process of shrinking its balance sheet that grew to historic levels during the
Great Recession. Oil prices are expected to average about $56 per barrel and prices of medical care and housing
will continue to grow faster than average.
The greatest risks to U.S. economic growth include the possible renegotiation of NAFTA and other trade
agreements with China, Asia, and the European Union. International political tension is also a risk with escalating
tension with North Korea and ongoing conflicts in the Middle East. Additionally, unexpected increases or
decreases in energy prices remain a risk as well as the speed and pace that the Federal Reserve normalizes its
balance sheet. As these risks influence business and consumer confidence, which in turn influence overall
spending patterns, stability in these situations is needed for the U.S. expansion to remain on track.

International Economy
According to the International Monetary Fund (IMF), global economic activity is strengthening and is expected
to continue in 2018. The IMF expects the global growth rate to average 3.6 percent in 2017, higher than the 3.2
percent pace in 2016. In 2018, growth is expected to accelerate to 3.7 percent. The positive outlook is based in
part on better than expected growth in the euro area, Japan, emerging Asia, emerging Europe, and Russia.
Growth is expected for both advanced economies and emerging markets, characterized by strong investment,
trade, and industrial production concurrent with stronger business and consumer confidence. Economic growth
in the advanced economies is expected to rise to 2.2 percent in 2017 and remain at 2.2 percent in 2018.
Meanwhile, monetary policy in both Japan and the euro area continues to be accommodative. On a negative
note, the IMF revised down the outlook for the United Kingdom where growth through the first half of 2017
slowed more than anticipated. Consumption growth and real household incomes are slowing in the United
Kingdom and there is uncertainty about trade, migration, and financial activity associated with upcoming
negotiations concerning Brexit.
The value of output in the emerging economies is expected to grow from 4.6 percent in 2017 to 4.9 percent in
2018. In China, growth will be supported by policy reforms and from expansionary fiscal policy and high levels of
public investment. Emerging economies have been bolstered by a recovery in commodity prices and stable

                              Metro Denver Economic Development Corporation | January 2018 | Page 1
U.S.U.S.
     ECONOMY
         Economy
financial markets. Additionally, growth is expected to pick up slightly in Brazil and Latin America, and Russia
emerged from a two‐year recession.

Gross Domestic Product
Throughout this publication, (e) is used to represent data that are estimated in the absence of data for all 12
months of 2017; (f) indicates a forecast figure.
Gross Domestic Product: +2.3 percent in 2017(e); +2.4 percent in 2018(f).
Gross domestic product (GDP)—the total
value of goods and services produced in the
U.S. economy—is a key gauge of the nation’s
economic health. Between 1980 and 2000,
annual GDP growth averaged about 3.4
percent. From 2000 to 2016, annual growth
has averaged a much lower 1.8 percent due
to a number of factors including the Great
Recession, demographic shifts, and slower
productivity growth.
More currently, real GDP growth has
averaged 2.1 percent between 2010 and
2016. National real GDP reported 15
consecutive quarters of growth between the
second quarter of 2014 and the fourth
quarter of 2017. Positive contributors to GDP growth over the past year included consumption of durable goods,
nonresidential fixed investment, and exports. Notably, nonresidential fixed investment and exports reported
growth in 2017, reversing contractions in 2016. Nonresidential fixed investment was boosted by investment in
structures, and strong growth in intellectual property products, such as software and research and
development. With strong personal consumption and continued business spending, annual growth is forecast to
be 2.3 percent in 2017 and accelerate to 2.4 percent in 2018.
Reasons for increased growth are easier to recognize when GDP is broken down into its four components: 1)
household spending on goods and services; 2) business spending on software, equipment, and real estate; 3)
government spending on goods and services; and 4) net exports, or foreign purchases of U.S. goods less our
imports.
Household Spending
Household spending contributes nearly 70 percent of national output and has a long‐term average annual
growth rate of about 2.7 percent. In 2017, consumer confidence was more than 16 percent higher on average
than levels posted in 2007, and the unemployment rate dropped to its lowest level since 2000. Consumer‐
spending growth in 2017 continued at a pace similar to 2016, with positive growth expected in 2018. Several
factors will influence consumer spending in the year ahead.
Strong consumer confidence. Consumer confidence improved markedly in 2017, reaching well above levels
posted in 2016 and exceeding pre‐recession peaks. Consumers’ assessment of their present situation continued
to improve throughout 2017, including perceptions of business conditions and the availability of jobs. The
exception was a dip due to hurricanes Harvey and Irma. Consumers’ expectations also improved in 2017 and the
overall outlook is optimistic heading into 2018.

                               Metro Denver Economic Development Corporation | January 2018 | Page 2
U.S.U.S.
     ECONOMY
         Economy
Positive financial situation. According to
the latest Economy and Personal Finance
Survey from Gallup, Americans’
assessment of their current financial
situation continued on an upward trend
in 2017 and recorded its highest level
since 2007. Fifty‐two percent of U.S.
adults said their current financial
situation was excellent or good. The rate
had remained at or below 50 percent
from 2008 to 2016.
Tax reform increases disposable
personal income. The Tax Cuts and Jobs
Act (TCJA) recently passed by Congress is
expected to boost the after‐tax income
of most filers beginning in 2018,
generating a positive effect on personal consumption expenditures. The TCJA reduces the individual income tax
rate in five of the lower tax brackets and reduces the top rate to 37 percent from 39.6 percent. In addition, the
TCJA doubles the standard deduction. The higher standard deduction will lower taxable income for some filers
depending on their level of personal exemptions. Another boost to filers is an expansion of the child tax credit,
which according to the Tax Foundation, will increase from $1,000 to $2,000 while increasing the phase out from
$110,000 to $400,000 for married couples. Analysis from the Tax Policy Center estimates that after‐tax incomes
will increase in 2018 by as much as 4 percent for some filers. At a macro level, the Tax Foundation estimates that
the after‐tax incomes of all taxpayers will increase by 1.1 percent in the long run.
Tax reform may also increase the labor supply. The Joint Committee on Taxation notes that tax policies change
the incentives for potential workers to supply labor to the economy. A change in after‐tax wage income could
incentivize workers to work more, or encourage workers to enter the labor force. For instance, the Tax Policy
Center posits that the TCJA will mostly encourage lower‐earning spouses to enter the work force or work
additional hours. The increase in the labor supply will boost household incomes and stimulate aggregate
demand, thereby boosting GDP growth. The Joint Committee on Taxation estimates the TCJA will increase
consumption by 0.7 percent on average each year relative to baseline forecasts.
Wage growth continues. After years of up and down growth in average hourly earnings on an inflation‐adjusted
basis, earnings for private nonfarm employees increased at a strong rate through 2015 and 2016. Low
unemployment rates continue to contribute to positive wage pressure with real earnings growth recorded
throughout 2017. According to the Federal Reserve Bank of Kansas City, positive contributors to labor market
conditions have included job flows from unemployment to employment, hiring rates, and the percentage of
firms planning to increase employment. Labor market conditions are expected to continue to support real wage
growth for workers in 2018. The TCJA may also have a wage effect based on a reduction in the corporate income
tax rate. Economic research indicates that labor bears part of the burden of the corporate income tax, although
the amount is debated. Increased business investment may boost productivity and thereby increase wages. It
should be noted that some of these effects will occur over the long‐term rather than in the short‐run.
Home price increases adding to household wealth. According to the S&P CoreLogic Case‐Shiller home price
indices, the national home index was up 6.2 percent between November 2016 and 2017. According to the index,
national home prices surpassed their pre‐recession peak set in 2006 by September 2016. The increase in housing
prices provides a wealth effect to homeowners. Many homeowners utilized stronger home values and low

                               Metro Denver Economic Development Corporation | January 2018 | Page 3
U.S.U.S.
     ECONOMY
         Economy
interest rates for cash‐out refinancing and second mortgages. Data from Freddie Mac indicate the volume of
cash‐out refinancing continued to grow in 2017, increasing more than 13 percent year‐to‐date through the
second quarter of 2017 compared with the same quarters in 2016. Cash‐out refinancing peaked in 2006 at
$320.5 billion compared with $61.2 billion in 2016. Meanwhile, owners’ equity in real estate as a percent of
value continued to climb, approaching 60 percent or near levels typical of the 1990s and early 2000s. The
percentage had dipped as low as 36 percent during the Great Recession.
Equities contributing modestly to household wealth. The stock market is an economic indicator that is
influenced by daily fluctuations in the economy. In 2017, stocks recorded their highest gains since 2013.
Volatility in the market remained low throughout the year with the S&P 500 increasing 20 percent over‐the‐
year, the NASDAQ increasing 28.2 percent, and the Dow Jones Industrial Average up 25.7 percent. In 2017, more
American’s were investing in the stock market, but levels were much lower than before the recession. About 54
percent of American adults were invested in the stock market in 2017, up from 52 percent in 2016, according to
Gallup’s annual Economy and Personal Finance survey. However, stock ownership since 2009 is much lower than
pre‐recession levels. The average from 2009 to 2017 was 54 percent, down 8 percentage points from a 62
percent average from 2001 to 2008. Based on the survey, stock ownership rates for middle‐class adults and all
                                                                    age groups 64 years and below are
                                                                    significantly lower.
                                                                      The TCJA is expected to boost the stock
                                                                      market in 2018. A key provision of the law is a
                                                                      reduction in the corporate income tax rate
                                                                      from 35 percent to 21 percent. The law also
                                                                      allows businesses to immediately deduct new
                                                                      investment over the next five years. These
                                                                      provisions are expected to boost business
                                                                      investment and profits that may increase the
                                                                      value of equities and amount of dividend
                                                                      payouts. While taxes have only a modest
                                                                      influence on company earnings and
                                                                      valuations, the effect is likely positive.
                                                                    Household borrowing activity strengthens,
but the debt‐service ratio is stable. After the housing bubble burst in 2007, total household debt plunged
compared with prior years. The housing component of the recession heavily influenced the mortgage debt
portion of household debt. Growth in household debt has been positive since the fourth quarter of 2011.
Growth in mortgage debt turned positive in 2013 and continued to increase through 2017. Consumer credit also
continued to expand through 2017. Despite more household borrowing activity, the ratio of household debt
service to disposable personal income remained below 10 percent through 2017, well below the high of 13.2
percent in the fourth quarter of 2007.

                              Metro Denver Economic Development Corporation | January 2018 | Page 4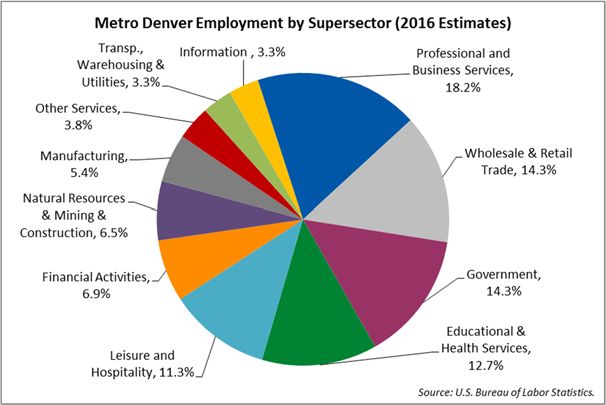
U.S.U.S.
     ECONOMY
         Economy
Business Spending
During the Great Recession, corporate profits
took a major hit as consumers purchased less
goods and services, investors were cautious
of further economic declines, and Wall Street
reeled from the impact of the housing crisis.
Since the low of 2008, corporate profits
surpassed the pre‐recession peak in January
2010. Corporate profits slumped after the
fourth quarter of 2014, dipping by about 17
percent by the fourth quarter of 2015. Falling
energy prices affected profits of oil and gas
companies that were among the nation’s
most profitable for many years. Additionally,
profits were impacted by a weak global
economy and strong dollar that influenced
exports, which fell 2.5 percent in real terms from the fourth quarter of 2014 to the first quarter of 2016. As oil
and gas prices stabilized, profit levels rebounded in 2016 and continued to grow in 2017, surpassing the fourth
quarter 2014 level. Corporate profits were also bolstered by continued growth in exports. Profits are expected
to remain on a generally positive trend through 2018.
Another factor that will influence business investment in 2018 is the passage of the TCJA. An analysis by the Tax
Policy Center on the macroeconomic effects of the TCJA estimated that the law would improve businesses’ cash
flow, boost near‐term investment activity, and stimulate aggregate demand and GDP. Another effect could
include an influx of foreign capital. The Joint Committee on Taxation estimates that the amount of capital
available for production will be 0.9 percent higher than baseline forecasts. Combined with individual income tax
reforms, various tax analysts expect the new tax law to boost GDP by anywhere from 0.4 percent to 0.8 percent
per year over the next few years. The gains in GDP and investment are expected to fade over time as the
individual rate reductions expire and the near‐term expensing provisions sunset after five years. Additionally,
the larger deficits resulting from the legislation are expected to dampen investment in the long‐term and
increase interest rates. In addition, the fact that TCJA was passed during an economic expansion may limit the
stimulating effects of the law.
After a slowdown in real nonresidential private fixed investment in 2016, growth increased at an estimated 4.1
percent annualized rate year‐to‐date through the third quarter of 2017 compared with the first three quarters of
2016. Investment in 2017 was characterized by broad‐based increases in investment for structures, equipment,
and intellectual property. Investment in structures declined throughout 2015 and 2016, due in large part to the
oil and gas contraction. Investment in exploration, shafts, and wells, which includes oil and gas, rebounded with
a nearly 50 percent increase year‐to‐date through the third quarter of 2017 compared with 2016. Growth in
commercial and healthcare structures was also strong. Investment in equipment rose in 2017 after falling in
2016, with companies investing in computers and peripheral equipment and industrial equipment. Intellectual
property investments increased with strong growth in software and continued growth in R&D.

                               Metro Denver Economic Development Corporation | January 2018 | Page 5
U.S.U.S.
ECONOMY
Economy
Government Spending
According to the Congressional Budget Office
(CBO), the federal budget deficit for fiscal
year 2017 is forecast to be $690 billion as of
June 2017, 19 percent higher than 2016. The
federal deficit as a percentage of GDP is
projected to increase to 3.6 percent, marking
the second year of increase after six
consecutive years of declines since peaking at
9.8 percent in 2009. In 2018, the CBO
estimates the deficit will decrease to $560
billion, and comprise only 2.8 percent of GDP.
Despite the decline in 2018, the deficit is
expected to resume its growth trend in
subsequent years.
According to the CBO’s economic forecast, which serves as the basis for its budget projections, the larger deficit
in 2017 was partially due to weak tax collections that increased more slowly than outlays. Concurrently, outlays
grew due to higher education and housing subsidies. Federal outlays in 2017 comprised a higher percentage of
GDP than 2016, increasing from 20.7 percent to 21 percent. Outlays are projected to fall to 20.5 percent of GDP
in 2018 before rising back to more than 21 percent of GDP in 2019. The decrease in 2018 is mainly due to
accounting procedures rather than a change in trend. Overall, the CBO expects that the economy will expand at
a solid pace through 2018 with continued increase in the demand for workers, a tight labor market, and
modestly rising inflation.
The size of the federal budget deficit will be impacted by the TCJA. The Joint Committee on Taxation estimates
the TCJA will increase the budget deficit by about $1.1 trillion from 2018 to 2027. The Tax Policy Center
estimates that the legislation will increase the federal budget deficit between $1.5 trillion and $1.8 trillion. The
persistently larger budget deficits will increase the U.S. debt level. Tax Policy Center analysts estimate the law
will raise the federal debt to GDP ratio by an estimated 5.5 to 6.3 percentage points. The increased deficit and
federal debt may dampen economic growth over time through crowding out of investment activity and
increased interest rates.
The International Monetary Fund’s (IMF) World Economic Outlook Database reports that the U.S. government
gross debt in 2017 was estimated to be more than 108 percent of GDP, the fifth highest rate of the world’s
advanced economies. The IMF estimates that gross debt will remain at about 108 percent of GDP in 2018. Major
countries with the highest gross debt are Japan (240 percent), Greece (180 percent), Italy (133 percent), and
Portugal (126 percent). In terms of net debt, or gross debt less the value of financial assets, the U.S. has the
eighth highest rate at an estimated 82.5 percent of GDP in 2017. Net debt is projected to contract slightly to
81.1 percent of GDP by 2018.
State and local government consumption expenditures and gross investment slowed in 2017, recording no
growth for the year. While there was moderate growth in consumption expenditures, a category that comprises
about 83 percent of total state and local government spending, gross investment contracted by about 4.5
percent. Looking ahead, the CBO expects state and local governments to contribute little to the growth of
output through 2018.
According to the 2015 Census of Government: Annual Surveys of State and Local Government Finances, the
major sources of general revenue for state and local governments are taxes (46 percent), current charges (20
Metro Denver Economic Development Corporation | January 2018 | Page 6U.S.U.S.
ECONOMY
Economy
percent), intergovernmental (19 percent), and insurance trust (9 percent). Major expenditures for state and
local governments are education (28 percent), public welfare (18 percent), insurance trust (10 percent), and
public safety (7 percent).
Net Exports
In 2017, net exports subtracted a slightly
larger share from GDP than was recorded in
2016. Net exports peaked in 2005 at ‐5.5
percent of GDP. However, since 2010 net
exports have comprised about ‐3 percent of
GDP on average, falling to as low as ‐2.6
percent in 2013, and rising as high as ‐3.5
percent in 2016. Trade volumes of both
imports and exports fell in 2015 and 2016.
However, the trade volume of imports and
exports increased in 2017, with imports
increasing at a faster pace than exports,
leading to a growing trade deficit.
Major U.S. exports include transportation equipment, computers and electronic products, chemical products,
and machinery. The nation’s largest trading partners in terms of exports are Canada, Mexico, China, Japan, and
the United Kingdom. Contracting U.S. export activity in 2015 and 2016 coincided with a strengthening dollar.
The value of the dollar peaked in December 2016 and fell throughout the first three quarters of 2017,
contributing to growing export activity. The stronger global economy is anticipated to support growing export
activity in 2018.
Interest Rates
Prime rate: 4.1 percent in 2017; 4.9 percent in
2018(f).
Since December 2015 the Federal Reserve
has gradually increased the target federal
funds rate, eventually maintaining a target
range between 1.25 and 1.5 percent in late
2017. The December 2017 conference of the
Federal Open Market Committee (FOMC)
reported that while hurricane‐related
disruptions affected economic activity, they
did not change the outlook for the national
economy. Economic activity has expanded at
a solid pace and the labor market has been
strong with a declining unemployment rate. The committee reported that household spending has been rising
moderately and business fixed investment picked up. Inflation declined in the latter part of 2017 and the rate is
still below the committee’s longer‐run objective of 2 percent. However, longer‐term inflation expectations were
little changed. The FOMC still expects economic conditions will warrant gradual increases in the federal funds
rate in 2018.
Metro Denver Economic Development Corporation | January 2018 | Page 7U.S.U.S.
ECONOMY
Economy
The federal funds rate, or the rate on short‐term loans between banks, and the prime rate offered by banks for
short‐term business loans, are highly correlated. Since January 2016, the mean prime interest rate has averaged
about 3.1 percentage points above the federal funds rate. Analysts anticipate three additional federal funds rate
increases in 2018. As economic conditions remain strong, the outlook for the prime interest rate is 4.9 percent
for 2018.
Employment & Unemployment
Employment: +1.5 percent in 2017(e); +1.2
percent in 2018(f).
Unemployment: 4.4 percent in 2017(e); 4.3
percent in 2018(f).
U.S. employment continued to grow in 2017,
but at a slower rate of 1.5 percent compared
with 1.7 percent in 2016. 2017 marks the
seventh consecutive year of employment
growth since contracting in 2010. The pace of
job growth has declined as the
unemployment rate continued to fall and the
labor force participation rate remained near
40‐year lows. The labor force participation rate was up slightly from 2016, averaging 62.9 percent year‐to‐date
through November 2017 compared with a monthly average of 62.8 percent in 2016. Meanwhile, the U.S.
unemployment rate averaged 4.4 percent in 2017, its lowest annual average since 2000. In 2017, the median
number of weeks individuals over the age of 16 remained unemployed ranged from 10 to 10.6 weeks, which was
down from 11.6 weeks recorded in July 2016. Unemployment duration peaked at 25.8 weeks in April 2010.
The Manpower Employment Outlook Survey
found hiring expectations in the U.S.
remained strong for the first quarter of 2018
compared with the prior quarter, with U.S.
employers reporting their strongest first
quarter hiring intentions in 10 years. The
percentage of employers planning to increase
employment levels remained at 21 percent
between the fourth quarter of 2017 and the
first quarter of 2018. The percentage of
companies planning to reduce employment
levels decreased to 5 percent compared with
6 percent a year ago and in the last quarter.
The percentage of companies planning to
maintain staffing levels (71 percent) was 2
percentage points lower than the prior year’s level. Survey analysts noted that employers in all 13 industry
sectors expected to add staff in the first quarter of 2018. The top industries were leisure and hospitality and
transportation and utilities. For transportation and utilities specifically, job prospects were the strongest
reported since the survey started in the first quarter of 1982. Additionally, a positive outlook was recorded in all
four regions in the U.S., with the Midwest posting its strongest outlook since the beginning of 2001.
Metro Denver Economic Development Corporation | January 2018 | Page 8U.S.U.S.
ECONOMY
Economy
Income
Total Personal Income: +3.1 percent in
2017(e); +4.2 percent in 2018(f).
Personal income has several components:
earnings from work, asset‐based income, and
government social insurance (transfer)
payments. Personal income growth slowed in
2016 due to a number of factors including
slower wage and salary growth, a drop in
asset‐based income, and lower growth in
transfer receipts. However, as the
unemployment rate continued to fall in 2017,
the tight labor market led to an increase in
employee compensation. Additionally, the
push for higher minimum wages in many areas of the country may have supported higher wage levels. Twenty‐
nine states have a minimum wage higher than the federal minimum. In 2017, nineteen states began the year
with higher minimum wages that were automatically increased based on cost of living, enacted from previous
legislation, or raised through ballot initiatives. In many cases, increases will be phased in over several years and
will far outpace inflation. Additionally, proprietors’ income increased at its fastest rate in three years and asset‐
based income rebounded. The tight labor market is anticipated to lead to wage gains in 2018.
Overall, total personal income increased 3.1 percent in 2017. Growth is expected to accelerate in 2018 to 4.2
percent.
Inflation
Consumer Price Index: +2.1 percent in 2017; +2.0 percent in 2018(f).
The Federal Reserve target inflation rate is 2 percent in the medium‐term, and the average in 2017 increased to
2.1 percent from 1.3 percent in 2016. Core inflation, which is total inflation less food and energy, increased at a
2.2 percent annual rate in 2016, but fell to a lower 1.8 percent rate in 2017. Overall inflation was boosted by
more stable energy prices in 2017. In 2016, there was an 11 percent decline in the average crude oil price,
following a 48 percent decline in 2015. However, the average price year‐to‐date in 2017 was about 19 percent
higher than the same months in 2016. The average monthly price bottomed out in February 2016 at about
$30.00 per barrel based on data from the U.S. Energy Information Administration (EIA). Prices in 2017 have
fluctuated between about $45 and $57 per barrel.
Looking ahead, the most recent EIA forecast of crude oil prices predicts an average of about $56 per barrel in
2018. While U.S. production is expected to increase at a much faster pace in 2018 than domestic consumption, a
strengthening global economy and growth in exports will support prices. Further, OPEC is expected to extend
production cuts through 2018.
Based on year‐to‐date price appreciation for separate components of the consumer price index, housing and
medical care are also contributing to stronger inflation in 2017. Over the past five years, prices in the housing
index have increased at a 2.2 percent annual rate. However, year‐to‐date data indicate that housing is on pace
for 3 percent growth in 2017, the fastest rate since 2008. For medical care, prices have appreciated at an annual
rate of 3 percent from 2011 to 2016, much faster than the 1.3 percent annual rate for all items. In 2017, the
Metro Denver Economic Development Corporation | January 2018 | Page 9U.S.U.S.
ECONOMY
Economy
medical care index increased 2.6 percent year‐to‐date. Looking ahead, housing and medical care prices are
expected to continue to outpace overall price appreciation.
Continued monetary tightening by the Federal Reserve should moderate the pace of inflation in 2018. The
Federal Reserve announced three rate increases for its target federal funds rate in 2017, raising the range to
1.25 to 1.5 as of December 2017. The Fed also began the process of shrinking the size of its balance sheet in
October. Monetary tightening typically dampens inflation as consumers have less money to spend and price
increases of goods and services slow in response. Indeed, despite inflation accelerating at the beginning of 2017,
the rate fell below the Fed’s target by the end of the year. While the growing economy will boost inflationary
pressure, FOMC policy will stabilize inflation near its target.
National Business Cycle
An important component of business cycle
theory is the concept of potential GDP.
Potential GDP is a measure employed by the
CBO used to guide its economic projections.
Potential GDP is defined as the maximum
output that can be achieved in the economy
over time without increasing the risk of
inflation. Actual GDP fluctuates above and
below potential GDP during business cycles.
During a recession and early recovery, actual
GDP falls below potential GDP. During the
later phases of economic expansions, actual
GDP typically rises above potential GDP. The
difference between actual and potential GDP is measured by the CBO using the output gap which is expressed as
actual GDP less potential GDP, as a percent of potential GDP. Therefore, a negative output gap is associated with
economic recessions and slack in the economy; a positive output gap is associated with overheating in the
economy. According to the CBO, from 1961 to 2009, actual GDP was about 0.5 percent below potential GDP on
average, or a slightly negative output gap.
Related to potential GDP is the concept of a natural rate of unemployment. The natural rate is defined as the
unemployment rate exclusive of the influence of business cycles that is attributable to the economy’s ability to
match jobs with employees. In other words, the unemployment rate associated with normal turnover, job
creation and destruction, and the length of time required for job matching. During recessions, the actual
unemployment rate will be well above the natural rate of unemployment and in the later stages of an expansion
will be below it.
The CBO publishes measures of potential GDP and the natural rate of unemployment. Based on the CBO
estimates, the output gap has been negative since the Great Recession, dipping as low as ‐5.8 percent in 2009.
The output gap has gradually approached zero, measuring at ‐0.7 percent in 2016. Based on the CBO’s most
recent analysis, the output gap will rise into positive territory in 2018 and will persist into 2019, representing an
economy that is operating past its potential. The CBO estimates the natural rate of unemployment since 2016
has been 4.7 percent. The estimated average unemployment rate in 2017 is 4.4 percent, 0.3 percentage points
below the natural rate. The unemployment rate is expected to fall further below CBO’s natural rate in 2018.
As of January 2018, the U.S. economy has been expanding for 102 months, the third‐longest expansion in
records dating back to 1854. For comparison, the longest expansion lasted 120 months from 1991 to 2001 and
Metro Denver Economic Development Corporation | January 2018 | Page 10U.S.U.S.
ECONOMY
Economy
the shortest expansion lasted 12 months from 1980 to 1981. Once the current expansion surpasses 106 months,
as it likely will, it will be the second‐longest expansion to date.
The Federal Reserve Bank of St. Louis produces a Smoothed U.S. Recession Probability model on a monthly basis
that uses four variables to forecast the chance of an upcoming national recession. The variables are non‐farm
payroll employment, the index of industrial production, real personal income, and real manufacturing and trade
sales. Healthy employment growth generally results in a low probability of recession. Indeed, the U.S. has
currently posted 51 consecutive months of a recession probability under 3 percent.
National Economy Summary
The United States continued on its expansionary path, as all jobs lost during the recession were recovered by
mid‐2014 and employment in 2017 grew by an estimated 1.5 percent. The employment growth rate is expected
to increase at a slower pace, falling to 1.2 percent in 2018. Real gross domestic product will grow at a 2.4
percent pace in 2018, which is still below the historic average of 2.7 percent, spurred by rising consumer
confidence, increased consumption, and rising business investment. As GDP and employment expand, the
nation’s unemployment rate will drop to 4.3 percent and total personal income will increase 4.2 percent in
2018. Inflation will continue to rise due to the stronger economy and more stable energy prices, lifting overall
prices up by 2 percent.
Metro Denver Economic Development Corporation | January 2018 | Page 11COLORADO ECONOMY
Colorado Economy
Colorado is expected to be among the top 10 states for employment growth during 2017, although final state
employment data for the year will not be released until March. Colorado has ranked in the top 10 states for
seven of the past 10 years, from 2007 to 2016. Preliminary numbers suggest 2.2 percent state employment
growth in 2017, which is higher than the estimated national growth rate of 1.5 percent. The employment base
will expand to 2.66 million workers in 2017, representing the addition of about 57,600 jobs.
Colorado’s growing labor market is
supported by a diverse industry base and
dynamic business climate. Colorado’s
expanding employment base, high quality of
life, and increasing presence in the global
business community continue to attract
individuals and businesses to the state.
Colorado’s economy is expected to report
positive trends through 2018 across most
economic indicators.
The state has several unique advantages.
The expanding entrepreneurial community,
increasing start‐up activity, and highly
educated workforce make Colorado an
attractive location for business. In 2017, the
state ranked:
…third for its technology employment concentration (9.3 percent in 2016) on the CompTIA’s Cyberstates
2017 report.
…fourth in the Economic Innovation Group’s Index of State Dynamism for the ability of its economy and
population to adopt to changing conditions.
…fifth most innovative state by WalletHub based on the state’s high educational achievement, share of
technology companies, share of STEM professionals, and projected STEM‐job demand by 2020.
…fifth most startup activity among the largest 25 states according to the 2017 Kauffman Index of Startup
Activity for its rate of new entrepreneurs and startup density.
…sixth on CNBC’s list of America’s top states for business with high rankings for its workforce, technology and
innovation, and business friendliness.
…seventh on the 2017 U.S. Clean Tech Leadership Index by Clean Edge, Inc., as one of only eight states to
have a U.S. Department of Energy laboratory, a clean‐tech incubator, access to financial and human capital.
…eighth best state for business by Forbes. Colorado was credited for its young, educated labor supply and a
migrating population that is attracted to its robust economy and outdoor recreational opportunities.
…ninth best state in U.S. News & World Report’s new best states rankings including No. 1 for its economy, No.
7 for infrastructure, and No. 11 in healthcare.
…tenth in the nation in attracting private‐equity investment according to the American Investment Council,
receiving $16.1 billion in capital investments supporting 18,265 jobs in 2016.
These favorable rankings suggest the state will continue to grow solidly and attract attention as a highly
desirable place to live and work.
Metro Denver Economic Development Corporation | January 2018 | Page 12COLORADO ECONOMY
Colorado Economy
Employment & Unemployment
Note: Annual benchmark revisions to the employment and unemployment data series can significantly alter
historic trends. As 2017 job data will be revised in March 2018, the exact revisions are not yet known. The
following forecast is based on expected revisions to the data.
Employment: +2.2 percent in 2017(e); +1.9
percent in 2018(f).
Unemployment: 2.6 percent in 2017(e); 2.7
percent in 2018(f).
Colorado employment increased an
estimated 2.2 percent in 2017, a similar pace
as recorded in 2016. Estimates show the
state gained 57,600 jobs in 2017 compared
with 2016, and is expected to gain another
50,500 jobs during 2018. Data from the U.S.
Department of Labor’s Current Employment
Statistics (CES) show that statewide
employment surpassed its pre‐recession peak
in June 2013. From 2011 through 2017,
Colorado added 433,600 jobs to the state’s economy.
Based on the unrevised, published employment numbers from the CES data, year‐to‐date through November,
Colorado’s fastest growing supersectors in 2017 were the transportation, warehousing, and utilities supersector
and the other services category; with transportation, warehousing, and utilities increasing 3.4 percent and other
services increasing 3.3 percent. The transportation, warehousing, and utilities supersector has been supported
by various company announcements including large distribution centers in the Metro Denver area. Other
services includes personal services, repair and maintenance services, and nonprofit organizations. The
supersector mostly was boosted from a reclassification of companies from healthcare. Despite the fast pace of
growth, these two supersectors accounted for only about 12.6 percent of the absolute growth in Colorado’s
employment base. Colorado’s largest growth sectors in terms of absolute employment were professional and
business services, leisure and hospitality, wholesale and retail trade, and education and health services.
Combined, these four supersectors comprised about 71 percent of Colorado’s absolute employment growth.
None of Colorado’s supersectors lost employment in 2017. However, three of Colorado’s supersectors recorded
employment growth well below the state average. The natural resources and construction supersector
continued to struggle with slow growth in the mining subsector that includes oil and gas. While further job
losses are not expected in oil and gas, the industry continues to recover from the steep job losses posted in
2016. Manufacturing continued to be impacted by three consecutive years of export contraction from 2014 to
2016. However, employment was supported somewhat from an increase in exports through the first half of
2017, rising 7.1 percent compared with the first half of 2016. The information supersector recorded its fourth
consecutive year of growth in 2017. However, the supersector has increased at an annualized rate of just 1
percent since 2013.
Looking ahead, the natural resources and construction; transportation, warehousing, and utilities; leisure and
hospitality; and education and health services supersectors are expected to lead the state in employment
growth through 2018. Professional and business services, education and health services, and leisure and
Metro Denver Economic Development Corporation | January 2018 | Page 13You can also read