3 Electricity networks - Australian Energy Regulator
←
→
Page content transcription
If your browser does not render page correctly, please read the page content below
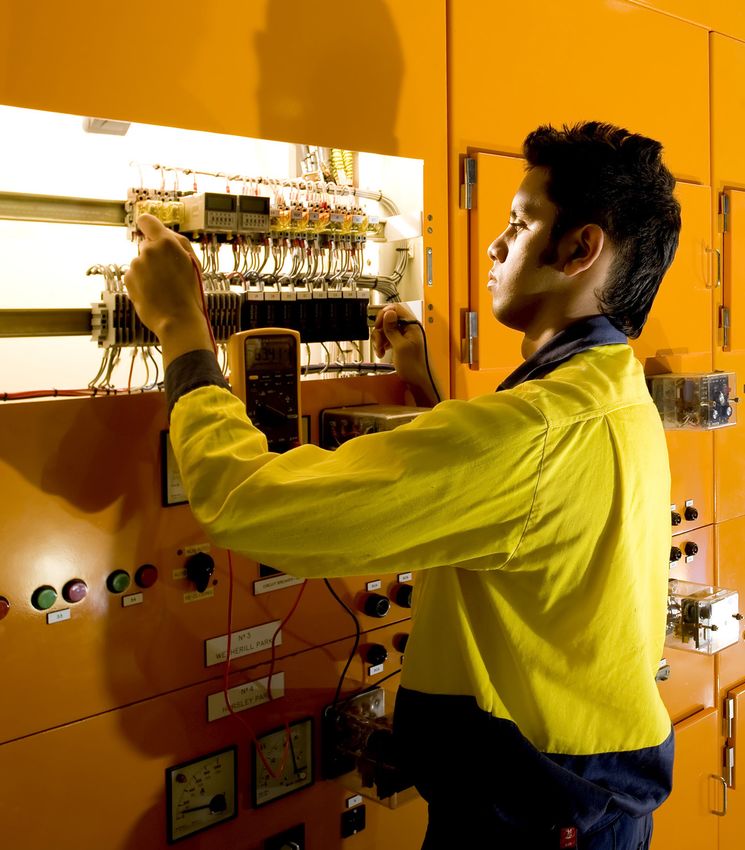
3                                   Image courtesy of TransGrid

         Electricity networks
STATE OF THE ENERGY MARKET 2021   Overview                126
Australia’s electricity network infrastructure consists of transmission and distribution networks, as well as smaller standalone regional systems. Together these networks transport electricity from generators to residential and industrial customers (infographic 1). This chapter covers the 21 electricity networks regulated by the Australian Energy Regulator (AER), which are located in all Australian states and territories other than Western Australia. 3.1 Electricity network characteristics Transmission networks provide the link between power generators and customers by transporting high-voltage electricity to major load centres. Electricity is injected from points along the transmission grid into the distribution networks that deliver electricity to residential homes and commercial and industrial premises. When electricity enters a distribution network, it is stepped down to lower voltages for safe delivery to customers. Distribution networks consist of poles and wires, substations, transformers, switching equipment, and monitoring and signalling equipment. While electricity distributors transport and deliver electricity to customers, they do not sell it. Instead, retailers purchase electricity from the wholesale market and package it with network services to sell to customers (chapter 6). Electricity networks have traditionally provided a one-way delivery service to customers. However, the role of electricity networks is evolving as new technologies change how electricity is generated and used. Many small scale generators such as rooftop solar photovoltaic (PV) systems are now embedded within distribution networks, resulting in 2-way electricity flows along the networks. Energy users with solar PV systems can now source electricity from the distribution network when they need it and sell back the surplus electricity they generate at other times. Electricity generated using solar PV systems is also increasingly being stored using battery storage systems. Due to the versatility and falling cost of battery technology their use is expected to continue to grow over the coming years.1 Alongside the major distribution networks, small embedded distribution networks deliver energy to sites such as apartment blocks, retirement villages, caravan parks and shopping centres. Electricity is delivered to a single connection point at these sites, then sold by the embedded network operator to tenants or residents. The revenues of embedded networks are not regulated. 3.2 Geography Electricity networks in Queensland, New South Wales (NSW), Victoria, South Australia, Tasmania and the Australian Capital Territory (ACT) create an interconnected grid forming the National Electricity Market (NEM). The NEM transmission grid has a long, thin, low density structure, reflecting the dispersed locations of electricity generators and demand centres. The 5 state-based transmission networks are linked by cross-border interconnectors. Three interconnectors (Queensland–NSW, Heywood, and Victoria–NSW) form part of the state-based networks, while 3 other interconnectors (Directlink, Murraylink and Basslink) are privately owned (figure 3.1). The transmission network also directly supplies energy to large industrial customers such as Alcoa’s aluminium smelter in Portland (Victoria). The transmission grid connects with 13 distribution networks.2 Consumers in Queensland, NSW and Victoria are serviced by multiple distribution networks, each of which owns and operates its network within a defined geographic region. South Australia, Tasmania and the ACT are serviced by single distribution networks operating within each jurisdiction (figures 3.2 and 3.3). 1 Australian Renewable Energy Agency, Battery storage, AREA website, accessed 16 May 2021. 2 Some jurisdictions also have small networks that serve regional areas. STATE OF THE ENERGY MARKET 2021 Electricity networks 127
Figure 3.1          Electricity networks regulated by the AER – transmission
                                                                                                       48,204 GWh
         Powerlink (Qld)
                                                                                                                             14,528 km
      (Qld Govt owned)
                                                                                                                             $7.2 billion
                                                                                                                                            64,000 GWh
      TransGrid (NSW)
                                                                                                                 13,052 km
      (privately owned)
                                                                                                                    $6.6 billion
                                                                                       40,440 GWh
 AusNet Services (Vic)
                                                                  6,731 km
    (privately owned)
                                                                 $3.3 billion
                                11,414 GWh
         ElectraNet (SA)
                                                        5,520 km
       (privately owned)
                                                       $2.8 billion
                             10,097 GWh
     TasNetworks (Tas)
                                     3,351 km
      (Tas Govt owned)
                                 $1.5 billion

    Murraylink (Vic–SA)     176 km
      (privately owned)     $123 million

Directlink (Qld–NSW)       63 km
     (privately owned)       $149 million

     Basslink (Vic–Tas)
                              375 km
      (privately owned)

                                Electricity transmitted (total: 174,155 GWh)    Line length (total: 44,381 km)         Regulatory asset base (total: $21.7 billion)

GWh: gigawatt hours; km: kilometres.
Note:         Line length and asset base are as at 30 June 2020 (30 March 2020 for AusNet Services). Figure shows electricity transmitted in 2019–20 (year
              to March 2020 for AusNet Services). Regulatory asset base is adjusted to June 2021 dollars based on forecasts of the consumer price index
              (CPI). Northern Territory transmission assets are treated as part of the distribution system for regulatory purposes.
Source:       AER revenue decisions and economic benchmarking regulatory information notices (RINs).

The Northern Territory has 3 separate networks – the Darwin–Katherine, Alice Springs and Tennant Creek systems –
that are all owned by Power and Water Corporation (Power and Water). The networks are classified as a single
distribution network for regulatory purposes but do not connect to each other or the NEM. The AER regulates all
major networks in the NEM, other than the Basslink interconnector linking Victoria with Tasmania. It also regulates the
Northern Territory’s distribution network.

The combined value of the regulatory asset bases (RABs)3 for the electricity networks regulated by the AER is a little
over $100 billion. This comprises 7 transmission networks valued at $21.7 billion and 14 distribution networks valued
at $78.8 billion. In total, the networks span almost 790,000 kilometres of line and deliver electricity to more than
10 million customers.

The AER does not regulate electricity networks in Western Australia, where the Economic Regulation Authority (ERA)
administers state-based arrangements. Western Power (owned by the Western Australian Government) is the state’s
principal network, covering the populated south west region, including Perth. Another state-owned corporation –
Horizon Power – services Western Australia’s regional and remote areas.4

3     RABs capture the total economic value of assets that are providing network services to customers. These assets have been accumulated over time and are
      at various stages of their economic lives.
4     For further information, see the Department of Treasury (http://www.treasury.wa.gov.au) and ERA (http://www.era.wa.gov.au) websites.

STATE OF THE ENERGY MARKET 2021                    Electricity networks                                                                                               128
Figure 3.2 Electricity networks regulated by the AER – distribution
Darwin
Transmission network
Interconnector
Power and Water
Cairns
Ergon Energy
Energex
Brisbane
Directlink
SA Power Networks
QNI
Essential Energy
Murraylink
Ausgrid
Evoenergy Sydney
Adelaide
Endeavour Energy
NSW–Vic Canberra
Powercor
AusNet Services
CitiPower NSW–Vic
Heywood
Melbourne
Basslink
Powercor
AusNet
Jemena Services TasNetworks TasNetworks
CitiPower United Hobart
Energy
QNI: Queensland–NSW Interconnector.
Note: The AER does not regulate the Basslink Interconnector.
Source: AER.
STATE OF THE ENERGY MARKET 2021 Electricity networks 129Figure 3.3 Electricity networks regulated by the AER – distribution
1,516,198
Energex (Qld) 55,190 km
$12.9 billion
762,303
Ergon Energy (Qld) 152,896 km
$11.6 billion
1,762,079
Ausgrid (NSW) 42,302 km
$16.2 billion
1,049,165
Endeavour Energy
38,725 km
(NSW)
$6.8 billion
925,966
Essential Energy (NSW) 192,685 km
$8.5 billion
776,854
AusNet Services (Vic) 45,734 km
$4.5 billion
346,468
CitiPower (Vic) 4,569 km
$1.9 billion
366,841
Jemena (Vic) 6,699 km
$1.5 billion
863,408
Powercor (Vic) 76,306 km
$4.3 billion
703,119
United Energy (Vic) 13,426 km
$2.4 billion
914,603
SA Power Networks
89,416 km
(SA)
$4.4 billion
293,949
TasNetworks (Tas) 22,912 km
$1.8 billion
207,237
Evoenergy (ACT) 5,610 km
$985 million
86,263
Power and Water (NT) 6,991 km
$1.0 billion
Customers (total: 10,574,453) Line length (total: 753,462 km) Regulatory asset base (total: $78.8 billion)
km: kilometres.
Note: Customer numbers, line length and asset base is as at 30 June 2020 (31 December 2020 for Victorian businesses). Regulatory asset base is
adjusted to June 2021 dollars based on forecasts of the consumer price index (CPI). For regulatory purposes, Northern Territory transmission
assets are treated as part of the distribution system.
Source: AER revenue decisions and economic benchmarking regulatory information notices (RINs).
STATE OF THE ENERGY MARKET 2021 Electricity networks 1303.3 Network ownership
Australia’s electricity networks were originally government owned, but many jurisdictions have now partly or fully
privatised the assets. Privatisation of the electricity networks began in Victoria, which sold its transmission and
distribution networks to private entities in the 1990s.5
In 2000 the South Australian Government privatised its transmission network and leased its distribution network. In
the same year, a joint venture between the ACT Government and private equity holders was established to operate
the ACT distribution network.6
In November 2015 the NSW Government leased its transmission network (TransGrid) to private interests. It then
leased 50.4% of 2 distribution networks – Ausgrid in 2016 and Endeavour Energy in 2017 – to private interests. The
predominately rural Essential Energy network remains government owned and operated.
Ownership of the privatised networks in NSW, Victoria and South Australia is concentrated among relatively few
entities. These entities include Hong Kong’s Cheung Kong Infrastructure Holdings (CKI Group) and Power Assets
Holdings, Singapore Power International, and State Grid Corporation of China. Fund managers such as Spark
Infrastructure and Hastings also have substantial equity in the sector. Significant ownership links exist across the
electricity and gas network sectors (section 5.2).
Electricity networks in Queensland, Tasmania, the Northern Territory and Western Australia remain wholly government
owned. The Queensland Government in 2016 merged state-owned electricity distributors Energex and Ergon Energy
under a new parent company, Energy Queensland.
In some jurisdictions, ownership of electricity networks overlaps with other industry segments, with ring-fencing for
operational separation. Queensland’s state-owned Ergon Energy, for example, provides both distribution and retail
services in regions outside south east Queensland.
3.4 How network prices are set
Electricity networks are capital intensive, so their average costs will fall as output rises. This characteristic gives rise
to a natural monopoly industry structure, where it is more efficient to have a single network provider than to have
multiple providers offering the same service.
Because monopolies face no competitive pressure, they have opportunities and incentives to charge unfair prices.
This environment poses serious risks to consumers, given network charges can make up close to 50% of a residential
electricity bill (figure 6.8 in chapter 6). To counter these risks, the role of the AER as economic regulator is to mimic
the incentives that network businesses would face in a competitive market (that is, to control costs, invest efficiently
and not overcharge consumers).
3.4.1 Regulatory objective and approach
The National Electricity Law and the National Electricity Rules set the framework for regulating electricity networks,
and the AER applies that framework. The regulatory objective of the National Electricity Law is to promote efficient
investment in, and efficient operation and use of, electricity services for the long term interests of consumers of
electricity with respect to price, quality, safety and reliability and security of supply of electricity; and the reliability,
safety and security of the national electricity system.
The AER seeks to ensure the delivery of a reliable, secure, affordable and low emissions energy supply in an efficient
and timely way that meets the expectations of energy consumers and the community. Its regulatory toolkit to pursue
this objective is wide ranging (box 3.1), but its central role is to set the maximum revenue that a network business
can earn from its customers for delivering electricity. The AER fulfils this role via a periodic determination process, in
which it assesses how much revenue a prudent network business would need to cover its efficient costs. Network
revenues are then capped at this level for the regulatory period, which is typically 5 years.7
5 In Victoria, ownership of the transmission network is separated from planning and investment decision making. AusNet Services owns the state’s
transmission assets, but the Australian Energy Market Operator (AEMO) plans and directs network augmentation (expansion). AEMO also purchases bulk
network services from AusNet Services for sale to customers.
6 The ACT has no transmission assets.
7 While a 5-year regulatory period helps to create a stable investment environment, it poses risks of locking in inaccurate forecasts. The National Electricity
Rules include mechanisms for dealing with uncertainties – such as cost pass-through triggers and a process for approving contingent investment projects –
when costs were not clear at the time of the revenue determination.
STATE OF THE ENERGY MARKET 2021 Electricity networks 131Box 3.1 The AER’s role in electricity network regulation
The Australian Energy Regulator (AER) sets a cap every 5 years on the revenue that a network business can earn
from its customers. Alongside this central role, we undertake broader regulatory functions, including:
› assessing network charges each year to ensure they reflect underlying costs and do not breach revenue limits
› providing incentives for network businesses to improve their performance in ways that customers value
› assessing whether any additional costs not anticipated at the time of our original decision should be passed
on to customers
› publishing information on the performance of network businesses, including benchmarking and profitability
analyses
› monitoring whether network businesses properly assess the merits of new investment proposals.
We also help implement reforms to improve the quality of network regulation and achieve better outcomes for
energy customers, such as:
› Power of Choice reforms empowering customers to make informed choices about their energy use, which
ultimately help keep network costs down (sections 3.7 and 1.8)
› adopting a more consumer centric approach to setting network revenues (section 3.6)
› publishing information on network profitability
› reviewing how rates of return and taxation allowances are set for energy networks (section 3.11).
As part of the determination process, a network business submits a proposal to the AER setting out how much
revenue it will need to earn to cover the costs of providing a safe and reliable electricity supply. The AER then
assesses the reasonableness of the network business’s forecasts and the efficiency of expenditure proposals. If the
AER concludes a business’s proposal is likely to be unreasonably costly, it may ask for more detailed information
or a clearer business case. Subsequently, the AER may amend a network’s proposal to ensure the approved cost
forecasts are efficient.
In forming a view on the prudency of a network business’s capital expenditure forecast, the AER assesses capital
expenditure drivers for that business. The AER does not determine which capital programs or projects a network
business can invest in. Once the AER sets a capital expenditure forecast, it is up to the network business to prioritise
its investment program. However, the network business must undertake a cost–benefit analysis (CBA) for new
investment projects that meet cost thresholds (section 3.12.7).
As operating cost are largely recurrent and predictable, the AER starts its review process by assessing the actual
operating expenditure a business incurred in the (then) current regulatory period. The AER uses its assessment
techniques to determine whether this base expenditure is efficient and applies a rate of change to this base to
account for changes in prices, productivity and the outputs the business is required to deliver.
The AER publishes guidelines on its approach to assessing capital and operating costs and applying incentives.8
Sections 3.9, 3.13 and 3.15 examine the incentive schemes in more detail. The AER’s Electricity network performance
report details the impact incentive schemes have had on network businesses’ behaviour.9
In conducting its revenue assessment, the AER draws on a range of inputs, including expenditure forecasts,
benchmarking and revealed costs from past expenditure. It engages closely with stakeholders from the earliest stage
of the process, including before the network businesses lodge a formal proposal.
Electricity network businesses have made, and continue to make, significant improvements to the ways in which
they engage with consumers. The regulatory process increasingly focuses on how network businesses engage with
their customers in shaping regulatory proposals. As part of this focus, the AER has recently trialled the ‘New Reg’
process – an enhanced, more open approach to how network businesses incorporate consumer perspectives in
developing their regulatory proposals – with Victorian distribution network AusNet Services (box 3.2).
8 AER, Guidelines, schemes & models, AER website, accessed 1 March 2021.
9 AER, Electricity network performance report, September 2020.
STATE OF THE ENERGY MARKET 2021 Electricity networks 132Additionally, the AER’s Consumer Challenge Panel (CCP) – comprising experienced and highly qualified individuals
with consumer, regulatory and/or energy expertise – provides input on issues of importance to consumers. It advises
the AER on whether the revenue proposals submitted by network businesses are in the long term interests of
consumers; the effectiveness of network businesses’ engagement with their customers; and how consumer views are
reflected in the development of the network businesses’ proposals.10
Box 3.2 Trialling the New Reg model
The Australian Energy Regulator (AER), along with Energy Consumers Australia and Energy Networks Australia,
launched the New Reg initiative in June 2017 to explore ways to improve sector engagement and identify
opportunities for regulatory innovation. The vision of the New Reg initiative is to ensure that customers’
preferences drive energy network businesses’ proposals and regulatory outcomes.
Victorian distributor AusNet Services trialled the New Reg initiative and negotiated parts of its 2021 to 2026
regulatory proposal with a customer forum. The AER engaged Cambridge Economic Policy Associates (CEPA) to
conduct an evaluation of AusNet Services’ trial of New Reg.
CEPA’s interim evaluation concluded that the overall vision for New Reg appeared to have been largely realised.
CEPA also identified some learnings for future engagement processes.11
CEPA’s final evaluation of the New Reg trial will inform the AER’s future work in relation to network consumer
engagement. As part of the New Reg trial the AER is also considering potential reforms to ensure regulatory
outcomes reflect consumer preferences and priorities. These included increasing flexibility to better reflect
consumer–network agreed price and service combinations and desired incentives. The AER also identified
reforms to support and empower consumers and reward effective engagement.12
3.4.2 Building blocks of network revenue
The AER uses a ‘building block’ approach to assess a network business’s revenue needs. Specifically, it forecasts
how much revenue the business will need to cover:
› a commercial return to investors that fund the network’s assets and operations
› efficient operating and maintenance costs
› asset depreciation costs
› taxation costs.
The AER also makes revenue adjustments for over- or under-recovery of revenue made in the past; and for rewards or
penalties earned through any applicable incentive schemes (figure 3.4).
While network businesses are entitled to earn revenue to cover their efficient costs each year, this revenue does not
include the full cost of investment in new assets made during the year. Network assets have a long life, so investment
costs are recovered over the economic life of the assets, which may run to several decades. The amount recovered
each year is called depreciation, and it reflects the lost value of network assets each year through wear and tear and
technical obsolescence.
Additionally, the shareholders and lenders that fund these assets must be paid a commercial return on their
investment. The AER sets the allowed rate of return (also called the weighted average cost of capital (WACC)). The
size of this return depends on:
› the value of the network’s RAB, which captures the total economic value of assets that are providing network
services to customers plus positive adjustments for forecast new capital expenditure and negative adjustments for
depreciation on existing assets
› the rate of return that the AER allows based on the forecast cost of funding those assets through equity and
debt.13
10 AER, Consumer Challenge Panel, AER website, accessed 1 March 2021.
11 CEPA, New Reg: AusNet Services trial – interim evaluation report, 4 December 2020.
12 AER, ECA, ENA, Submission to electricity network economic regulatory framework 2020 review, July 2020.
13 The return on equity is the return that shareholders of the business will require for them to continue to invest. The return on debt is the interest rate that the
network business pays when it borrows money to invest.
STATE OF THE ENERGY MARKET 2021 Electricity networks 133Overall these returns take up the largest share of network revenue, accounting for 43% across all networks (49% for
transmission and 42% for distribution) (figure 3.5).
Operating costs – such as maintenance costs and overheads – absorb 35% of revenue across all networks (30% for
transmission and 36% for distribution). Depreciation absorbs another 18%, while taxation and other costs account for
the remaining 3% of network revenue. Sections 3.10 to 3.13 examine major cost components in more detail.
Figure 3.4 Forecasting electricity network revenues
Taxation costs
Allocation of asset costs
over asset life Depreciation
Revenue
approved
by AER
Regulatory asset base
Operating expenditure
(RAB)
Asset financing costs =
RAB x WACC Return on capital
New investment
(capital expenditure)
AER sets rate of return Revenue adjustments from
(WACC) AER incentive schemes
AER: Australian Energy Regulator; RAB: regulatory asset base; WACC: weighted average cost of capital.
Note: Revenue adjustments from incentive schemes encourage network businesses to efficiently manage their operating and capital expenditure,
improve services provision to customers, and adopt demand management schemes that avoid or delay unnecessary investment.
Source: AER.
Figure 3.5 Composition of average annual electricity network revenue – current periods
100%
$429 million $1.6 billion
80%
Proportion of total revenue
$768 million
60% $3.2 billion
40%
$1.2 billion
20% $3.7 billion
0%
Transmission Distribution
Return on capital Operating expenditure Depreciation Tax Other
Source: Post-tax revenue modelling used in AER determination process.
STATE OF THE ENERGY MARKET 2021 Electricity networks 1343.4.3 Timelines and process
The National Electricity Law and the National Electricity Rules set the regulatory framework and process, which is
both lengthy and highly consultative. The process begins around 3 years before the beginning of a regulatory period,
when the AER works with stakeholders on a review framework and approach. The next step is for a network business
to propose the revenue that it considers it needs to earn to cover the efficient costs of meeting its service and
reliability obligations. Network businesses engage with their customers in framing the revenue proposal.
The AER has 15 months to review a revenue proposal before releasing its final decision. It consults widely with energy
customers, consumer representatives, government, investment groups, network businesses and other stakeholders.
This consultation includes issues papers, draft decisions and public forums. The timing of the AER reviews is
staggered to avoid bunching (figures 3.6 and 3.7).
Following its review, the AER makes a final decision setting the maximum amount of revenue that a network business
can earn from its customers through network charges.14
While the decision sets network revenues rather than prices, the 2 are closely related. Network businesses set prices
by spreading their allowed revenue across the customer base.15
As part of the regulatory process (section 3.7.1), the AER assesses tariff structure statements that set out a network’s
pricing policies and annually reviews prices to ensure they are consistent with the revenue decision and reflect
efficient costs.
Figure 3.6 AER decision timelines – electricity transmission networks
Victoria
AusNet Services
Queensland
Powerlink
NSW
TransGrid
South Australia
ElectraNet
Victoria/South Australia
Murraylink
Tasmania
TasNetworks
Queensland/NSW
Directlink
2016 2017 2018 2019 2020 2021 2022 2023 2024 2025
Framework and approach process Regulatory determination process Regulatory control period AER final decision
Note: Timelines for AER decisions are effective at 1 July 2021. The latest information is available on the AER website: (https://www.aer.gov.au/
networks-pipelines/determinations-access-arrangements).
Source: AER.
14 For transmission networks, the AER determines a cap on the maximum revenue that a network can earn during a regulatory period. For distribution
networks, revenue caps apply in all states except the ACT, where an average revenue cap links revenue to volumes of electricity sold.
15 Traditionally, each customer paid a fixed daily charge plus a charge based on actual energy use. These arrangements are evolving under new pricing
structures that encourage customers to consider how their energy use impacts network costs. Pricing reforms to address this issue form part of the Power of
Choice program (section 3.7).
STATE OF THE ENERGY MARKET 2021 Electricity networks 135Figure 3.7 AER decision timelines – electricity distribution networks
NSW
Ausgrid
Essential Energy
Endeavour Energy
ACT
Evoenergy
Northern Territory
Power and Water
Tasmania
TasNetworks
Queensland
Energex
Ergon Energy
South Australia
SA Power Networks
Victoria
CitiPower
Powercor
Jemena
AusNet Services
United Energy
2016 2017 2018 2019 2020 2021 2022 2023 2024 2025 2026
Framework and approach process Regulatory determination process Regulatory control period
Full Federal Court decision AER final decision AER remittal process
Note: Timelines for AER decisions are effective at 1 July 2021. The latest information is available on the AER website: (https://www.aer.gov.au/
networks-pipelines/determinations-access-arrangements).
Source: AER.
3.5 Recent AER revenue decisions
In April 2021 the AER published its final revenue decisions for the 5 electricity distribution networks in Victoria –
AusNet Services, CitiPower, Jemena, Powercor, and United Energy. These decisions cover the 5-year period ending
30 June 2026 (figure 3.8).
The 5 Victorian distributors are forecast to earn a combined $11.1 billion in revenue over the current period –
$313 million (2.7%) less than they were forecast to earn and $392 million (3.4%) less than they actually earned in
the previous period. The key driver of the lower forecast revenue is the allowed rate of return, which decreased
from around 6.3% for the previous period to 4.7% for the current period.16 This reflects a decrease in interest rates,
meaning the Victorian distributors can obtain the capital they need to run their businesses more cheaply.
In 4 of the 5 decisions, the AER approved lower forecast revenues in the current period than were forecast in the
previous period – the exception being AusNet Services. Distribution network charges for AusNet Services’ consumers
will increase slightly over the current period due to the increase in forecast revenue, combined with a decrease in
forecast demand (which causes network charges – revenue per energy unit ($ per kWh) – to increase).
16 The rate of return is a nominal rate of return unless stated otherwise. The real rate of return has also decreased but by a smaller amount. The 4.7% is applied
to the first year of the 2021 to 2026 regulatory period. A different rate of return will apply for the remaining regulatory years of the period.
STATE OF THE ENERGY MARKET 2021 Electricity networks 136Figure 3.8 Recent AER electricity network revenue decisions – key outcomes
0.5% 0.4% 0.5% 0.2% 0.8%
30%
Forecast change from previous period
20%
10%
0%
-10%
-20%
AusNet CitiPower Jemena Powercor United
Services (Vic) (Vic) (Vic) Energy
(Vic) (Vic)
Revenue Capital expenditure Operating expenditure (%) Annual impact on residential bill
Note: Bill impact is the change in the average annual customer bill compared with the customer bill in the final year of the previous period, adjusted for
inflation, assuming retailers pass through outcomes of the decision.
Source: AER estimates.
For the period commencing 1 July 2021 the Victorian distributors are forecast to invest around $5.2 billion in capital
projects – $108 million (2%) less than they invested in the previous period. Despite the AER’s lower approved capital
expenditure allowance the collective value of the Victorian distributors’ RABs is forecast to increase by $1.4 billion
(10%) by 2026.
The Victorian distributors are forecast to spend around $4.4 billion on operating costs over the current period –
$744 million (20%) more than they spent in the previous period.
The AER’s decisions for the previous period challenged network businesses to deliver services more efficiently
through prudent choices about operating and capital expenditure, without compromising network safety and
reliability. In total, the Victorian distributors underspent in the previous period by $1.2 billion (18%) and by $600 million
(14%) against their respective approved capital and operating expenditure forecasts. The AER’s setting of lower
forecast revenue allowances for the current period acknowledged network businesses are rationalising their
operations and will continue to build on operational efficiencies. Lower revenue allowances benefit customers by
locking in efficiency gains.
3.5.1 Legal reviews of AER decisions
A party can seek judicial review of an AER decision on a network business’s revenue. Before October 2017 a party
could also apply to the Australian Competition Tribunal (the Tribunal) for a limited merits review of an AER decision.
From 2008 to 2017 network businesses and other parties applied for limited merits review of 33 of the AER’s
52 electricity network decisions. Network businesses often succeeded in having their allowed rates of return and
revenues increased, whereas consumer representatives and governments were invariably unsuccessful in arguing
that network revenues should be decreased.17 Tribunal decisions added over $3 billion to network revenues.
Following the Australian Government’s abolition of limited merits review in October 2017, the AER committed to a
more collaborative approach to network regulation, driven by customers’ best interests (section 3.6). No appeals for
judicial review have since been lodged on any AER decisions on network revenue.
17 AER, Review of the limited merits review framework, AER submission to Ministerial Forum of Energy Ministers (formerly CoAG Energy Council), October 2016.
STATE OF THE ENERGY MARKET 2021 Electricity networks 1373.6 Refining the regulatory approach The regulatory framework is not static. Recent reforms include the AER using benchmarking to assess network costs; offering incentives for network efficiency; and rewarding the network businesses for quality engagement with their customers when they are developing revenue proposals. The AER continues to review and incrementally refine elements of its benchmarking methodology and data. The aim of this work is to maintain and continually improve the reliability of the benchmarking results it publishes and uses in its network revenue determinations. In 2019, for example, it reviewed alternative approaches to assessing information and communication technology (ICT) expenditure. ICT is increasingly a more integral component of energy services delivery. In its review, the AER assessed whether its existing ICT expenditure assessment tools were fit for purpose. In 2020 the AER reviewed its treatment of inflation in its regulatory framework. In December 2020 the AER announced that it would adjust its approach to estimate expected inflation from using a 10-year average to a 5-year average of the Reserve Bank of Australia’s headline rate to match the 5-year timeframe of a typical regulatory period. The new approach addresses issues highlighted in stakeholder submissions and is more responsive to changing economic circumstances.18 In July 2020 the AER released its new Customer Service Incentive Scheme (CSIS), which provides incentives for distributors to provide levels of customer service that align with their customers’ preferences (box 3.6).19 Distributors are encouraged to engage with their customers, identify the customer services they want improved and then set targets to improve those services. The CSIS rewards distributors for improving their customer service and penalises them if service levels deteriorate. The CSIS improves the incentives available for distribution networks to recognise the value of customer service and has been applied to Victorian distributors AusNet Services, CitiPower, Powercor and United Energy in the 2021 to 2026 period. The AER also implemented changes to regulatory arrangements that sit outside the formal determination process. In June 2020 the AER published its objectives and priorities to be addressed through network service performance reports for regulated electricity and gas network businesses.20 The AER plans to review these objectives and priorities by 2025 to ensure they remain fit for purpose. In August 2020 the AER published guidelines to make AEMO’s integrated system plan (ISP), a whole-of-system plan for eastern Australia’s power system, actionable. The guidelines include a new CBA guideline; a new forecasting best practice guideline; and updates to the regulatory investment test for transmission (RIT-T) instrument and application guidelines. The guidelines are part of a broader reform led by the Energy Security Board (ESB), with changes made to the National Electricity Rules to streamline the transmission planning process while retaining rigorous CBA. While the new rules were effective from 1 July 2020, the new guidelines will come into effect through the 2022 ISP.21 The ISP and RIT-Ts are discussed in section 3.12. 3.6.1 Aligning business and consumer interests The regulatory process is complex and often adversarial. In this environment, consumers may find it challenging to have their perspectives heard and to assess whether a network business’s proposal reflects their interests. In recent processes, the AER and network businesses have trialled new approaches to improve consumer engagement. To help consumers engage in the regulatory process, the AER publishes documents – including factsheets that simplify technical language – and holds public forums. The AER’s Consumer Challenge Panel also provides a mechanism for consumer perspectives to be properly voiced and considered. A number of network businesses are experimenting with early engagement models to better reflect consumer interests and perspectives in framing their regulatory proposals – for example, running ‘deep dive’ workshops. The AER has trialled a new approach to customer engagement – the New Reg – in partnership with Energy Networks Australia (ENA) and Energy Consumers Australia (ECA) (box 3.2).22 18 AER, Final position – regulatory treatment of inflation, December 2020. 19 AER, Final – Customer Service Incentive Scheme, July 2020. 20 AER, Objectives and priorities for reporting on regulated electricity and gas network performance – Final, June 2020. 21 AER, Final decision – Guidelines to make the Integrated System Plan actionable, August 2020. 22 AER, ECA and ENA, New Reg: towards consumer-centric energy network regulation, a joint initiative of the Australian Energy Regulator, Energy Consumers Australia, and Energy Networks Australia, Directions paper, March 2018. STATE OF THE ENERGY MARKET 2021 Electricity networks 138
Early engagement offers the potential to expedite the regulatory process, reducing costs for businesses and
consumers. In particular, effective consumer consultation can lay the foundations for the AER to accept major
elements of a network business’s revenue proposals. If a business and its customers can agree on key areas then the
AER will put significant weight on a proposal reflecting that consensus.

Also, network businesses are increasingly looking to maintain open and ongoing dialogue with stakeholders
throughout the regulatory period, as opposed to engaging intensively once every 5 years when a proposal is
being considered.

In 2019 Jemena (Victoria) was awarded the ENA/ECA Consumer Engagement Award for its Electricity Network
People’s Panel. Jemena received recognition because it ‘met consumers where they were’ – tailored its engagement
to them, ensured that translators were on hand, made childcare available and provided transport to ensure that no
one was left out of the conversation.23

SA Power Networks (South Australia) and Powerlink (Queensland) were also shortlisted as finalists for the award – SA
Power Networks for its community engagement on its tariff structure statement and Powerlink for enabling consumer
advocates to build an engagement process for its 2023 to 2027 revenue determination.

In 2020 Jemena was again nominated for the ENA/ECA Consumer Engagement Award for its community-focused
response to the COVID-19 pandemic. Jemena’s diverse customer base presented a unique challenge in how to
respond to the pandemic. Jemena identified key customer and community challenges using a consultative, evidence-
based approach and delivered solutions in collaboration with industry and the community.24

AusNet Services (Victoria) was also nominated for the award for participating in the New Reg trial (box 3.2). As part of
the trial AusNet Services established an independent customer forum to represent the perspectives of its customers
in negotiating and agreeing price and service offerings, supported by the AER. The forum met with numerous
members of AusNet Services’ staff over a 2-year period and gained detailed information on the network business,
its customers and its plans. The forum also met with many of AusNet Services’ customers independently. Agreed
outcomes were incorporated in AusNet Services’ 2021 to 2026 revenue proposal.

3.7              Power of Choice reforms
Innovations in network and communication technology – including ‘smart’ meters, interactive household devices,
and energy management and trading platforms – are driving change in energy markets. These innovations allow
consumers to access real-time information about, and make informed decisions in managing, their energy use. If
consumers choose to voluntarily reduce their energy use from the grid in peak periods (by shifting energy use or
relying on battery storage), it can potentially delay the need for costly network investment.

Power of Choice reforms are being progressively rolled out to unlock the potential benefits of these innovations. The
reforms include a market-led rollout of smart meters, supported by more cost-reflective network pricing (section
3.7.1), and incentives for demand management as a lower cost alternative to network investment (section 3.12.10).

The emergence of electric vehicles (EVs) can also help consumers manage their energy needs. The Australian
Renewable Energy Agency (ARENA) is funding projects to assess different approaches to optimise the use of EVs.
Projects include ActewAGL Retail (ACT) demonstrating that a fleet of EVs can provide similar services to grid-scale
batteries and virtual power plants. The EVs used in the trial can be charged from mains power or rooftop solar but
can also send electricity back to the grid.25 A separate trial, led by Jemena (Victoria), is exploring using hardware-
based smart charging for dynamic management of residential electric vehicles.26

More generally, the Distributed Energy Integration Program (DEIP) – a collaboration of government agencies, market
authorities, industry and consumer associations – aims to enhance consumers’ benefits from using distributed energy
resources (DER), including benefits from access and pricing reforms.27 The DEIP has also ran a series of task forces
to explore issues relating to integrating EVs into the energy system.

23 Energy Networks Australia, Consumer engagement report, 2020.
24 Energy Networks Australia, ‘Consumer Engagement Award finalists announced’ [media release], 6 October 2020.
25 ARENA, ‘“Batteries on wheels” roll in for Canberra storage trial’, ARENAWIRE, 8 July 2020.
26 ARENA, ‘Electricity networks gear up to manage electric vehicle demands on the grid’, [media release], 5 February 2021.
27 The DEIP’s Access and Pricing Working Group developed a rule change proposal on the prohibition on export charging which the AEMC approved in its
   decision published June 2021.

STATE OF THE ENERGY MARKET 2021                  Electricity networks                                                                              139
Improvements in energy storage and renewable generation technology are making it increasingly possible for some
consumers to go ‘off-grid’. Stand-alone systems or microgrids – where a community is primarily supplied by local
generation with no connection to the main grid – are gaining traction, particularly in regional communities remote
from existing networks.

In May 2020 the Australian Energy Market Commission (AEMC) proposed rule changes to enable distributors to
supply their customers using stand-alone power systems (SAPS)28 where it is cheaper than maintaining a connection
to the grid. The AEMC identified additional benefits of these systems, including improved reliability and reduced
bushfire risks.29

Under the proposed reforms, customers who receive stand-alone systems will retain all of their existing consumer
protections, including access to retail competition and existing reliability and safety standards. Cost savings arising
from the use of lower cost stand-alone systems will flow through to all users of the distribution network through lower
network prices.

3.7.1             Tariff structure reforms
Under traditional network tariff (price) structures, households and small businesses are charged the same tariffs
regardless of how and when they use energy. Some consumers – such as those with air conditioners or solar PV
systems – do not pay their full network costs under these structures, while other consumers pay more than they
should. Network tariffs for large consumers are typically more cost-reflective.

Changes to the National Electricity Rules which took effect in 2017 require distributors to make their tariffs more cost-
reflective so as to signal to retailers the cost of their customers’ use of the network and investment in DER. Retailers
are the primary focus of network tariff reform, because they act as the interface with consumers. They package
network tariffs with other costs (such as wholesale energy) in their retail price offers and decide how to reflect the
charges in those offers. It is up to the consumer to choose a retail offer that suits their needs, whether that be a flat
rate retail tariff or a more innovative product.

Tariff reform can encourage more efficient use of networks, delay the need for new investment, and reduce the
amount of infrastructure that needs to be maintained in the long term. Initially, reform focused on signalling costs
during peak demand periods (which historically drove network investment). More recent reform has involved sending
price signals to efficiently integrate DER – such as solar PV, batteries and EVs – into distribution networks.

As an example, the AER in 2020 approved SA Power Networks’ (South Australia) use of a ‘solar sponge’ tariff for its
residential consumers. This tariff offers a lower network charge during the middle of the day, when solar output is
highest, to encourage shifting of electricity use to those times. Raising demand for grid-supplied electricity in the
middle of the day can help manage voltage issues and thermal overloads associated with low demand, while shifting
demand away from the evening peak that can put heavy strain on the network. SA Power Networks also introduced a
demand tariff that offers discounted time of use rates and a seasonal peak demand component.30

Distributors are moving towards fully cost-reflective pricing in their second round of tariff structure statements, which
the AER considers as part of the revenue determination process. Progress has included:
›   simplifying tariff offerings to provide clear, consistent signals
›   designing tariffs that more closely reflect how consumers’ use of the network affects costs
›   applying an ‘opt-out’ or mandatory assignment policy that increases the number of consumers whose retailers will
    face these more cost-reflective tariffs
›   integrating network pricing with areas such as network planning, demand management and direct procurement of
    network services; and trialling alternative approaches.

In March 20201 the AEMC released a draft rule change to remove a prohibition on distributors charging for exports
and expanded the definition of ‘network services’ to include DER exports. The AER expects that the next (third) round
of tariff structure statements submitted by the distributors in NSW, Tasmania, the ACT and the Northern Territory will
signal the cost of serving both consumption and generation.31 The AER will continue to use an iterative approach to
advancing this reform and will consult with stakeholders to produce a non-binding guideline on how export tariffs will
be implemented.

28 Usually a combination of solar PV, batteries and a backup generator.
29 AEMC, Final report – updating the regulatory frameworks for distributor-led stand-alone power systems, May 2020.
30 SA Power Networks, 2020–25 regulatory proposal, Attachment 17 – tariff structure statement, January 2019.
31 The tariff structure statements are due in January 2023 and will take effect from 1 July 2024.

STATE OF THE ENERGY MARKET 2021                   Electricity networks                                                140
To support the transitional introduction of export tariffs the AEMC modified revenue recovery arrangements to allow distributors to trial alternative tariff structures during the regulatory period. The limited uptake of smart meters for residential and small business consumers has been a barrier to cost-reflective network tariffs being implemented in distribution networks outside of Victoria. Smart meters, which measure electricity use in half-hour blocks, are essential for cost-reflective network tariffs to be applied. At February 2021 around 39% of customers in the NEM had metering capable of supporting cost-reflective tariffs (including smart meters and manually readable interval meters). Installation rates vary across regions. Victoria was the first jurisdiction to progress metering reforms, with its electricity distribution businesses rolling out smart meters from 2009 to 2014. Around 98% of small consumers in Victoria have a smart meter. In other jurisdictions, the rollout of smart meters is occurring on a market-led basis, following changes to the National Electricity Rules which have been applicable since December 2017. All new and replacement meters installed for residential and small businesses consumers must now be smart meters, and other consumers can negotiate for a smart meter as part of their electricity retail offer. The changes to the rules also transferred responsibility for metering from distributors to retailers. The transition to retailer responsibility coincided with large delays in meter installations in some regions. Participants indicated reasons for the delays included poor coordination and data provision among network businesses, retailers and metering coordinators; inadequate retailer systems, processes and controls; and poor resourcing. But from February 2019 new rules required retailers to provide consumers with electricity meters within 6 business days from a property being connected to the network, or with replacement meters within 15 days.32 In December 2020 the AEMC announced a review of whether additional changes could help smart meters deliver more consumer benefits.33 Outside Victoria, in February 2021 NSW had the highest penetration of smart or interval meters, at around 25% of residential and small business customers. Installation levels in other regions ranged from 15% of customers in Queensland to 23% of customers in the ACT.34 This share is expected to increase, ranging from 30% for Essential Energy (NSW) to 63% for TasNetworks (Tasmania) by 2025, reflecting the requirement for new meters – including end of life replacements – to be smart meters. In March 2021 the NSW Government lifted restrictions on remote connection and disconnection of smart meters. Relaxing this restriction gives retailers an increased incentive to roll out more smart meters across NSW, delivering benefits to customers, particularly those in regional NSW who face higher fees for technicians to come out to their property.35 Around 24% of residential and small business customers outside of Victoria have moved to cost-reflective retail tariffs. Tasmania and NSW have seen the greatest take-up of these tariffs (at 47% and 41% of customers respectively), followed by the ACT (23% of customers). Customer adoption of cost-reflective tariffs remains low in Queensland (1% of customers) and South Australia (7% of customers). Distributors forecast the proportion of their residential consumers assigned to cost-reflective network tariffs will continue to increase from 2020 (figure 3.9). 32 AEMC, National Energy Retail Amendment (Metering Installation Timeframes) Rule 2018, rule determination, December 2018. 33 AEMC, Review announced into how electricity smart meters can deliver more customer benefits, 3 December 2020. 34 Estimates based on AER market intelligence. 35 The National Tribune, ‘Cutting red tape for smart meter savings’, The National Tribune, 15 March 2021. STATE OF THE ENERGY MARKET 2021 Electricity networks 141
Figure 3.9                                       Projected assignment of cost-reflective tariffs for residential consumers – electricity
                                                 distribution networks
                                      60%

                                      50%
Proportion of residential customers

                                      40%

                                      30%

                                      20%

                                      10%

                                      0%
                                                2017–18           2018–19           2019–20           2020–21          2021–22           2022–23        2023–24             2024–25

                                                                    Energex (Qld)                            Ergon Energy (Qld)                    Ausgrid (NSW)
                                                                    Endeavour Energy (NSW)                   Essential Energy (NSW)                SA Power Networks (SA)
                                                                    TasNetworks (Tas)                        Evoenergy (ACT)                       Power & Water (NT)

Source:                                     AER analysis of unpublished forecasts supplied by regulated electricity distribution businesses.

3.7.2                                            Ring-fencing
When a network business offers metering or other services in a contestable market, robust ring-fencing arrangements
must be in place to ensure the business competes fairly with other providers. Ring-fencing aims to ensure network
businesses do not use revenue from regulated services to cross-subsidise their unregulated products. It also aims to
deter discrimination in favour of affiliated businesses.

The AER administers a ring-fencing guideline that requires distribution network businesses to separate their regulated
network services (and the costs and revenues associated with them) from unregulated services, such as metering.
Unregulated services must be offered through a separate entity.

All distributors are required to comply with the AER’s ring-fencing guideline and annually report on their compliance
to the AER. Since 2017–18 the AER has generally observed fewer compliance issues and breaches. However,
compliance could still be improved in a number of areas, particularly in relation to protecting confidential information
about the network. When breaches have occurred, distributors have generally communicated promptly with the
AER, acted quickly to remediate any potential harms, and put a plan in place to prevent breaches from recurring. The
introduction of civil penalties in February 2020 will continue to help encourage improved compliance.

In 2019 the AER commenced a review of the current distribution ring-fencing guideline to strengthen some obligations
and simplify compliance. The review has since broadened to include consideration of the changing nature of services
offered by distribution businesses, including through the use of new technology such as stand-alone power systems
and storage devices. The competitive markets for distributor led stand-alone power systems and storage devices are
in their infancy and it is unknown how quickly these markets may develop.

Electricity distributors are showing interest in entering these markets to provide contestable services, and to realise
efficiencies in using storage devices to provide multiple services. In May 2021, the AER published its draft electricity
distribution ring-fencing guideline for stakeholder feedback.36 The amended guideline is scheduled to be finalised in
the third quarter of 2021.

36 AER, Draft ring-fencing guideline – Electricity distribution – version 3, May 2021.

STATE OF THE ENERGY MARKET 2021                                                 Electricity networks                                                                                  142
3.8 Revenue Network businesses earn revenue for providing numerous services to consumers. While some of these services are regulated, others are provided through competitive markets. For transmission network businesses we focus on components of their revenue associated with delivering prescribed transmission services. For distribution network businesses we focus on revenues associated with providing core distribution services – standard control services.37 Since 2006 the amount of revenue earned by network businesses has seen distinct trends – rapid growth (until around 2013 in transmission and 2015 in distribution), followed by a significant downturn. The downturn in revenue was more gradual for the transmission network businesses than it was for distributors. 3.8.1 Revenue trends Network revenues increased by around 6% per year from 2006 to 2015. With network charges absorbing around 43% of retail customer bills, this growth led to escalating retail electricity bills over the period. A 67% increase in the value of the RAB from 2006 to 2014 – caused by surging investment – was a key contributor to the increase in revenue. From 2014 investment weakened, but the impact of past overinvestment remains in the asset base (section 3.10). The ballooning asset base increased financing costs and depreciation charges, resulting in higher revenue allowances to cover these costs. Rising interest rates due to the global financial crisis compounded the impact on revenue. Operating expenditure also increased by an average of 6% per year from 2006 to 2012. Further, many AER decisions faced legal challenges over this period, often resulting in court decisions that increased network revenue. Revenue rose higher in Queensland and NSW than elsewhere. In Queensland, it grew by 14% per year from 2006 to 2015; in NSW, it rose by 14% from 2006 to 2013. Revenue growth was less dramatic in Victoria, increasing by a relatively stable 4% per year from 2006 to 2015. A key cost driver in Queensland and NSW was the stricter reliability standards imposed by state governments, which required new investment and operating expenditure to meet the new standards. Cost pressures began to ease when electricity demand from the grid plateaued, causing new investment to be scaled back from 2013. The changing demand outlook coincided with government moves to allow network businesses greater flexibility in meeting reliability requirements. The financial environment also improved after 2012, easing borrowing and equity costs. After peaking at over 10% between 2009 and 2013, rates of return approved for some network businesses were below 5% in 2021 (section 3.11). Energy rule reforms phased in from 2015 also helped stem growth in network revenue. The reforms, which explicitly linked network costs to efficiency factors, encouraged network businesses to better control their operating costs. In combination, these factors reduced the revenue needs of network businesses. But the 5-year regulatory cycle meant lower investment and rates of return often lowered revenue only after a significant lag. More generally, consumers will continue to pay for the overinvestment in network assets from 2006 to 2013 for the remainder of the economic lives of those assets, which may be up to 50 years. The Grattan Institute called for the asset bases of some networks to be written down so consumers do not pay for that overinvestment.38 The Australian Competition and Consumer Commission (ACCC) supported this position, particularly for government-owned networks in Queensland, NSW and Tasmania.39 Consumer groups and some industry observers remain concerned the regulatory framework enables network businesses to earn excessive profits. In response to calls for greater transparency around the actual returns earned by the network businesses, in 2018 the AER began publishing information on the businesses’ profitability. In September 2020 the AER released its first Electricity network performance report,40 which provides detailed analyses of key operational and financial trends as well as introducing a number of key profitability measures.41 The report enables stakeholders to make more informed assessments of the returns earned by each network business. 37 Standard control services may include network, connection and metering services. These services make up the bulk of the services provided by distribution businesses and are regulated by the AER. 38 Grattan Institute, Down to the wire – a sustainable electricity network for Australia, March 2018. 39 ACCC, Retail Electricity Pricing Inquiry – final report, June 2018 40 AER, Electricity network performance report, September 2020. 41 AER, Profitability measures for electricity and gas network businesses, final position paper, December 2019. STATE OF THE ENERGY MARKET 2021 Electricity networks 143
You can also read