Mapping Policy for Solar Irrigation Across the Water-Energy-Food (WEF) Nexus in India
←
→
Page content transcription
If your browser does not render page correctly, please read the page content below
Mapping Policy
for Solar Irrigation
Across the Water–
Energy–Food (WEF)
Nexus in India
REPORT

                                                                            Christopher Beaton
                                                                            Purva Jain
                                                                            Mini Govindan
                                                                            Vibhuti Garg
                                                                            Rashmi Murali
                                                                            Dimple Roy
                                                                            Andrea Bassi
                                                                            Georg Pallaske
                                                                            July 2019

© 2019 International Institute for Sustainable Development | IISD.org/gsi
Mapping Policy for Solar Irrigation Across the Water–Energy–Food (WEF) Nexus in India
© 2019 The International Institute for Sustainable Development
Published by the International Institute for Sustainable Development.
International Institute for Sustainable Development
The International Institute for Sustainable Development (IISD) is an Head Office
independent think tank championing sustainable solutions to 21st– 111 Lombard Avenue, Suite 325
century problems. Our mission is to promote human development and Winnipeg, Manitoba
environmental sustainability. We do this through research, analysis and Canada R3B 0T4
knowledge products that support sound policy-making. Our big-picture
view allows us to address the root causes of some of the greatest challenges Tel: +1 (204) 958-7700
facing our planet today: ecological destruction, social exclusion, unfair laws Website: www.iisd.org
and economic rules, a changing climate. IISD’s staff of over 120 people, Twitter: @IISD_news
plus over 50 associates and 100 consultants, come from across the globe and
from many disciplines. Our work affects lives in nearly 100 countries. Part
scientist, part strategist—IISD delivers the knowledge to act.
IISD is registered as a charitable organization in Canada and has 501(c)
(3) status in the United States. IISD receives core operating support
from the Province of Manitoba. The Institute receives project funding
from numerous governments inside and outside Canada, United Nations
agencies, foundations, the private sector and individuals.
About GSI
The IISD Global Subsidies Initiative (GSI) supports international Global Subsidies Initiative
processes, national governments and civil society organizations to align International Environment House 2,
subsidies with sustainable development. GSI does this by promoting 9 chemin de Balexert
transparency on the nature and size of subsidies; evaluating the economic, 1219 Châtelaine
social and environmental impacts of subsidies; and, where necessary, Geneva, Switzerland
advising on how inefficient and wasteful subsidies can best be reformed. Canada R3B 0T4
GSI is headquartered in Geneva, Switzerland, and works with partners
located around the world. Its principal funders have included the Tel: +1 (204) 958-7700
governments of Denmark, Finland, New Zealand, Norway, Sweden, Website: www.iisd.org/gsi
Twitter: @globalsubsidies
Switzerland and the United Kingdom, as well as the KR Foundation.
Mapping Policy for Solar Irrigation Across the Water–Energy–Food
(WEF) Nexus in India
August 2019
Written by Christopher Beaton, Purva Jain, Mini Govindan, Vibhuti Garg,
Rashmi Murali, Dimple Roy, Andrea Bassi and Georg Pallaske
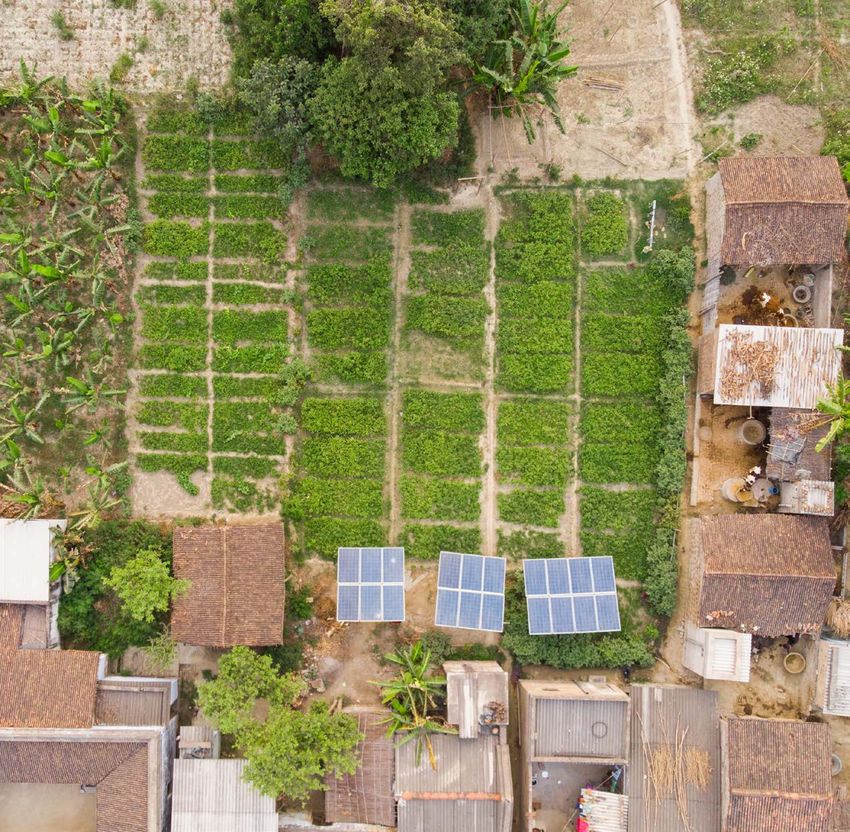
Photo: IWMI (CC BY-NC 2.0)
IISD.org/gsi iiMapping Policy for Solar Irrigation Across the Water–Energy–Food (WEF) Nexus in India
Acknowledgements
The authors of this issue brief would like to thank the following individuals and institutions for the valuable
comments and recommendations they provided as peer reviewers:
• Dr. Purnamita Dasgupta, Institute of Economic Growth (IEG)
• Ashwin Gambhir and Sreekumar Nhalur, Prayas (Energy Group)
• Dr. Dinesh Kumar Goyal, Government of Rajasthan and Bhabha Atomic Research Centre (BARC)
Scientist
• Abhishek Jain, Council on Energy, Environment and Water (CEEW)
• Jitesh Kumar, Indo-German Energy Program (IGEN Access)
• Tirthankar Mandal, Pamli Deka, Harsha Meenawat and Uttara Narayan, World Resources Institute
(WRI)
• Dr. Rajendra Singh Paroda, Department of Agricultural Research and Education (DARE), Government
of India
• Sonakshi Saluja, Initiative for Sustainable Energy Policy (ISEP)
• Shilp Verma, International Water Management Institute (IWMI)
The authors would also like to thank Nilanjan Ghose and Diego Senoner, GIZ, for their valuable guidance and
feedback throughout the project lifetime.
The International Institute for Sustainable Development (IISD) and The Energy and Resources Institute
(TERI) have been supported in this study by the GIZ Indo-German Energy Programme – Promotion of
Solar Water Pumps (IGEN-PSWP). The promotion of the solar water pumps program is a bilateral technical
cooperation between the German Federal Ministry for Economic Co-operation and Development (BMZ) and
the Indian Ministry of New and Renewable Energy (MNRE). This study was also supported by the Norwegian
Ministry for Foreign Affairs (NMFA) as part of its contribution to IISD’s Global Subsidies Initiative (GSI). The
opinions expressed and the arguments employed in this paper do not necessarily reflect the views of the peer
reviewers and funders, nor should they be attributed to them.
IISD.org/gsi iiiMapping Policy for Solar Irrigation Across the Water–Energy–Food (WEF) Nexus in India
Table of Contents
1.0 Introduction.................................................................................................................................................................................... 1
2.0 Scope and Approach.................................................................................................................................................................. 2
3.0 Key WEF Interlinkages for Off-Grid Solar Pumps.......................................................................................................4
3.1 Global and Indian Context.....................................................................................................................................................................4
3.1.1 Irrigation from Groundwater in India............................................................................................................................. 5
3.2 WEF Interlinkages for Off-Grid Solar Pumps in India: Drivers and impacts.................................................. 6
3.2.1 Drivers..................................................................................................................................................................................................... 7
3.2.2 Impacts................................................................................................................................................................................................. 8
3.3 Visualizing WEF Interlinkages and Feedback Loops......................................................................................................11
4.0 Mapping Relevant Policies for Off-Grid Solar Pumps Across the WEF Nexus.......................................... 14
4.1 Structure of Mapping.............................................................................................................................................................................. 14
4.2 Results of Mapping....................................................................................................................................................................................15
4.2.1 Solar Support Policies........................................................................................................................................................... 16
4.2.2 Efficiency Policies......................................................................................................................................................................19
4.2.3 Water Resource Management........................................................................................................................................20
4.2.4 Production-Based Interventions to Increase Farmer Incomes.............................................................23
4.2.5 Price Interventions, Instruments in Food Markets and Others ........................................................... 26
4.3 Key Findings................................................................................................................................................................................................... 28
5.0 Recommendations....................................................................................................................................................................30
References............................................................................................................................................................................................32
IISD.org/gsi ivMapping Policy for Solar Irrigation Across the Water–Energy–Food (WEF) Nexus in India
Acronyms and Abbreviations
AgDSM Agriculture Demand Side Management
BEE Bureau of Energy Efficiency
CEA Central Electricity Authority
DISCOM distribution company
DoACFW Department of Agriculture, Cooperation & Farmers’ Welfare
eNAM National Agriculture Market
FAO Food and Agricultural Organization of the United Nations
FRP Fair and Remunerative Price
FY fiscal year
IRENA International Renewable Energy Agency
JNNSM Jawaharlal Nehru National Solar Mission
KUSUM Kisan Urja Suraksha evam Utthaan Mahaabhiyan
MGNREGA Mahatma Gandhi National Rural Employment Guarantee Act
MIF Micro Irrigation Fund
MNRE Ministry of New and Renewable Energy
MSP minimum support price
PDS Public Distribution System
PIB Press Information Bureau
PMKSY Pradhan Mantri Krishi Sinchayee Yojana
PV photovoltaic
RKVY-RAFTAAR Rashtriya Krishi Vikas Yojana—Remunerative Approaches for Agriculture and Allied Sector
Rejuvenation
SASM Scheme for Assistance to Sugar Mills
SDG Sustainable Development Goal
UNICEF United Nations Children’s Fund
WEF water–energy–food
WHO World Health Organization
IISD.org/gsi vMapping Policy for Solar Irrigation Across the Water–Energy–Food (WEF) Nexus in India
1.0 Introduction
This paper seeks to assist policy-makers and researchers in India who are working to promote the uptake of off-
grid, solar-powered pumps for groundwater irrigation (“off-grid solar pumps”).
Implementing such policies can be challenging because of the complicated interconnections between water,
energy and food—often referred to as the “water–energy–food nexus” or WEF nexus. This briefing sets out
key WEF linkages of importance for off-grid solar pumps. It then establishes an approach for identifying
policies across the WEF nexus that are key for off-grid solar pumps and maps these policies at the Central
Government level and in two states: Bihar and Rajasthan. Based on these findings, the paper concludes with
recommendations for policy-makers.
IISD.org/gsi 1Mapping Policy for Solar Irrigation Across the Water–Energy–Food (WEF) Nexus in India
2.0 Scope and Approach
There are many ways that solar energy can power irrigation. According to the most recently published
planning documents,1 the Government of India’s upcoming Kisan Urja Suraksha evam Utthaan Mahaabhiyan
(KUSUM) scheme will support the installation of: (i) stand-alone off-grid solar pumps to replace existing
diesel pumps; (ii) decentralized ground or stilt-mounted, grid-connected solar power plants (~0.5–2.0 MW) by
individual or group farmers, cooperatives or panchayats based on expressions of interest issued by distribution
companies (DISCOMs) and available sub-station surplus capacity; and (iii) “solarizing” existing grid-connected
pumps by outfitting them with solar panels, and allowing owners to sell excess electricity back to DISCOMs
(Ministry of New and Renewable Energy [MNRE], n.d.). Pumps can also draw from different water sources:
surface water or groundwater.
This brief is focused exclusively on off-grid solar pumps that draw from groundwater—for ease of expression,
this is referred to throughout this paper as “off-grid solar pumps.” This is not intended to imply that off-grid
solar pumps are the only approach to increasing access to affordable irrigation services. Rather, it is a scoping
decision that was taken to limit the complexity of an initial foray in this issue area. The paper is not intended
to quantify the costs and benefits of different forms of irrigation or to provide detailed guidance on the
circumstances in which different forms of irrigation are best and worst suited.
The term “WEF nexus” is defined as the principle that “these sectors [are]... inextricably linked so that
actions in one area commonly have impacts on others, as well as on ecosystems” (United Nations Economic
Commission for Europe, n.d.). As an “approach,” it means holistically considering all three areas, regardless
of an intervention’s original entry point. “Food” is used as a proxy term that encompasses all issues linked
to agriculture, including both food-producing and non-food-producing activities. While all three sectors are
interlinked, they are not considered to have equal weight: a person can survive a lifetime without energy, days
to weeks with no food but only a few days without water. This should be taken into account when prioritizing
between different WEF challenges and impacts. A WEF approach can help address policy incoherence, gaps in
knowledge, technology lock-ins, equity and access to resources for vulnerable populations (de Amorim et al.,
2018; International Centre for Integrated Mountain Development, 2012; Organisation for Economic Co-
operation and Development, 2014; Reinhard, Verhagen, Walters, & Ruben, 2017; World Economic Forum, 2011;
World Energy Council, 2016).
In the context of off-grid solar pumps, this paper distinguishes between two contexts where policy-makers and
researchers may be concerned about interconnections:
• Drivers: People seeking to promote the deployment of solar pumps may be interested in existing water,
energy and food policies that affect technology adoption, such as energy subsidies or income transfers for
farmers.
• Impacts: People monitoring the effects of large-scale deployment of off-grid solar pumps may be tracking
the positive and negative impacts of increased deployment, particularly on groundwater resources.
In practice, many impacts of off-grid solar pumps may also be “drivers” that influence deployment: for example,
water scarcity may increase demand for irrigation services, but unsustainable irrigation practices may have
1
As of the time of writing, the exact status of the government’s KUSUM scheme is not fully clear. Launch of the scheme
was approved by Cabinet before the 2019 election, at which time a budget allocation of INR 34,422 crore over three years
was announced (Press Information Bureau [PIB], 2019a). There is no explicit line allocation for KUSUM in the expenditure
report for the budget for FY 2019/20, but press reports in late 2018 suggested that it might be funded through borrowing by
the Indian Renewable Energy Development Agency (IREDA), following challenges with securing funding (Ministry of Finance,
2019c; Mishra, 2018). It is not clear when the program will formally launch, and it remains feasible that there could be delays
or changes in its design.
IISD.org/gsi 2Mapping Policy for Solar Irrigation Across the Water–Energy–Food (WEF) Nexus in India
impacts on scarcity. While acknowledging this tension, the paper maintains these categories to reflect the
different entry points that policy-makers and researchers may have with this issue area.
The paper begins with a targeted review of literature to identify the key WEF interconnections of importance
for off-grid solar pumps. This is then used to develop a causal loop diagram—a visual illustration of causes and
effects across all three sectors. Subsequently, the causal loop diagram is used to develop a simple analytical
framework that can be used to identify and map the most important policies for practitioners who are working
on drivers and impacts. This mapping focuses on policies of the Central Government and two states, Bihar and
Rajasthan, to illustrate how different issue areas are addressed at different levels of government. These states
were chosen based on an assessment of multiple criteria, including the need to include one water-abundant
and one water-scarce state, as well as net sown area, net area under irrigation from tube wells, food and power
subsidy expenditure, and the number of diesel and electric pumps deployed. The results of the policy mapping
are summarized in this paper and can be found in full detail online at the following link:
https://www.iisd.org/sites/default/files/uploads/india-wef-mapping-2019.xlsx
IISD.org/gsi 3Mapping Policy for Solar Irrigation Across the Water–Energy–Food (WEF) Nexus in India
3.0 Key WEF Interlinkages for Off-Grid Solar Pumps
3.1 Global and Indian Context
Globally, many people do not have adequate access to water, energy and food: 2.1 billion people lack access
to safely managed drinking water (World Health Organization & United Nations Children’s Fund [UNICEF],
2017); almost 1 billion lack access to electricity and 2.7 billion lack access to clean cooking (International
Energy Agency, 2017); and 821 million face chronic food deprivation (Food and Agricultural Organization of
the United Nations [FAO] et al., 2018). Yet water, energy and food systems are all under increasing pressure
from rapid growth in economies, consumption patterns and population. By 2050, it is estimated that the
demand for energy will nearly double globally, with water and food demand estimated to increase by over 50
per cent (FAO, 2011a; International Renewable Energy Agency [IRENA], 2015). Growing scarcity can worsen
access to basic needs and the integrity of ecosystems, as well as fuel conflicts (FAO, 2014).
The Sustainable Development Goals (SDGs) recognize the need to deliver access sustainably through dedicated
goals on each theme: SDG 2 (zero hunger), SDG 6 (clean water and sanitation) and SDG 7 (affordable and
clean energy) (United Nations Development Programme, 2015). As targets, the SDGs cannot themselves
recognize or address linkages, but if all three targets are to be met by 2030, then it is important to weigh up
potential trade-offs when implementing policies in one area that have impacts on another (Fade, Cranmer,
Lawford, & Engel-Cox, 2018; Pahl-Wostl, 2019). The interconnections between water, energy and food are
striking: agriculture accounts for around 70 per cent of fresh water withdrawn globally (AQUASTAT, 2016;
FAO, 2011b). The energy sector (primary energy production and electricity generation) accounts for 10 per
cent of water withdrawals and 3 per cent of total global water consumption (International Energy Agency,
2016). Food production and supply is estimated to contribute to 30 per cent of the world’s energy consumption
(FAO, 2011a).
In India, pressure on water, energy and food systems is anticipated to be more intense than the global average,
despite great improvements in the last decade. It is estimated that 600 million people in India face high to extreme
water stress and 7 per cent of India’s population did not have access to at least basic drinking water services in
2017 (NITI Aayog, 2018; UNICEF & World Health Organization [WHO], 2019). While India has achieved
almost universal connections to electricity, there are still challenges with service reliability, and many households
continue to rely on biomass for cooking (Jain et al., 2018). Adequate access to food remains a challenge, with
14.8 per cent of the population estimated to be undernourished and stunting estimated to be prevalent among
38.4 per cent of children under five years of age in the period 2015–17 (FAO et al., 2018). Agriculture is a key
sector, having contributed 14.9 per cent of India’s gross value added in fiscal year (FY) 2017/18, and crops alone
contributing 8.7 per cent of gross value added in the same year (Ministry of Finance, 2019a). It is estimated that
jobs in the sector made up 43 per cent of total employment in 2018 (World Bank, n.d.a).
As an emerging economy with a rising population, India’s high growth in incomes and consumption will also
create added pressure on water, energy and food systems. The latest economic survey estimates that India’s per
capita energy consumption needs to increase by 250 per cent to reach a middle-income level and 400 per cent
to reach very high human development level (Ministry of Finance, 2019a). By 2050, it is estimated that water
requirements may be as high as 1,180 billion m3 in comparison to present-day availability of 695 billion m3
and a total availability of 1,137 billion m3 (NITI Aayog, 2018). The importance of agriculture to meeting basic
needs and the economy also makes India particularly vulnerable to rising average temperatures and changing
rainfall patterns (Rathore, Das, & Chauhan, 2018).
IISD.org/gsi 4Mapping Policy for Solar Irrigation Across the Water–Energy–Food (WEF) Nexus in India
3.1.1 Irrigation from Groundwater in India
The FY 2018/19 economic survey reports that almost 89 per cent of the groundwater extracted in India is for
irrigation (Ministry of Finance, 2019a). The Statistical Year Book India 2018 provides a breakdown of irrigation
by state and by type of irrigation (Ministry of Statistics and Programme Implementation, 2018). In FY 2014/15,
out of a total net area sown of 140 million hectares, around 49 per cent was irrigated in some way. Of this,
approximately 46 per cent was drawn from groundwater by tube wells and a further 17 per cent by other types
of wells.
It is hard to identify good data on the number of pumps powered by different energy sources. Data on
agricultural pumps have not yet been made available from the latest agricultural census (2015/16). According
to the previous census in 2010/11, there were around 14.3 million pumps powered by grid electricity and 6.3
million powered by diesel (Ministry of Agriculture and Farmers’ Welfare, 2015). According to the Fifth Census of
Minor Irrigation Schemes Report (Government of India, 2017), which covers irrigation schemes with a culturable
command area up to 2,000 hectares, there were 21.7 million irrigation schemes in 2014/15, of which the large
majority (94.5 per cent) drew on groundwater. Of the 20.2 million schemes with a water lifting device, around
72 per cent were fully or partially powered by grid electricity and 23.7 per cent were fully or partially powered
by diesel. The census identified only 2,874 pumps (0.01 per cent) fully powered by solar energy. A further
10,112 (0.05 per cent) were powered by a mix of solar and grid electricity and 2,270 (0.01 per cent) by a mix
of solar and diesel. It is likely that deployment of solar pumps has increased considerably in recent years, driven
by government programs, high diesel prices and declining groundwater. According to the Ministry for New and
Renewable Energy, close to 150,000 solar pumps had been installed as of end-December 2017 and 196,000 by
end-October 2018 (MNRE, 2018; PIB, 2018a).
Energy consumption linked to conventional irrigation pumps is significant. The Central Electricity Authority
(CEA, 2018a) reports that agriculture accounted for 18.1 per cent of total electricity consumption in India
in FY 2017/18. According to the last review of national petroleum product demand in 2013, agricultural
pumpsets accounted for 3.3 per cent of all end-use diesel consumption, with the highest usage in north and
east India (Nielsen, 2013). This does not include the large volume of subsidized kerosene that is diverted for
use in diesel pumps. The potential for off-grid solar pumps depends on many factors, but if the technology
continues to improve in its cost-effectiveness then it is feasible to assume it could be as large as the existing
stock of grid-connected electric and diesel pumps. When its launch was approved by Cabinet, it was
announced that the KUSUM scheme would aim to deploy 1.75 million solar pumps by 2022. The Institute
for Energy Economics and Financial Analysis estimated that replacing 21 million on-grid electric pumps
and 8.8 million diesel pumps with solar alternatives would alone achieve 38 per cent of India’s target for
renewable energy capacity (Garg, 2019).
Much irrigation today is highly inefficient. Among minor irrigation schemes surveyed in FY 2014/15, the
majority (63 per cent) used open water channels that are subject to evaporation and more likely to have issues
with leakage (Government of India, 2017). Surface pipes and underground pipes were used by 25.8 per cent
and 15 per cent of schemes, respectively, while only 3.3 per cent used sprinkler systems and 1.9 per cent drip
irrigation (Government of India, 2017). Cropping patterns have also created more reliance on irrigation: water-
intensive crops are grown in water-scarce areas, and large-scale hybrid crops, introduced as part of the green
revolution, are more water intensive than indigenous species (Flachs, 2016).
India has seen a steady decline in renewable internal freshwater resources per capita over the last decades, from
3,082 m3 in 1962 to 1,444 m3 in 1997 and 1,155 m3 in 2014 (World Bank, n.d.b). As of the last groundwater
assessment in 2013, India’s total groundwater availability was 411 billion m3 and the annual withdrawal rate
was 253 billion m3 (Central Ground Water Board, 2017). An assessment of 1,034 sites found that around 10
per cent were in a semi-critical state (consumption above 70 per cent of availability), 4 per cent in a critical state
IISD.org/gsi 5Mapping Policy for Solar Irrigation Across the Water–Energy–Food (WEF) Nexus in India
(consumption above 90 per cent of availability) and 15 per cent were overexploited (consumption above 100
per cent of availability) (Central Ground Water Board, 2017). Overexploitation was clustered in the northwest,
including Punjab, Haryana, Delhi and Western Uttar Pradesh; in the west, particularly parts of Rajasthan and
Gujarat; and in the south, including parts of Karnataka, Andhra Pradesh, Telangana and Tamil Nadu (Central
Ground Water Board, 2017). Analysis of more recent Central Ground Water Board data on well depth by the
Vasudha Foundation shows that, in the pre-monsoon period, groundwater levels are close to drought-like
conditions in many regions and that most regions are likely to be included in the “water-stressed” category by
2040 (Krishnaswamy & Singh, 2018).
3.2 WEF Interlinkages for Off-Grid Solar Pumps in India: Drivers and
impacts
Some policy-makers and researchers in India are principally concerned with driving the deployment of solar
pumps, while others are focused more on the potential impacts of increased deployment. In both areas, there are
key WEF interlinkages that influence outcomes. Figure 1 summarizes this at a high level.
Figure 1. Summary of main drivers and impacts
Drivers Impacts
Water: Changing rainfall Water: Improved access for
patterns agriculture and drinking water;
Energy: Energy subsidies increased stress on quantity
and pricing structures; solar and quality of groundwater
irrigation market maturity resources
Food: Growing demand for food Energy: Improved energy supply,
and food security subsidy savings
Socioeconomic needs: Food: Increased productivity,
Affordability of high up-front increased stress on land and
costs soils
Socioeconomic needs: Improved
incomes, jobs, resilience for
farmers
IISD.org/gsi 6Mapping Policy for Solar Irrigation Across the Water–Energy–Food (WEF) Nexus in India
3.2.1 Drivers
Key drivers that help or hinder efforts to increase deployment of off-grid solar pumps are summarized below,
with illustrative arguments and estimates from a range of literature.
1. Affordability of high up-front costs
The high up-front cost of off-grid solar pumps is a primary barrier to technology deployment: the
average up-front cost of solar pumps is estimated at 5–15 times their diesel equivalents (Lazard,
2014, in Closas & Rap, 2017; Pullenkav, 2017; Shah, 2018). Over the long term, solar pumps are
cheaper than diesel pumps because they do not have any significant recurring costs. Pullenkav
(2017) estimates that over 10 years, the net cost of a solar photovoltaic (PV) pump is 64.2 per
cent the net cost of a diesel pump. Agrawal and Jain (2016) estimate that solar pumps remain
more costly than grid-connected electric pumps but note that they may still be preferred due to
ongoing challenges with the unreliability of electricity supply in some parts of the country.
Many policy interventions are focused on this driver, with the earlier National Solar Mission
and now the KUSUM scheme offering capital subsidies to farmers for solar pumps (MNRE, n.d.;
Pullenkav, 2017; Shah, 2018). In the past, MNRE has also provided soft loans and accelerated
depreciation to support solar PV pump investments (Pullenkav, 2017). In some cases, such
subsidies can also create barriers or distributional inefficiencies if policies fail to operate
as intended (Closas & Rap, 2017; Pullenkav, 2017). As subsidy transfers are reliant on policy
consistency, they may also constitute an unreliable revenue stream, such as in Morocco where
targeted subsidies for solar pumps were put on hold over concerns about the depletion of
groundwater (Closas & Rap, 2017).
The relative affordability of high up-front costs is also indirectly affected by average
farmer incomes. This may be affected by numerous initiatives, such as allowing farmers to
sell excess electricity back to the grid or more general agricultural sector policies such as
price floors for certain crops or fertilizer subsidies. The impacts of such policies also have
complex WEF interlinkages.
2. Energy subsidies for conventional pumps
Subsidies for conventional energy lower the prices paid by farmers for grid-based and diesel
pumping, decreasing running costs and making it harder for solar pumps to compete. Most
states in India provide some degree of electricity subsidy for agricultural consumers, and in
many cases they are substantial. Blanket Central Government subsidies for diesel were removed
in 2014, but some state governments, challenged by drought, have continued to provide diesel
subsidies to farmers (Jayan & Mishra, 2019). Electricity subsidies for farmers are estimated to
be around INR 300 billion (USD 6.9 billion) per year (Garg, 2019). Reforming subsidies is complex:
in Punjab, for example, research has shown that popular pressure and lobbies have ensured free
or highly subsidized power to farmers (Prajapati, 2018).
Pricing structures also affect usage. In some states, such as Gujarat, electricity tariffs are flat,
thus making the marginal cost of electricity for tube well owners zero. Subsidies also mask
the true cost of irrigation, reducing incentives for efficient water use and contributing to the
overdrawing of groundwater and depletion of aquifers.
IISD.org/gsi 7Mapping Policy for Solar Irrigation Across the Water–Energy–Food (WEF) Nexus in India
3. Solar irrigation market maturity
The state of markets for solar irrigation (supply, sales expertise, service delivery, maintenance
and repairs) has had a significant impact on the viability of solar irrigation (Closas & Rap,
2017). The sustainability of the market can be supported or undermined depending on the
effectiveness of the policy tools and frameworks used to promote a new technology. India’s
experiences with solar PV for lighting would also suggest that an insufficiently mature market
can also create problems post-deployment, particularly when after-sales services such as
maintenance and repair have not been accounted for in costs and are in low supply (Gill,
Shardul, Sharma, & Bridle, 2018). IRENA (2016) argues that four “building blocks” are required
to support solar irrigation: distribution channels; delivery model and access to financing;
awareness raising and capacity building; and policy and regulatory environments.
4. Changing rainfall patterns and water availability
Irrigation can play a critical role to help farmers adapt to changing rainfall patterns and water
availability driven by climate change (Pullenkav, 2017; Shah, 2009). Shah (2009) highlights
some of the potential impacts of climate change on surface and groundwater in India. While
the change in overall water availability is unknown, the increase in variability is certain,
promising more intense and larger rainfall events followed by longer dry spells. In turn, this
means heightened risks of floods and droughts for kharif crops and more evapotranspiration
for rabi crops, leading to more water storage and irrigation needs across the year. Groundwater
sources—if they are used sustainably—provide a more resilient, long-term water supply, as they
respond more slowly to drought and evapotranspiration.
5. Demand for food and food security
India’s growing population and incomes will drive significant growth in food consumption in
the coming decades. Increasing demand can be anticipated to drive higher food prices, which
in turn ought to influence the profitability of investments in the most cost-effective means
of irrigation. While food prices are fixed for a large share of the population through Public
Distribution System (PDS) prices, it is assumed that this dampening of price signals will not
fully counteract this feedback mechanism.
3.2.2 Impacts
Key “impacts” that might derive from increased deployment of off-grid solar pumps are summarized below.
Many of these are positive: solar irrigation is being promoted in India because of its potential to address
challenges in a range of areas, including agricultural productivity, greenhouse gas emissions, energy system
demand and drinking water supplies. In other areas, particularly water, solar irrigation could add new pressures
on the WEF system, depending on how and where it is implemented.
IISD.org/gsi 8Mapping Policy for Solar Irrigation Across the Water–Energy–Food (WEF) Nexus in India
1. Agricultural productivity, farmer incomes and employment
For farmers who do not already use some form of irrigation, the deployment of solar pumps will
improve agricultural productivity and thereby incomes. This can be done by improving yields on
existing cropped lands, allowing for the expansion of the total cropped area, allowing the growth
of more diverse higher-value crops and, in some cases, increasing the possibility of growing
two or three crops in a year (multiple cropping). In Bihar, for example, irrigation allows for a
third crop—consisting of paddy, maize or vegetables—that can be grown in the summer season
(Pullenkav, 2017). A World Bank (2018) project in West Bengal estimates that micro-irrigation
projects have been able to more than double farmers’ income.
For farmers who already use some form of conventional pump, there will still be an effective
increase in income because of the extremely low recurring costs of solar pumps. For the same
reason, they may be able to run pumps for longer than before, with benefits for productivity
and incomes. In Rajasthan, for example, Gupta (2019) found that solar pumps resulted in higher
profits from increased gross cropped area and the cultivation of fruit and vegetables, as well
as lower electricity consumption by those farmers who are using electric or diesel pumps in
addition to solar pumps. Kishore, Shah and Tewari (2014) also found that there were time
savings from labour associated with the operation of diesel pumps. These benefits for farmers
also create indirect benefits for the local rural community (IRENA, 2015).
Solar pumps can also generate income if policy frameworks allow farmers to sell excess electricity
back to the grid (Closas & Rap, 2017). Electricity sell-back schemes could be particularly well-
suited for water-stressed areas, because they create a financial value for excess energy and
therefore reduce incentives for overexploitation of water resources (Shah & Kishore, 2012). The
distributional impacts of these policies will depend on whether policy benefits are provided to all
farmers or targeted specifically at small landholders. In a survey of three districts in Rajasthan, the
majority of beneficiaries of a 2011 solar pumps scheme had larger-than-average landholdings and
none was a small-scale or marginal farmer (Kishore et al., 2014).
2. Financial savings and carbon savings associated with conventional energy
To the extent that solar pumps can replace existing conventional pumps, they can reduce the
need for government subsidy expenditure on electricity and diesel. Electricity subsidies for
farmers are estimated at over INR 500 billion (USD 7.3 billion) per year, including state transfers
and cross-subsidies (Garg, 2019). Solar pumps can also reduce the significant import bill
associated with these fuels, improving the current account deficit (Shim, 2017). The replacement
of conventional pumps will similarly reduce greenhouse gas emissions associated with grid- and
diesel-based pumpsets. Shah (2009) estimates that conventional groundwater pumping was
responsible for 16 million–25 million tonnes of carbon emissions, equal to around 4–6 per cent
of India’s total carbon emissions. Agrawal and Jain (2016) estimate that replacing 10 million
diesel pumps could reduce emissions by 26 million tonnes annually, equal to 1.2 per cent of total
carbon dioxide emissions in 2010.
IISD.org/gsi 9Mapping Policy for Solar Irrigation Across the Water–Energy–Food (WEF) Nexus in India
3. Impacts on energy and drinking water services
By replacing existing grid-connected pumps with solar pumps, demand on electricity DISCOMs
will fall, reducing grid failures and voltage fluctuations. In some cases, farmers have even used
capacitors to convert two-phase power to three-phase power, in turn affecting household
supply (Reinhard et al., 2017).
Where it is possible for farmers to sell excess electricity back to the grid or water to local
markets, this service also has a value beyond its immediate impact on farmer incomes. The
sale of electricity back to the grid can further relieve pressure on DISCOMs, also contributing
to improved power supply. Improved availability of fresh water for drinking can help rural
households meet their basic needs, which in some cases is currently dependent on unreliable
grid electricity (Chandel, Naik, & Chandel, 2015). Both the National Solar Mission and KUSUM
schemes recognize the contribution that solar energy can make to pumps for drinking water.
4. Increased stress on water resources due to low-cost energy and higher productivity
The extremely low recurring costs of solar pumps mean that there is no economic incentive to
use groundwater conservatively because there is no financial cost associated with either energy
or water when irrigating. If this allows farmers to grow more crops per season or in an additional
season, it will increase their total water withdrawals. This can aggravate the stress on existing
water resources.
A review of international experience found that this risk is generally inadequately evaluated by
feasibility studies (Closas & Rap, 2017). In practice, the extent to which solar pumps increase
water stress is dependent on many factors. In India, risk varies significantly between regions
that are relatively groundwater-abundant, such as northern and eastern India, and regions
where groundwater stress is already severe, such as western and southern India (Pullenkav,
2017; Shah & Kishore, 2012). It will also vary by the way that states’ cropping patterns create
different demand for water at different times of year: for example, in Bihar, Uttar Pradesh and
Madhya Pradesh, wheat irrigation in the winter season (rabi); in West Bengal, summer paddy
irrigation (zaid); and in Punjab and Haryana, during monsoon season (kharif) (Shah & Kishore,
2012). In the medium term, it is anticipated that solar pumps could drive an emphasis on
crops during the winter and summer seasons, including pre-summer boro rice (Shah & Kishore,
2012). Water stress can also vary significantly within a state. Another factor is time: data on
present-day water stress may fail to account for anticipated future trends. Projections have
estimated that most regions in India are likely to be in the “water-stressed” category by 2040
(Krishnaswamy & Singh, 2018).
Policy frameworks can potentially also influence the likelihood of water stress. As noted
above, allowing farmers to sell back excess solar energy to the grid helps to create financial
value for energy that incentivizes farmers to minimize unnecessary pumping (Shah & Kishore,
2012). Similarly, eligibility restrictions on assistance schemes can be used to help promote
more efficient irrigation practices. In Rajasthan, the Solar PV Pumping Programme of 2011
required farmers to have a drip irrigation system (Kishore et al., 2014). Agarwal and Jain
(2018) note the relationship between the capacity of promoted pumps and their ability to
draw water. Other policies that generally promote efficient water usage in agriculture could
IISD.org/gsi 10Mapping Policy for Solar Irrigation Across the Water–Energy–Food (WEF) Nexus in India
also help complement impacts of lower recurrent irrigation costs, such as the use of water
meters and monitoring (Closas & Rap, 2017, citing IRENA, 2016). Policies can also inhibit
economic feedback mechanisms that would naturally influence farmer cropping choices. For
example, minimum support prices for agricultural producers will prevent price signals from
affecting an oversupply of goods.
Increased stress on groundwater has significant negative feedback loops with many of the
desired impacts from solar irrigation: reducing yields, incomes, jobs, resilience and stocks of
fresh water for drinking and energy production. Shim (2017) argues that many such impacts
have already taken place in some parts of India following the provision of subsidies for grid-
based and diesel irrigation pumpsets.
5. Declining water quality from groundwater overuse
Groundwater overuse can result in a decline in water quality (Greene et al., 2016; Krishnan, Patel,
Raychoudhury, & Purohit, 2009; Shankar et al., 2011). Greene et al. (2016) highlight irrigation-
associated salinity as salinity caused by the accumulation of salts in the root zone of aquifers
due to over-extraction and inadequate drainage. A study involving 593 districts in India found
that 203 districts have high fluoride content, 206 have high iron content, 137 have high salinity,
109 have high nitrate content and 35 have high arsenic content (Department of Drinking
Water Supply, 2006). To the extent that increased cropping is associated with higher rates of
fertilizer use, this may also have impacts on water quality. According to a review of the impacts
of nitrogen-rich fertilizer in India, a number of states, including Haryana, Punjab and Western
Uttar Pradesh, have nitrate limits that exceed the levels set by the WHO. A review for the Lok
Sabha noted that this risk is highest in areas with light textured soils and can be mitigated
by restricting fertilizer use and promoting more sustainable cropping patterns (Standing
Committee on Agriculture, 2016). Policy frameworks can influence the extent to which farmers
use fertilizer. The Central Government’s Aadhaar-enabled Fertilizer Distribution System (AeFDS)
provides substantial subsidies for fertilizer use but also aims to limit the quantity of subsidized
fertilizer according to the size of a farmer’s land holding (Babu, 2016).
3.3 Visualizing WEF Interlinkages and Feedback Loops
One of the main challenges for policy-making on off-grid solar pumps is that water−energy−food drivers
and impacts are all interlinked. For example, lowering the up-front capital cost of agricultural pumps may
increase productivity and farmer incomes, but if they contribute to high levels of groundwater stress, then
over the medium term they may end up reducing productivity and incomes. This, in turn, may affect the
affordability of irrigation.
Figure 2 summarizes the various drivers and impacts identified in the literature review by visualizing an
interconnected system of feedback loops. Parts of the system that share direct relationships with one another
are connected by arrows, and the nature of the relationship is indicated by a plus (+) or a minus (-) sign. With
a positive relationship, an increase in the first variable will result in an increase in the second variable. With a
negative relationship, the second variable will decrease. Symbols also identify some of the major “reinforcing
loops” (where changes drive one another to larger and larger impacts) and “balancing loops” (where system
IISD.org/gsi 11Mapping Policy for Solar Irrigation Across the Water–Energy–Food (WEF) Nexus in India
constraints naturally check reinforcing loops). The main loops are food prices—where higher supply can reduce
prices and stimulate further demand for more supply—and water stress—where the finite availability of water
acts as a balancing force on food demand. The places that are significantly influenced by government policy are
highlighted in green.
The causal loop diagram attempts to present the complexity of WEF interrelationships without becoming overly
detailed in complex subsystems. There are necessary limits to its complexity: for example, it does not attempt to
illustrate non-linear relationships, and it does not attempt to estimate the relative magnitude of positive and
negative relationships.
air pollutant
emissions
forex +
+ -
savings potential new revenue
- + +
R6 or electricity sales
change
+
coal-fired power - levelized (recurring)
and diesel precipitation variability + cost of irrigation
crop
consumption - floods insurance
precipitation + higher-value crop
+
+ + production + - + land
surface - + + food
water + revenues for tenure
groundwater - - land +
water production farmer
recharge groundwater productivity + + access to
- stress for B2 -
interventions shortages + PDS pricing premium
- farmers + food
system + + markets
B3 + fertilizers price population + +
B4 - - - R2 growing ++ + +
+ + + agriculture B1 + + +
groundwater use cycles
groundwater + + land R1 food - farmer income and
stock - for irrigation R5 + well-being
+ - + R3 fertilizer + demand +
- subsidy demand for crop + per capita
off-grid + production + income
consumption crop water -
solar pumps
by other demand + minimum support
irrigation R4 demand for high-
water users - price for farmers
efficiency value crops
- + awareness B5
water + +
+ soft loans subsidies subsidies
irrigation -
+ - + +
+
net relative reliability access to + capital +
metering and convenience of finance - cost black market
alternatives + (below cost)
R7 credit
- power cuts kerosene trade
and limited worthiness
energy
hours of supply efficiency
+ - +
+ electricity
subsidies affordability of
- adulteration or substitution
alternatives
electricity of diesel with kerosene
+
- price + diesel price -
Figure 2. WEF interlinkages of off-grid solar pumps: Drivers and impacts
Notes: Green text denotes key areas where policy interacts with the other variables. “R” denotes a reinforcing loop. “B” denotes a balancing loop.
In the agricultural subsection of the figure, the main reinforcing loop (R1) is the link between food demand
and food production: higher demand stimulates higher production and higher food availability enables ongoing
population growth, which in turn stimulates food demand. The main balancing loop (B1) in this cycle is the link
between food prices and food demand. Higher food demand will typically drive higher food prices, which will
in turn reduce demand. The key policy levers interacting with this system are within food markets, where the
PDS reduces the consumer price for critical products for consumers and the minimum support price scheme
guarantees farmers can sell strategically relevant crops at a minimum price.
IISD.org/gsi 12Mapping Policy for Solar Irrigation Across the Water–Energy–Food (WEF) Nexus in India
The main linkage with water systems is food production: everything else being equal, higher food production is
associated with higher water demand and relatively higher water stress for farmers. This forms a second main
balancing loop (B2), where water stress can have a negative impact on food production, as long as no new water
resources are exploited. This water stress is in turn alleviated through another balancing loop (B3), where farmers
increase their use of groundwater for irrigation purposes. Surface water and groundwater are finite resources,
so if water extraction for irrigation and non-agricultural uses increases beyond the recharge rate of rivers and
groundwater reservoirs, depletion takes place, and a final balancing loop is triggered (B4) when a groundwater
shortage takes place. This final balancing loop is a key part of the system dynamic: as groundwater stock depletes,
there is no immediate feedback mechanism encouraging users to reduce their withdrawals. It is only at the point
that a shortage occurs that a balancing factor kicks in, with knock-on effects across the rest of the system.
When off-grid solar pumps are introduced, this increases farmers’ access to water for irrigation, leading to
higher land productivity and food production, but also reducing groundwater stock and hence increasing the
risk of over-extraction. The increase in water availability is linked to possible behavioural changes that stimulate
food production such as: using more water to increase yields on existing crops and using more water to expand
the size of cultivated areas (R5); shifting to use new higher-value crops that have higher water demand (R2);
or growing crops in an additional season per year (R3). Finally, the positive impact that these changes have on
farmer incomes triggers beneficial reinforcing loops (R4, R6), where higher revenue from agricultural goods,
revenue from electricity and water sales, and improved health all contribute to improving farmer incomes
and well-being. This, in turn, makes off-grid solar pumps a more viable investment decision. This system is
influenced by numerous policy efforts that target improved farmer incomes in other areas.
As before, higher productivity from higher groundwater use is expected to increase crop water demand and
ultimately increase water stress for farmers, resulting in a balancing effect that reduces food production
(B2, B5) and that may be offset by a further balancing loop (B3) that increases access to and dependence
on groundwater until stocks are depleted to the point of a groundwater shortage (B4). The result is the
emergence of desirable social and economic outcomes in the short term, possibly followed by undesirable
ones in the medium and long terms. For this reason, policies that govern water usage by different users
intervene to influence water recharge rates and promote irrigation efficiency. These policies are key tools that
can determine outcomes.
The key factor affecting the uptake of off-grid solar pumps is their economic viability, which is in turn
influenced by a range of factors, including access to finance, up-front capital costs of the technology, the relative
cost of alternatives (on-grid or diesel pumps), and the relative reliability and convenience of alternatives. There
are many policies that can influence these variables, including soft loans or capital cost subsidies for off-grid
solar pumps; provisions to enable net metering (e.g., the sale of solar-generated electricity back to the grid); and
existing subsidies for electricity, diesel and kerosene. There is a reinforcing loop that connects lower reliance on
on-grid and diesel pumps with lower subsidies for electricity, diesel and kerosene (R7).
On the one hand, the introduction of solar water pumps can create opportunities for social empowerment and
economic development. On the other hand, it is crucial that investments are planned that take into account the
carrying capacity of surface water and groundwater resources, especially in light of climate change. While many
constraints to growth are removed with the use of solar water pumps, the balancing factor represented by water
availability can be weakened only by using water more efficiently and avoiding excessive water stress.
Aside from the way in which it helps highlight these interrelationships, the main purpose of this diagram is to
help identify the key policy levers that matter for off-grid solar pumps, given complex WEF interrelationships.
These variables, highlighted in green in the causal loop diagram, are subsequently used to help define a much
simpler framework for mapping key policies at the level of the Central Government and the governments of
Bihar and Rajasthan.
IISD.org/gsi 13Mapping Policy for Solar Irrigation Across the Water–Energy–Food (WEF) Nexus in India
4.0 Mapping Relevant Policies for Off-Grid Solar Pumps
Across the WEF Nexus
4.1 Structure of Mapping
At both the central and state levels, policies across water, energy and food themes are typically designed by
different ministries and departments that have a mandate to address one sector, rather than the nexus in its
entirety. The extent of interlinkage calls for a comprehensive review of these policies, such that activity in one
sector does not build problems in another. Mapping central- and state-level policies can help policy-makers
and researchers understand and engage with the network of policies that influence the drivers and impacts of
solar irrigation.
In order to structure this mapping, the visualization of key water–energy–food interrelationships was distilled
into a highly simplified framework drawing on the causal loop diagram (Figure 2) and focusing on a limited
number of clustered areas of policy-making:
• Solar support policies, both at a framework level and specifically for off-grid solar pumps
• Efficiency policies, both for energy and irrigation
• Water resource management policies, both at a framework level and specifically with respect to irrigation
• Production-based interventions to increase farmer incomes, such as cash transfers or subsidies to improve
affordability of farm inputs
• Policies that directly influence the price and demand for farmers’ crops.
The term “policy” was defined very broadly, including framework laws setting out principles and objectives for
governing sectors, sector-wide policies and plans, as well as issue-specific schemes, guidelines and campaigns.
Policies were only chosen if they were considered highly relevant to off-grid solar pumps, and subjective
judgement was used to determine when to include and exclude items on this basis. The review did not include
pilot projects or any scheme not operating at scale. The exercise searched for a range of information fields
per policy. This included each policy’s major WEF linkages and whether the linkages are recognized in formal
policy documentation; the budget or expenditure associated with the policy; and any major findings on the
policy’s performance. On budget or expenditure, it should be noted that this mapping was not a formal attempt
to quantify expenditure on different schemes. As such, the best available data was taken from the information
sources that were reviewed while attempting to ensure consistency between policies. Care should be taken in
comparing values that may not be in common terms (e.g., proposed, budgeted or allocated values) or may apply
to different years and time scales.
In addition to Central Government policies, two states were chosen for this mapping: Bihar and Rajasthan. As
explained in the scoping chapter of this paper, they were chosen based on an assessment of multiple criteria,
including the need to consider one water-abundant (Bihar) and one water-scarce state (Rajasthan), as well as
net sown area, net area under irrigation from tube wells, food and power subsidy expenditure, and the number
of diesel and electric pumps deployed.
IISD.org/gsi 14Mapping Policy for Solar Irrigation Across the Water–Energy–Food (WEF) Nexus in India
4.2 Results of Mapping
The results of the central-level policy mapping are summarized in Figures 3 and 4, followed by a summary table
and analysis of key central and state findings for each policy area. In the figures, policies are grouped by colour
according to their principal policy area. The summaries provide a high-level description of what was identified
and some narrative on the most important policies. In every case, more detailed information on each policy can
be found in an Excel data resource that accompanies this briefing, available online: https://www.iisd.org/sites/
default/files/uploads/india-wef-mapping-2019.xlsx
Y W
G
Efficiency policies: AT
R • National Energy Efficient
E
Solar support Pumps Program / AgDSM Water resource
ER
EN
policies: • Pradhan Mantri Krishi management:
• Kisan Urja Sinchayee Yojana (PMKSY) • Atal Bhujal Yojana
Suraksha evam • Per Drop More Crops (under • National Water Policy
Utthaan PMKSY)
• NAQUIM
Mahaabhiyan • Micro Irrigation Fund (MIF)
• Master Plan for
(KUSUM)
Artificial Recharge to
• National Solar Groundwater in India
Mission (NSM)
and Solar Production-based interventions
Pumping to increase farmer incomes:
Programme
• Doubling of Farmers’ Income
• Paramparagat Krishi Vikas Yojana (PKVY)
• Pradhan Mantri Kisan Summan Nidhi
(PM-KISAN)
• Rashtriya Krishi Vikas Yojana—
Remunerative Approaches for Agriculture
and Allied Sector Rejuvenation
• Direct Benefit Transfer Fertilizer Subsidy
• MGNREGA
Price interventions in food markets:
• Minimum Support Price (MSP)
• PM-AASHA’s Price Support Scheme (PSS) and Market
OD
Intervention Scheme (MIS)
• Food Subsidy to Food Corporation of India
O
• Sugarcane Pricing Policy, Control Order and Scheme
F
for Assistance to Sugar Mills
• National Agriculture Market (eNAM)
• Kisan Credit Card Scheme (KCC)
Figure 3. Central government WEF policies of key importance for solar irrigation pumps
IISD.org/gsi 15You can also read