Techno-economic Assessment of Hybrid Photovoltaic/Solar Thermal Power Plants: Modeling and Potential for Synergies
←
→
Page content transcription
If your browser does not render page correctly, please read the page content below
Aachen University of Applied Sciences
 Campus Jülich

 Faculty 10: Energy Technology
 M.Sc. in Energy Systems

 Techno-economic Assessment of Hybrid
Photovoltaic/Solar Thermal Power Plants:
 Modeling and Potential for Synergies

 Master Thesis by

 Ricardo Alexander Chico Caminos

 Cologne, Germany
 October 2017
This thesis is my own independent work and is the result of my sole efforts.
 Only the cited sources and references have been used.

 ___________________________
 Ricardo A. Chico Caminos, B.Eng.
 Cologne, October 20th 2017

This master thesis has been supervised by:

Prof. Dr.-Ing. Ulf Herrmann

Fachhochschule Aachen
University of Applied Sciences
Faculty 10 – Energy Technology

Dipl.-Ing. Dipl.-Wirt.Ing. Simon Dieckmann

Deutsches Zentrum für Luft- und Raumfahrt
(German Aerospace Center)
Institute of Solar Research
Acknowledgements
This master thesis was carried out at the Institute of Solar Research of the German Aerospace Center
(DLR) in Köln Porz, Germany. I would like to thank the DLR, for having allowed me to work at one
of the top German research institutions.

I would like to express my deepest gratitude to Simon Dieckmann and Dr. Jürgen Dersch for their
guidance and support during the course of this thesis, but especially for the trust they put in me to
complete this project. All our conversations during the course of this project have helped me widen
my knowledge on this subject. I would also like to thank Prof. Dr.-Ing. Ulf Herrmann for the interest
shown in this work and for all his guidance during the course of my studies.

My most sincere gratitude goes to all my colleagues at the Institute of Solar Research, for the
awesome working environment, especially to my working group and friends that I made over the past
six months. Last but not least, my most sincere thanks to my family and friends in Jülich and El
Salvador, because this thesis is a product of their constant support and motivation.
Abstract
In this master thesis a hybrid photovoltaic / solar thermal power plant was modeled for a high
irradiance location. The selected location was Chile’s northern region. For the evaluation the software
greenius was used, a program being continuously developed at DLR since 1999. This program did not
possess a storage function for PV simulations. Therefore one of the aims of this thesis was firstly to
analyze the accuracy of the PV model and subsequently develop and implement a battery model to
evaluate the financial viability of standalone PV systems. For this reason the greenius model was
compared with PVWatts and PVSyst photovoltaic models. Additionally, an electric storage element
based on a charge balance model was implemented in the system. This model proved to accurately
depict the performance of batteries without the need for many parameters. The second aim of this
thesis was to optimize and evaluate the financial feasibility of hybrid power plants with a high
capacity factor (> 90%). The designed plants were based on the published specifications of Cerro
Dominador, Chile for two main reasons. On one hand, this is going to be the first hybrid PV/CSP plant
to be commissioned in South America (2019). Therefore it is going to be the benchmark for hybrid
solar power plants in the future. On the other hand, Chile’s climate is perfect for solar projects. Thus it
was important to assess the profitability of a sample plant in this region for future projects to be
developed. The calculations were performed with the latest PV benchmark costs of 2017, which have
decreased by 21% compared to 2016. The results showed that hybrid solar plants are more cost-
efficient for base-load electricity supply than standalone CSP plants in high-irradiance regions. The
hybrid CSP+PV plant has 1.7% lower LCOE than the standalone CSP plant (86 vs. 84 €/MWh).
However, the main advantage of CSP+PV plants is that they can achieve 3.5% higher capacity factors
than CSP at the same LCOE. While the highest annual capacity factor achieved by the hybrid power
plant for this location is 98%, the pure CSP plant cannot achieve capacity factors larger than 95%.
Photovoltaic power plants with battery storage can be competitive starting 2032, since the results show
an LCOE reduction from 158 to 69 €/MWh between 2017 and 2032.

Keywords: Hybrid solar, CSP, PV, Battery model, PV model, Greenius
Table of Contents
ABSTRACT ......................................................................................................................................................... IV

TABLE OF CONTENTS ......................................................................................................................................V

NOMENCLATURE .......................................................................................................................................... VII

LIST OF FIGURES ............................................................................................................................................ IX

LIST OF TABLES ............................................................................................................................................ XII

1 INTRODUCTION ........................................................................................................................................ 1

2 STATE OF THE ART ................................................................................................................................. 1

 2.1 GLOBAL ENERGY MARKET...................................................................................................................... 1
 2.2 CONCENTRATED SOLAR POWER .............................................................................................................. 2
 2.2.1 Types of CSP plants .......................................................................................................................... 2
 2.2.2 Economic framework ........................................................................................................................ 4
 2.3 PHOTOVOLTAIC ENERGY ........................................................................................................................ 5
 2.3.1 Basics of photovoltaics...................................................................................................................... 5
 2.3.2 Photovoltaic plants ............................................................................................................................ 6
 2.3.3 Economic framework ........................................................................................................................ 9
 2.4 ENERGY STORAGE .................................................................................................................................. 9
 2.4.1 Types of energy storage .................................................................................................................... 9
 2.4.2 Economic framework ...................................................................................................................... 11
 2.5 HYBRID PV/CSP .................................................................................................................................. 12
 2.5.1 Projects worldwide .......................................................................................................................... 14
 2.5.2 Studies on hybrid solar systems and economic perspectives ........................................................... 18

3 PHOTOVOLTAIC MODEL EVALUATION ......................................................................................... 21

 3.1 PV MODEL DESCRIPTION ...................................................................................................................... 21
 3.1.1 3- coefficient Model in greenius ..................................................................................................... 21
 3.1.2 5 Parameter Model .......................................................................................................................... 21
 3.1.3 PVWatts .......................................................................................................................................... 24
 3.1.4 SANDIA Model .............................................................................................................................. 25
 3.1.5 Model comparison ........................................................................................................................... 25
 3.1.6 Results ............................................................................................................................................. 26
 3.2 PV MODEL CONCLUSIONS .................................................................................................................... 28

4 BATTERY MODEL DEVELOPMENT .................................................................................................. 29

 4.1 ELECTROCHEMICAL STORAGE MODELING ............................................................................................ 29
 4.2 BATTERY LAYOUT AND FUNCTION ....................................................................................................... 30
 4.3 CHARACTERIZATION OF THE BATTERY MODELS ................................................................................... 31
4.3.1 Electrochemical and equivalent-circuit models ............................................................................... 31
 4.3.2 CIEMAT model: ............................................................................................................................. 32
 4.3.3 PVSyst ............................................................................................................................................. 33
 4.3.4 System Advisor Model (SAM)........................................................................................................ 33
 4.3.5 Charge balance model ..................................................................................................................... 33
 4.4 MODEL SELECTION AND PRELIMINARY EVALUATION ........................................................................... 34
 4.4.1 Battery dimensions .......................................................................................................................... 34
 4.4.2 Charge balance model results .......................................................................................................... 35
 4.4.3 CIEMAT model .............................................................................................................................. 36
 4.4.4 Model selection conclusions ........................................................................................................... 37
 4.5 MODEL COMPARISON WITH OTHER TOOLS ............................................................................................ 37
 4.5.1 Validation results............................................................................................................................. 38
 4.5.2 Differences between SAM and greenius Model.............................................................................. 39
 4.5.3 Model evaluation conclusions ......................................................................................................... 41
 4.6 MODEL IMPLEMENTATION.................................................................................................................... 42
 4.6.1 Software preparation ....................................................................................................................... 42
 4.6.2 Final implementation....................................................................................................................... 43

5 TECHNO-ECONOMIC EVALUATION OF A HYBRID PV/CSP PLANT ........................................ 46

 5.1 COST ASSUMPTIONS ............................................................................................................................. 46
 5.2 REFERENCE PLANT CERRO DOMINADOR .............................................................................................. 50
 5.2.1 Plant specifications .......................................................................................................................... 50
 5.2.2 Results ............................................................................................................................................. 50
 5.3 PLANT OPTIMIZATION ........................................................................................................................... 51
 5.3.1 CSP Plant ........................................................................................................................................ 51
 5.3.2 PV Plant .......................................................................................................................................... 53
 5.3.2.1 Plant without electrical storage............................................................................................... 53
 5.3.2.2 Plant with electrical storage .................................................................................................... 54
 5.4 HYBRIDIZATION ................................................................................................................................... 55
 5.4.1 PV Dimensioning ............................................................................................................................ 55
 5.4.2 Hybrid PV/CSP Optimization ......................................................................................................... 56
 5.5 RESULTS DISCUSSION ........................................................................................................................... 59

6 CONCLUSIONS AND FUTURE WORK ................................................................................................ 63

BIBLIOGRAPHY ............................................................................................................................................... 65

ANNEX ................................................................................................................................................................ 72

 A1 GENERAL INFORMATION AND COST OVERVIEW .................................................................................... 73
 A2 TECHNICAL DETAILS OVERVIEW OF SINGLE OPERATION POWER PLANTS .............................................. 74
 A3 TECHNICAL DETAILS OVERVIEW OF HYBRID OPERATION POWER PLANT ............................................... 75
 A4 BATTERY TECHNICAL AND FINANCIAL PARAMETER DETAILS (FROM CHAPTER 5.1) ............................. 75
Nomenclature
 List of symbols

Symbol Description Unit
DOD Depth of Discharge %
E Irradiance W/m2
I Current A
Impp Current at maximum power point A
Isc Short-circuit current A
Q Charge C
R Resistance Ω
SOC State of charge %
T Temperature K
V Voltage V
Vmpp Voltage at maximum power point V
Voc Open-circuit voltage V
γ Diode quality factor -
η Efficiency %

 List of abbreviations and acronyms

Abbreviation Description
a year
AC Alternating current power
a-Si Amorphous Silicon cells
CAPEX Capital expenditure
CCS Carbon Capture and Storage
CdTe Cadmium-Telluride PV cells
CIEMAT Centro de Investigaciones Energéticas, Medioambientales y Tecnológicas
 (Research Centre for Energy, Environment and Technology)
CIS Copper- Indium-Gallium-Selenide solar cell
CNE Comisión Nacional de Energía (Chilean national energy commission)
CO2 Carbon Dioxide
CSP Concentrated Solar Power
DC Direct current power
DHI Direct horizontal irradiance
DLR Deutsches Zentrum für Luft- und Raumfahrt (German Aerospace Center)
DNI Direct normal irradiance
GHI Global horizontal irradiance
GT Gas turbine
HTF Heat transfer fluid
IEA International Energy Agency
IRENA International Renewable Energy Agency
IRR Internal rate of return
LCOE Levelized cost of electricity
Li-ion Lithium-ion batteries
MENA Middle East and North Africa region

 VII
Mono-Si Monocrystalline Silicon cells
NOCT Normal operating cell temperature
OECD Organization for Economic Cooperation and Development
Poly-Si Polycrystalline Silicon cells
PPA Power purchase agreement
PTC Parabolic trough collector
PV Photovoltaic
Si Silicon
SING Sistema interconectado del norte grande (Chilean northern interconnected
 grid)
SM Solar Multiple
STC Standard test conditions
STE Solar Thermal Energy
SWEC Spanish Weather for Energy Calculations
TES Thermal energy storage
We Watt-electric
Wp Watt-peak
Wth Watt-thermal

 VIII
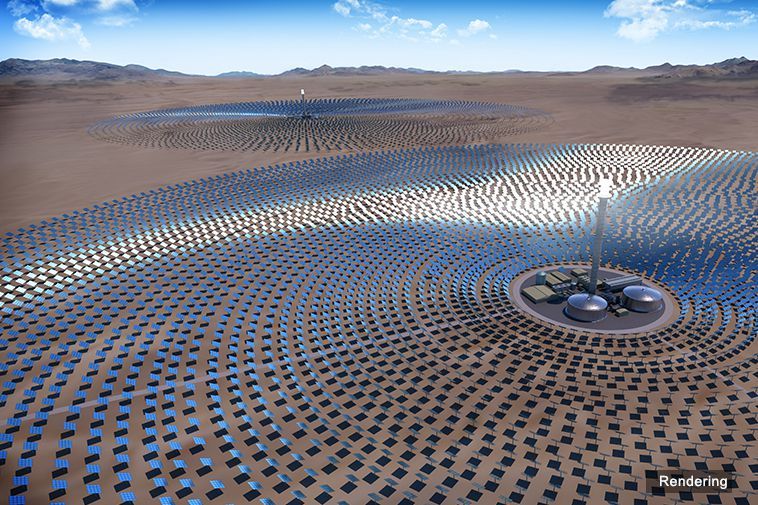
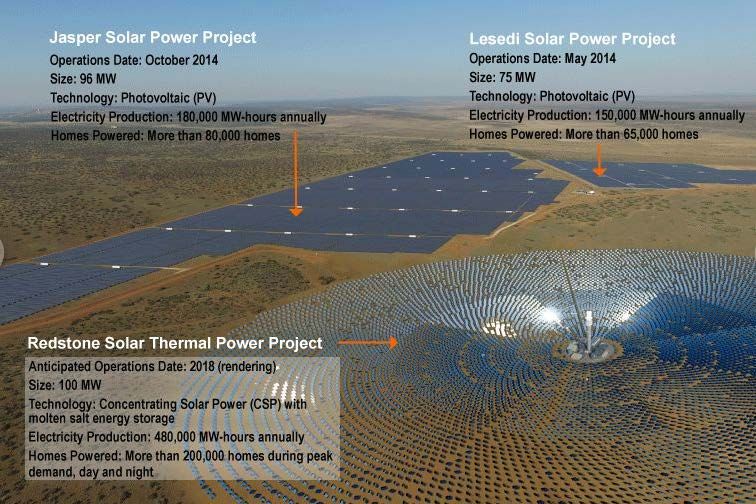
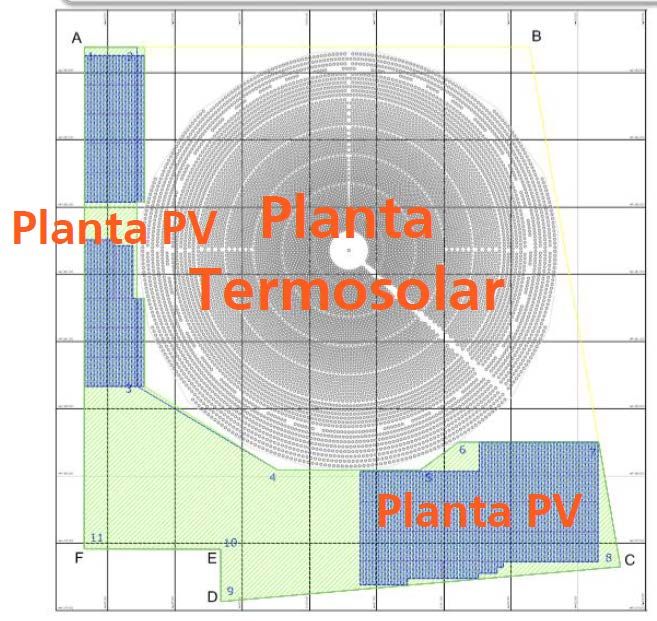
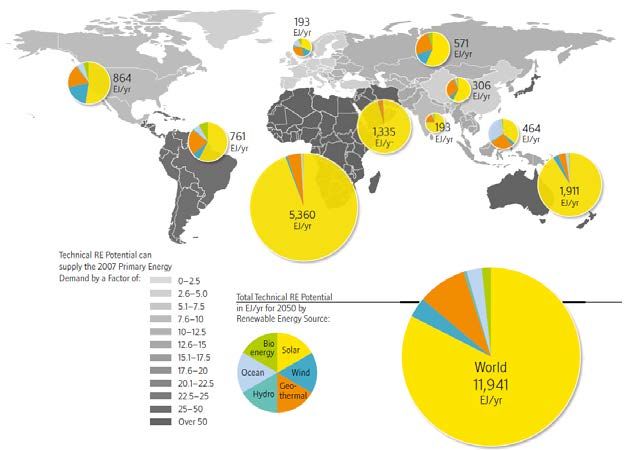
List of figures
FIGURE 1: SOLAR ENERGY POTENTIAL IN 2050 [2] ................................................................................................... 1
FIGURE 2: LINE AND POINT FOCUS CSP TECHNOLOGY TYPES. MODIFIED FROM [6] ................................................. 2
FIGURE 3: EXAMPLE OF PARABOLIC TROUGH PLANT WITH TWO-TANK MOLTEN SALT STORAGE .............................. 3
FIGURE 4: EXAMPLE OF A CENTRAL RECEIVER POWER PLANT WITH DIRECT TWO-TANK STORAGE ........................... 4
FIGURE 5: 2050 IEA CSP SCENARIO. ARROWS INDICATE CSP ELECTRICITY TRANSPORT. CONSUMPTION AND
 PRODUCTION IN TWH [12] .............................................................................................................................. 5
FIGURE 6: TYPES OF SOLAR CELLS: FROM LEFT TO RIGHT: MONO-SI, POLY-SI, THIN FILM CELL (AMORPHOUS
 SILICON). MODIFIED FROM [5] ........................................................................................................................ 6
FIGURE 7: GRID-CONNECTED BATTERY SYSTEM WITHOUT STORAGE [16] ................................................................ 6
FIGURE 8: VOLTAGE LEVEL OF A TYPICAL PV GRID-CONNECTED PLANT [16] .......................................................... 7
FIGURE 9: GRID-CONNECTED RESIDENTIAL PV SYSTEM WITH BATTERY. [18] ......................................................... 8
FIGURE 10: DC- COUPLED PV-BATTERY SYSTEM WITH MPP TRACKER [22]............................................................ 8
FIGURE 11: AC-COUPLED PV-BATTERY SYSTEM [23] .............................................................................................. 9
FIGURE 12: TYPES OF ENERGY STORAGE ACCORDING TO ENERGY FORM [27] ........................................................ 10
FIGURE 13: ENERGY STORAGE SYSTEMS ACCORDING TO THEIR DURATION AND AMOUNT OF ENERGY POSSIBLE TO
 STORE. FLYWHEELS, CAES AND PHS: MECHANICAL ENERGY CAPACITY; BATTERIES: ELECTRICAL ENERGY

 CAPACITY; SNG AND H2: CHEMICAL ENERGY CAPACITY. [2] ........................................................................ 10
FIGURE 14: HYBRID SOLUTIONS FROM THE COMPANY SOLARRESERVE [42].......................................................... 13
FIGURE 15: SOLUTION SET OF SOLAR TECHNOLOGIES FROM THE COMPANY SOLARRESERVE [42] ......................... 13
FIGURE 16: COPIAPÓ MOST RECENT CONFIGURATION WITH TWO SOLAR TOWERS (RENDERING) [48] .................... 14
FIGURE 17: CERRO DOMINADOR SITE LAYOUT WITH CSP TOWER PLANT AND TWO PV PARKS [50] ...................... 15
FIGURE 18: REDSTONE CSP AND LESEDI AND JASPER PV PLANTS (RENDERING) [48] ........................................... 15
FIGURE 19: LCOE VARIATION FOR DIFFERENT STORAGE HOUR CAPACITIES AND SOLAR MULTIPLES, FROM [55] .. 18
FIGURE 20: CAPACITY FACTOR VARIATION FOR DIFFERENT STORAGE HOUR CAPACITIES AND SOLAR MULTIPLES,
 FROM [55] ..................................................................................................................................................... 19
FIGURE 21: GLOBAL PV AND CSP INSTALLED CAPACITY PROJECTION UNTIL 2050 [82] ........................................ 19
FIGURE 22: LCOE PROJECTION OF PV, CSP AND HYBRID SOLAR UNTIL 2050 UNDER THE BLUE MAP SCENARIO IN
 CHILE [82] .................................................................................................................................................... 20
FIGURE 23: LCOE PROJECTION OF PV, CSP AND HYBRID SOLAR UNTIL 2050 UNDER THE ROADMAP SCENARIO IN
 CHILE [82] .................................................................................................................................................... 20
FIGURE 24: STANDARD SINGLE DIODE EQUIVALENT CIRCUIT FOR A PV CELL. IPH IS THE PHOTOCURRENT (IΦ IN THE
 EQUATIONS FROM PVSYST) [93] ................................................................................................................... 22
FIGURE 25: I-V CURVE OF A PV CELL IN BLUE. P-V CURVE IN RED [94]................................................................. 23
FIGURE 26: MODULE POWER IN WINTER ................................................................................................................ 27
FIGURE 27: MODULE POWER IN WINTER ................................................................................................................ 27
FIGURE 28: TEMPERATURE COEFFICIENTS AT STC CONDITIONS FOR DIFFERENT MODULES [100] .......................... 28
FIGURE 29: TYPICAL VOLTAGE VS. SOC CURVE [108] ........................................................................................... 30

 IX
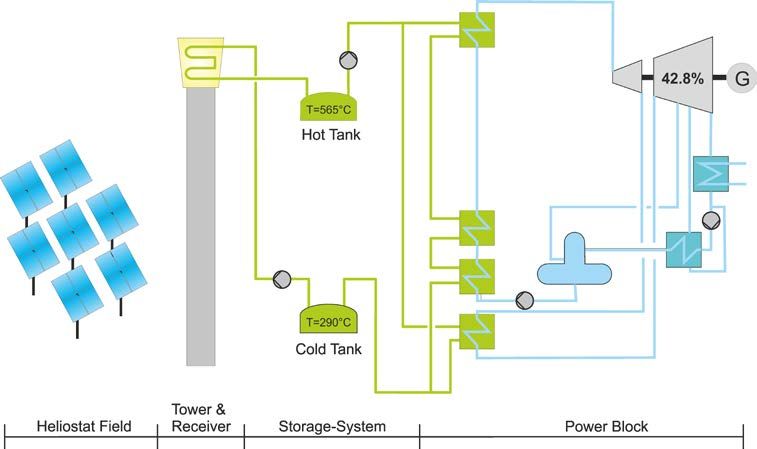
FIGURE 30: A) RINT MODEL; B) THEVENIN MODEL; C) DP MODEL. MODIFIED FROM [110] .................................... 31
FIGURE 31: CHARGE BALANCE MODEL ALGORITHM. BASED ON [7] ....................................................................... 34
FIGURE 32: DISCHARGE CURRENT AS FUNCTION OF DISCHARGE TIME FOR A FULMEN EF2050 BATTERY. ............. 35
FIGURE 33: OVERSIZED BATTERY PV SYSTEM WITH 6H STORAGE ON A TYPICAL SUMMER DAY............................. 35
FIGURE 34: DISPATCH CONTROL IN SAM .............................................................................................................. 37
FIGURE 35: ELECTRICITY GENERATION WITH DIFFERENT STORAGE CONFIGURATIONS ........................................... 39
FIGURE 36: VOLTAGE, CHARGE AND ELECTRICITY INPUT/OUTPUT OF LI-ION AND LEAD BATTERY IN SAM FOR A
 TYPICAL SUMMER DAY. NEGATIVE ELECTRICITY VALUES REPRESENT CHARGING POWER AND POSITIVE

 ELECTRICITY VALUES REPRESENT DISCHARGING. .......................................................................................... 40
FIGURE 37: VOLTAGE AND CHARGE OF LI-ION AND LEAD BATTERY IN SAM FOR A TYPICAL SUMMER DAY. ......... 41
FIGURE 38: GREENIUS MODEL ASSUMPTIONS .......................................................................................................... 42
FIGURE 39: PV-BATTERY TOPOLOGY .................................................................................................................... 42
FIGURE 40: CENTRAL CONTROL ELEMENT FOR ELECTRICAL ENERGY TRANSFER ................................................... 43
FIGURE 41: PV TECHNOLOGY GUI ........................................................................................................................ 44
FIGURE 42: COMPARISON BETWEEN THERMAL ENERGY STORAGE AND ELECTRIC STORAGE IN GREENIUS. ............. 44
FIGURE 43: AVERAGE PV SPECIFIC COSTS BETWEEN 2010 AND 2017 FROM [116]. PROJECTION FOR 2025 FROM [11]
 ...................................................................................................................................................................... 47
FIGURE 44: LITHIUM-ION BATTERY COST EVOLUTION (SPECIFIC ENERGY CAPACITY COSTS). ................................ 48
FIGURE 45: HELIOSTAT COST REDUCTION BETWEEN 2015 AND 2025 FROM [118] AND POSSIBLE SCENARIOS UNTIL
 2035 (RED LINE: CONSTANT COSTS; BLACK LINE: LINEAR COST REDUCTION; RED CIRCLE: CHOSEN VALUE). 49
FIGURE 46: CSP INVESTMENT COST REDUCTION BETWEEN 2005 AND 2050, MODIFIED FROM [121]. ..................... 49
FIGURE 47: CERRO DOMINADOR SOLAR TOWER BEING UNDER CONSTRUCTION [51] ............................................. 50
FIGURE 48: LCOE FOR VARYING HELIOSTAT FIELD SIZE AND TES CAPACITY ....................................................... 52
FIGURE 49: CAPACITY FACTOR FOR VARYING HELIOSTAT FIELD SIZE AND TES CAPACITY .................................... 52
FIGURE 50: LCOE IN RELATION TO CAPACITY FACTOR WITH VARYING HELIOSTAT FIELD SIZE AND TES CAPACITY
 ...................................................................................................................................................................... 52
FIGURE 51: LCOE IN RELATION TO TOTAL INSTALLED POWER FOR A PV PLANT WITHOUT ELECTRICAL STORAGE 53
FIGURE 52: LCOE IN RELATION TO CAPACITY FACTOR FOR A PV PLANT WITHOUT ELECTRICAL STORAGE............ 53
FIGURE 53: LCOE FOR VARYING PEAK POWER AND ELECTRIC STORAGE CAPACITY .............................................. 54
FIGURE 54: CAPACITY FACTOR FOR VARYING INSTALLED PEAK POWER AND ELECTRIC STORAGE CAPACITY ......... 54
FIGURE 55: LCOE IN RELATION TO CAPACITY FACTOR FOR VARYING PEAK POWER AND BATTERY SIZE ................ 55
FIGURE 56: IDEAL LOAD CURVE DURING HYBRID DISPATCH FOR A TYPICAL SUNNY DAY ....................................... 55
FIGURE 57: 140 MW PV PLANT DAILY ELECTRICITY GENERATION. RED LINE: NET PV SYSTEM OUTPUT; GREEN
 LINE: PV FOLLOWING THE LOAD. .................................................................................................................. 56
FIGURE 58: LCOE FOR VARYING HELIOSTAT FIELD SIZE AND TES CAPACITY ....................................................... 57
FIGURE 59: CAPACITY FACTOR FOR VARYING HELIOSTAT FIELD SIZE AND TES CAPACITY .................................... 57
FIGURE 60: LCOE IN RELATION TO CAPACITY FACTOR WITH VARYING HELIOSTAT FIELD SIZE AND TES CAPACITY
 ...................................................................................................................................................................... 57
FIGURE 61: LCOE IN RELATION TO CAPACITY FACTOR FOR A CSP PLANT AND A CSP+PV PLANT ........................ 58
FIGURE 62: LCOE IN RELATION TO CSP FIELD APERTURE FOR A CSP PLANT AND A CSP+PV PLANT ................... 59

 X
FIGURE 63: LCOE AND CAPACITY FACTORS FOR OPTIMIZED CSP AND CSP+PV (CSP+PV CONFIGURATIONS WITH
 DIFFERENT CAPACITY FACTORS).................................................................................................................... 59
FIGURE 64: LCOE VS CAPACITY FACTOR FOR CSP ONLY, CSP+PV, PV WITH BATTERY AND PV ONLY. .............. 60
FIGURE 65: LCOE EVOLUTION FOR CSP, PV AND CSP+PV WITH 90% CAPACITY FACTOR ................................... 61

 XI
List of tables
TABLE 1: COMPARISON OF COMMERCIAL BATTERIES FOR UTILITIES, DATA FROM [37] [38]................................... 12
TABLE 2: OVERVIEW OF THE MAIN HYBRID PHOTOVOLTAIC/SOLAR THERMAL POWER PLANTS .............................. 17
TABLE 3: PARAMETERS FOR PV MODELING IN PVSYST ......................................................................................... 22
TABLE 4: SET OF KNOWN DATA POINTS TO DETERMINE THE REST OF PARAMETERS WITH EQ. 3.3 .......................... 24
TABLE 5: PARAMETER RESULTS FROM DIFFERENT MODELS [90] ............................................................................ 25
TABLE 6: ANNUAL ELECTRICITY YIELD ................................................................................................................ 26
TABLE 7: DAILY RESULTS FOR A TYPICAL WINTER DAY ......................................................................................... 27
TABLE 8: DAILY RESULTS FOR A TYPICAL SUMMER DAY........................................................................................ 28
TABLE 9: CIEMAT MODEL RESULTS FOR TWO DIFFERENT TIME STEPS (JUNE 19TH) ............................................... 36
TABLE 10: SAM BATTERY PARAMETER VARIATION .............................................................................................. 38
TABLE 11: SAM AND GREENIUS MODEL ANNUAL RESULTS AND SAM DEVIATION COMPARED TO GREENIUS. ........ 38
TABLE 12: COMPARISON BETWEEN MODELS FOR ONE TYPICAL SUMMER DAY AND SAM DEVIATION COMPARED TO
 GREENIUS....................................................................................................................................................... 38
TABLE 13: COST ASSUMPTIONS FOR THE PV PLANT ............................................................................................... 46
TABLE 14: BATTERY PARAMETERS SUMMARY ....................................................................................................... 47
TABLE 15: COST ASSUMPTIONS FOR THE CSP PLANT ............................................................................................. 48
TABLE 16: CERRO DOMINADOR PLANT SINGLE SIMULATION RESULTS .................................................................. 50
TABLE 17: LCOE EVOLUTION FOR ALL THREE PLANTS WITH 90% CAPACITY FACTOR .......................................... 61

 XII
Introduction

1 Introduction
Climate change, energy efficiency, global warming, radioactive waste are all terms that have resonated
globally over the past few decades. There is a trend towards cleaner energy systems. The technologies
to achieve a meaningful transition have surpassed the developing phase and many are already
commercially available. Therefore, one of our society´s primary challenges of this century is the
implementation of those clean energy systems at large scale in order to make this transition happen.
Although there are new technologies, such as carbon capture and storage (CCS) currently being
developed, which can certainly counter the adverse effects of fossil fuels, there is a need for new
renewable energy technologies. It is fundamental to identify which resources can be exploited in a
sustainable manner in order to ensure a secure energy generation to cover the different sector
demands. The technology must also be cost-competitive with other conventional energy generation
systems. For this reason there are many tools that provide guidance on which technology is most
suitable for a specified application and location.

The software greenius was used and expanded during the course of this thesis. The Institute of Solar
Research of the German Aerospace Center (DLR) developed this tool in 1999 and has been upgrading
it ever since. With the help of this tool annual yield calculations of renewable energy technologies can
be performed, which are of significant importance for project planners, investors, and researchers.

The main focus on this thesis is PV and CSP. Both technologies use the solar radiation to its advantage
in a unique way. CSP plants transform the solar energy into thermal energy and therefore one of the
main advantages is its cheap thermal energy storage. This makes CSP plants able to generate
dispatchable power at times when there is a higher demand. On the other hand, PV transforms solar
radiation directly into electrical energy thus avoiding the use of large mechanical equipment. However
storing electrical energy is more expensive than thermal energy. Therefore a hybrid PV/solar thermal
power plant could represent a cost-efficient option to replace conventional fossil fuel plants to ensure a
base-load power generation. By integrating PV modules in a hybrid system, the CSP heliostat field is
designed smaller. Since the costs for PV have declined significantly in the last decade, the cost savings
in the heliostat field are potentially larger than the costs of the installed PV system.

Moreover, energy storage is a critical issue that must be addressed. Since the solar resource is limited
by daytime and clear sky conditions, the generated power must be stored in an efficient way. Batteries
have not been exploited in utilities-scale due to their elevated costs. A decrease in costs is making now
companies and utilities start using batteries as energy storage for peak and hourly demand respond, as
well as voltage and frequency control. Therefore the challenge is combining the synergies between
these different types of technologies to ensure a reliable energy transition.

A description of how solar technologies work is presented in chapter 2. The main components and
configurations are shown for standalone and hybrid systems, as well as the economic boundaries and
current studies on their performance. In chapter 3 different photovoltaic models are discussed and
compared. In chapter 4, a battery model is developed to be integrated in greenius. Since the program
only had the option to feed in the solar energy produced by the PV panel in the grid, it was needed to
include a battery model to correctly analyze the benefits and drawbacks of storing energy in either
thermal or electrical form. Finally, in chapter 5 the parametrization of an optimized hybrid power plant

Ricardo Alexander Chico Caminos 1
Introduction

is made based on a reference plant in Chile: Cerro Dominador, a 110 MWe CSP and 100 MWp PV
plant. The financial feasibility of the hybrid power plant is compared to the standalone CSP and PV
configurations. Special attention was also paid to the battery cost evolution for the following years and
the economic viability of PV plants with electrical storage compared to CSP.

Ricardo Alexander Chico Caminos 2
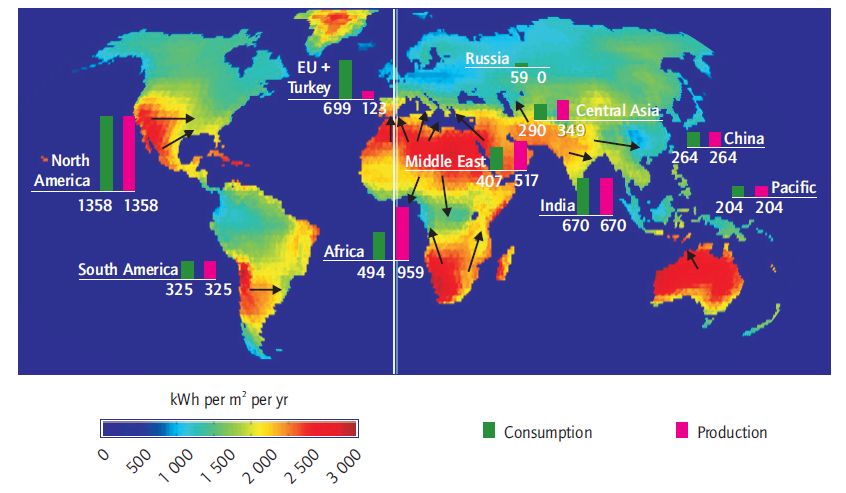
State of the Art

2 State of the Art
Solar energy is commonly associated with photovoltaic power generation; however, the sun irradiance
also delivers its energy in the form of heat. Researchers have been able to observe this effect and use
the solar heat since decades warming up either water or different passive environments, such as
greenhouses. Concentrated solar power plants use the heat to produce power. The power sector is thus
a market for both PV and CSP technologies.

2.1 Global energy market
In the past 10 years there has been an expeditious increase in CO2 levels. Coal combustion was
responsible for 46% of the global CO2 emissions and 31% alone was from coal-fired power plants,
according to data of 2013 [1]. The concentration of carbon dioxide in our atmosphere has surpassed
400 ppm [2]. The effects of increasing CO2 levels have a global reach and many countries are already
taking actions on this matter. In Europe efforts have been made towards a cleaner environment. These
are listed under the European Union’s (EU) “20-20-20” targets [3], which are namely:

 • Reducing the greenhouse gas emissions by at least 20% by 2020 compared to 1990 levels.
 • Increasing the renewable energy share in the total energy consumption to 20% by 2020.
 • Improving the energy efficiency by 20% by 2020.

However, Europe alone cannot solve a global issue; especially when OECD countries do not have as
big of an impact as non-OECD nations. According to the U.S. EIA’s International Energy Outlook
2016 [4] it was projected that the energy demand in developing countries would strongly increase by
71% between 2012 and 2040. Therefore it is really important to ensure a low-emission energy supply
for these countries. Interestingly, a majority of developing countries have an abundant potential for
renewable energies. It can be observed in Fig. 1 that especially the Middle East and North Africa
(MENA) region, Central and South Africa, as well as Central and South America have the biggest
share of all renewable energy sources [2].

 Figure 1: Solar energy potential in 2050 [2]

Ricardo Alexander Chico Caminos 1
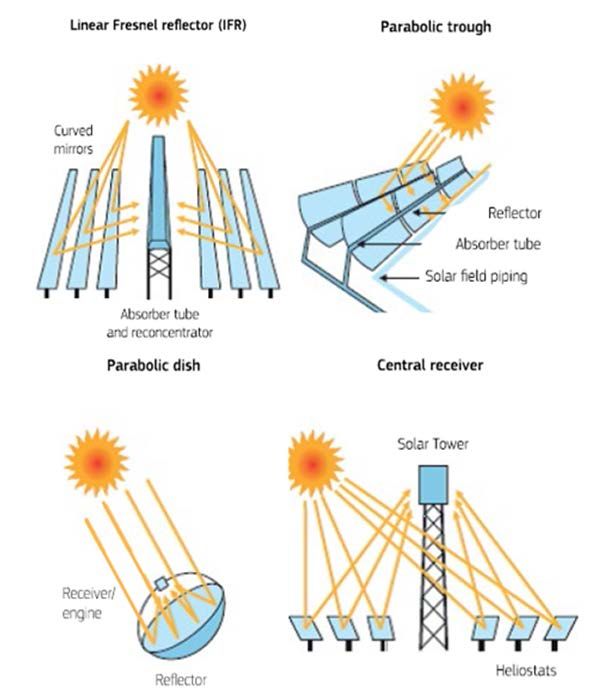
State of the Art

Renewable energy generation is increasing globally at a rate of 2.9%/a and is the fastest growing
source of electric power generation. India and China have adopted also several targets regarding solar
energy generation that support this growth [4]. The installed solar PV global capacity by the end of
2015 reached 227 GWe and is increasing exponentially [5]. Costs are no longer an issue, since many
countries around the world have already reached grid parity [5]. Meanwhile, CSP is also a growing
market, especially in countries like Morocco, Chile and South Africa. Remarkably, CSP is reaching
also other industries, such as the oil and gas sector, with a 1 GWth solar plant being constructed in
Oman [5].

2.2 Concentrated solar power
Solar thermal energy is not only used in small collectors for heating water or solar stoves. It can be
used also to supply electricity and heat demand at high temperatures. Concentrated solar power plants
are high temperature systems.

2.2.1 Types of CSP plants

CSP technology for commercial applications can be present in four different configurations:
 • Parabolic trough plants
 • Linear Fresnel plants
 • Central Receiver or solar tower
 • Parabolic dish

 Figure 2: Line and point focus CSP technology types. Modified from [6]

Ricardo Alexander Chico Caminos 2
State of the Art

Parabolic trough collectors and linear Fresnel plants can be classified in a single group: Line focus
systems. The reason for this is that the concentration occurs in one axis only. The incoming irradiance
is focused onto a tubular absorber where the heat transfer fluid (HTF) flows. The HTF is continuously
pumped through a set of heat exchangers, where the evaporator and superheater are located. Steam is
produced this way and transported to a steam turbine, where electricity can be generated [7]. This
whole process resembles a traditional coal-fired plant process. It is indeed, an application of the
Rankine cycle; however the supplied energy is the sun irradiation and not a fossil fuel.
Parabolic trough plants consist of several arrays of parabolic-shaped curved mirrors that serve this
focusing purpose. Fresnel plants operate in a similar way, but the mirrors are flat and aligned in such a
way that they reflect the incoming radiation on a single receiver tube above the reflectors. Central
receiver plants and parabolic dishes are also grouped in so-called point focus systems. A central
receiver plant, also called solar tower plant, has a large field of mirrors, which are called heliostats.
The heliostats are controlled in two-axis so that they reflect the sunlight into a single point, hence the
name central receiver. The receiver sits on top of a high-standing structure [7] [5]. Parabolic dishes, on
the other hand, concentrate the irradiation via a single parabolic dish to a focal point. Commonly, each
of the dishes has a Stirling engine at this point, so that power can be generated at each individual dish
[5]. This technology however, is not yet commercially viable.

Parabolic trough plants

This type of plant is considered a medium temperature technology, with working fluid temperatures of
up to 400°C. The parabolic-shaped collector arrays are ordered in a north-south configuration and
possess a 1-axis tracking unit [8]. The HTF is predominantly a eutectic mixture of 73.5% diphenyl
oxide and 26.5% biphenyl, with operating temperatures between 290 °C and 390 °C [9]. The typical
storage is based on a 2-tank system with the storage medium being a eutectic mixture of KNO3 and
NaNO3. This storage medium has proven to be a more cost-effective solution than thermal oil and its
operation temperature can reach up to 550 °C in contrast to the 400 °C thermal oil limit [9]. For this
reason salt is competing with thermal oil in order to be used as the HTF; however the obstacle is that
this mixture freezes at 238 °C [9]. Therefore it must be ensured that the temperatures do not fall below
this limit as severe damages in the tanks and pipelines might occur. There are other types of systems,
for example direct-steam generation plants, where water/-steam is used as HTF. Fig.3 shows a
parabolic trough plant with thermal oil as HTF and two-tank storage with molten salt.

 Figure 3: Example of parabolic trough plant with two-tank molten salt storage

Ricardo Alexander Chico Caminos 3
State of the Art

Central receiver plants

Central receiver plants are a high temperature technology with temperatures that can reach up to
1000 °C on the receiver side. As explained before the radiation is focused into the receiver by means
of heliostats. The concentration factor achievable by this technology is around 1000, meaning a 10x
higher concentration factor than in line focus systems [9]. There is a wide range of technologies
available or being researched. There are some plants around the world with a molten-salt receiver type,
like Gemasolar in Spain or Crescent Dunes in Nevada, US. The advantage hereof is the direct storage
possibility [10]. Particle receivers represent a technology which might be implemented in the future
due to their ability to handle temperatures higher than 1000 °C, which is a great advantage over molten
salts, as well as absence of any freezing issues [10]. Another technology is the high-temperature gas-
based receivers. These include the volumetric air receivers, where the concentrating beams are focused
onto a porous structure, where air is sucked in and transferred to a heat exchanger where it can heat up
a water-steam fluid in a Rankine cycle or be used directly in a gas turbine [10]. When the air is used in
an open-loop it is called an open volumetric receiver. On the other hand, when gas turbine cycles are
preferred, pressurized closed-loop receivers are used [10]. Passive solid material storage is a possible
way to store thermal energy from the hot air flowing from the receiver. Fig. 4 shows an example of a
solar tower plant with molten-salt receiver and direct two-tank storage.

 Figure 4: Example of a central receiver power plant with direct two-tank storage

2.2.2 Economic framework

Spain and the United States are both the countries that have the highest number of CSP installed
capacity in the world, with the US being pioneers in erecting the Solar Energy Generating Systems
(SEGS) between 1985 and 1990 [5]. Starting in 2007 there has been a rapid growth in this market,
especially for parabolic trough plants. They account for the 85% of the total capacity worldwide,
however a high amount of central receiver plants are being planned or constructed at the moment. CSP
plants with integrated thermal storage offer lower levelized costs of electricity (LCOE) than without it.
Between 2012 and 2014 the LCOE sank from >300 $/MWh into the 200 $/MWh region [5], with
projects in 2017 acquiring PPA of less than 100 $/MWh, such as in Dubai or Chile. According to a

Ricardo Alexander Chico Caminos 4
State of the Art

study from the international renewable energy agency (IRENA) the weighted average costs for CSP in
2015 was between 150 and 190 $/MWh. The LCOE could be between 80 and 120 $/MWh in 2025
[11].

 Figure 5: 2050 IEA CSP scenario. Arrows indicate CSP electricity transport. Consumption and Production in TWh [12]

The global installed capacity in 2015 was 5 GWe [5] [11]. In the Blue map scenario from the IEA it is
projected that CSP could supply 11.3% of the global electricity demand by 2050, i.e. 1000 GWe [12],
given that this technology receives the appropriate political support. This market is receiving at the
moment investments of more than $2 billion. Under this scenario the investment would almost reach
the $100 billion mark in 2050 [5].

2.3 Photovoltaic energy
Photovoltaic energy systems are present in different sizes thanks to their modular nature. PV cells are
able to convert solar radiation directly into electrical energy for small applications in pocket-size
devices up until large scale utilities without any moving parts. Regarding the solar resource the main
difference between CSP and PV is that photovoltaic panels make use of the whole solar irradiance, i.e.
the direct irradiance beams (DNI) and the diffuse irradiance, which is the irradiance scattered through
the atmosphere possessing no unique direction. The reflected irradiance from the ground is also used
by the PV panels. This means that photovoltaic panels are also able to produce energy during cloudy
days, in contrast to CSP plants, which can only collect and make use of the direct irradiance.

2.3.1 Basics of photovoltaics

The simplest unit of a photovoltaic power plant is the photovoltaic cell, also called solar cell. A PV
cell works based on the photoelectric principle. The energy provided by a photon can cause a
material’s electron to jump from one energy band (valence band) to a higher energy one, i.e. the
conduction band. This effect occurs in semiconductors, since the energy gap between the two bands is
small enough, so that when an external energy is supplied (photon energy) the electrons can move
from one band to the other [7]. If a load is connected and a circuit is made the electrons can move, thus
creating an electric current. There are different types of cells, the most important at the moment are:
 • Monocrystalline (Single-crystalline) Silicon
 • Polycrystalline (Multi-crystalline) Silicon
 • Thin film PV cells

Ricardo Alexander Chico Caminos 5
State of the Art

 Figure 6: Types of solar cells: From left to right: Mono-Si, Poly-Si, thin film cell (Amorphous Silicon). Modified from [5]

Monocrystalline Silicon (Mono-Si) cells have the highest efficiency of the three of them with 21%,
whereas polycrystalline (Poli-Si) have efficiencies of around 17% [13]. Thin-film cells describe cells
of different elements, such as amorphous Silicon, Copper-indium/gallium (CIGS) or Cadmium-
telluride (CdTe). These cells have 10%, 14% and 12% average efficiency accordingly [13]. Cells can
be mounted into a unit called module or panel, which can be then interconnected in parallel or series to
reach the desired voltage and power output. Photovoltaic module manufacturers provide information
about the efficiency of their systems. This efficiency is tested under a standard set of surrounding
conditions. These conditions are achieved in testing facilities, where all the single cells and modules
can be uniformly tested. These are the Standard Test Conditions (STC). The STC are defined as [14]:
 • Irradiance: 1000 W/m2
 • Spectrum: 1.5 Air Mass (AM)
 • Cell temperature: 25 °C

In operational conditions however, the efficiency is not as high as in STC. Irradiance, spectrum and
cell temperature are all dependent on the location, meteorological conditions and the state of the
module itself (cleanliness, plane tilt, etc.).

2.3.2 Photovoltaic plants

A typical configuration of a PV plant consists of many arrays of PV panels fixed to a mounting rack or
in few cases built with a 1- or 2-axis tracking system. These are connected together to an inverter,
which transforms the DC power into AC in order to feed it into the grid. The DC line losses should
ideally be kept at a maximum of 1%, for a correctly sized system it should not surpass 3% [15] [16].

 Figure 7: Grid-connected battery system without storage [16]

Ricardo Alexander Chico Caminos 6
State of the Art

The AC lines are typically smaller than DC and even more for central inverter system. The AC current
is then measured in a utility meter and transformed up to a higher voltage to reach the grid’s voltage
level. This normally occurs at a distribution level higher than 11 kV [16].

The individual PV modules are connected in series to form a string. A PV array consists of several
strings connected in parallel to a central inverter. This is the most typical configuration for medium-
and large-scale PV power plants, due to its simple installation and high reliability [16]. However, there
is the possibility to use a string inverter configuration. In this case an inverter is connected after every
string, hence being able to track the maximum power point (MPP) individually for each string and
reduce the overall mismatch and shading loss effects, but at a higher cost. The MPP is the optimal
operation point, where it generates the maximum possible power at all irradiance and temperature
conditions. The string inverter configuration might prove to be more effective in rather small
applications in areas where shading from nearby buildings are a problem, modules have a different
orientation or simply modules with different specifications are used [16]. The inverter does not always
have the same nominal rating as the PV module rating. The power ratio is defined as the ratio between
the inverter DC rated power and PV peak power [16]. According to [16] the Power Ratio is dependent
on each plant design specifications and reactive power regulations. It varies between 0.8 and 1.2. Most
commonly however, inverters are efficiently designed with a power ratio less than 1.0 [16]. In such
case the inverter clips power spikes that are near the panel’s peak power. This does not have a
significant impact on the total efficiency, since these peak power moments (near STC) are rare [17].
Normally, inverters work at a voltage of 300 V to 450 V. Thus the voltage at the panel side is normally
below 1 kV, as Fig. 8 shows.

 Figure 8: Voltage level of a typical PV grid-connected plant [16]

The aforementioned configuration is a common arrangement for grid-connected utility-size PV
systems without storage. The use of batteries has been commonly attributed to residential PV.
Nonetheless, as battery costs sink the application of batteries for PV power plants is becoming more
feasible. The layout for a PV system including a battery bank is shown in Fig. 9. In this case a charge
controller is used, which limits the battery current intake and output to protect the battery and to
regulate the power being fed in the grid.

Ricardo Alexander Chico Caminos 7
State of the Art

 Figure 9: Grid-connected residential PV system with battery. [18]

Battery-coupled DC configuration:

For many applications, the battery is used on the DC side of the arrangement. This requires less DC-
AC transformers. There are two modes of operation presented by Sauer [19], MPP-Tracker operation
and direct coupling between PV generator and battery.

The main function of an MPP tracker is to maintain the PV module at its maximum power point at all
operation conditions. The MPP tracker is a high frequency DC-DC converter [20], which converts the
DC output from the PV panel to a desired DC voltage and current. The voltage at the input side of the
DC-DC converter is kept at the maximum power point. Meanwhile, the voltage at the output side is set
congruently with the battery operational voltage. The charge controller can include this MPP tracking
function. Parra et al [21] used this mode of operation in their own study. It is also described in
Weniger et al [22], where it is used for a DC-coupled residential PV battery system.

 Figure 10: DC- coupled PV-battery system with MPP tracker [22]

The main disadvantage of the MPP tracker is the transformation loss that occurs in the DC-DC
converter. In some few cases it is more beneficial to operate the system with the battery directly
dictating the voltage at the PV module output [19]. Although the system does not generate the
maximum power it is compensated by not having the additional losses from the MPP tracker.

Ricardo Alexander Chico Caminos 8
State of the Art

Battery-coupled AC configuration:
The battery can also be installed on the AC side of the PV system arrangement, as in Fig. 11:

 Figure 11: AC-coupled PV-battery system [23]

The efficiency of DC and AC configurations depends strongly on the size, charging strategies and grid
boundary conditions, as indicated by Weniger et al [24]. AC configurations are especially suitable for
retrofitting existing PV systems [25].

2.3.3 Economic framework

Photovoltaic energy covered in 2015 1% of the total worldwide electricity demand. The total installed
power was 227 GWe [5]. The largest PV markets globally are Germany, Italy, Japan, Spain and
France [4]. China and the Unites States are also playing an important role in the development of PV.
According to the rather optimistic solar photovoltaic roadmap scenario from IEA it is expected that by
2050 the installed capacity could reach 3000 GWe, making 11% of the total global demand [13]. The
prices for PV modules have declined steeply in the last decade, falling by 79% between 2007 and 2014
[5]. The most recent study from IRENA states that the average LCOE in 2015 was 130 $/MWh and in
2025 it will be 60 $/MWh [11]. Starting this decade, another study projected the average LCOE to
sink from $ 105/MWh in 2020 to $ 45/MWh in 2050 [13]. The market is however currently highly
competitive and in some regions this mark was already surpassed, reaching the record-breaking price
of 27 $/MWh for a project in Mexico [26].

2.4 Energy storage
There are two main reasons why energy storage is such an important issue nowadays. The first aspect
is that energy production has to meet the demand. Energy demand is variable and the energy
infrastructure must be able to deliver electricity according to the flexible demand at all times [27]. On
the other hand, renewable energy sources are dependent on meteorological conditions, which can be
extremely variable too. The second reason is that energy is sometimes produced in places far away
from where it is consumed, e.g. off-shore wind parks or solar plants in sunny regions, where it is
necessary to transport the electricity generated to other regions [27]. In the case that new transmission
networks cannot be built, hydrogen storage could represent a suitable solution. For the expansion of
renewable energies it is therefore required that electricity is stored in an efficient and reliable way.

2.4.1 Types of energy storage

Energy storage can be classified under two different criteria, i.e. according to the form of energy used
and to the duration of use [27]. These are shown in Fig.12 and 13.

Ricardo Alexander Chico Caminos 9
State of the Art

 Figure 12: Types of energy storage according to energy form [27]

Hydrogen storage is thought to be the best technology for renewable energies to level the load over
long periods of time and batteries are the best option to stabilize the grid during peak loads, due to
their power range being between 1 kW to MW scale [21]. Besides these two technologies thermal
storage has great potential to store energy before converting it into electricity when needed.

Figure 13: Energy storage systems according to their duration and amount of energy possible to store. Flywheels, CAES and
 PHS: Mechanical energy capacity; Batteries: Electrical energy capacity; SNG and H2: Chemical energy capacity. [2]

Thermal energy storage (TES) is normally integrated to CSP plants to ensure an optimal power
dispatch for several hours after sunset. There are different types of TES. It can be split in three main
groups [28]:
 • Sensible heat storage
 • Latent heat storage
 • Chemical heat storage

Ricardo Alexander Chico Caminos 10
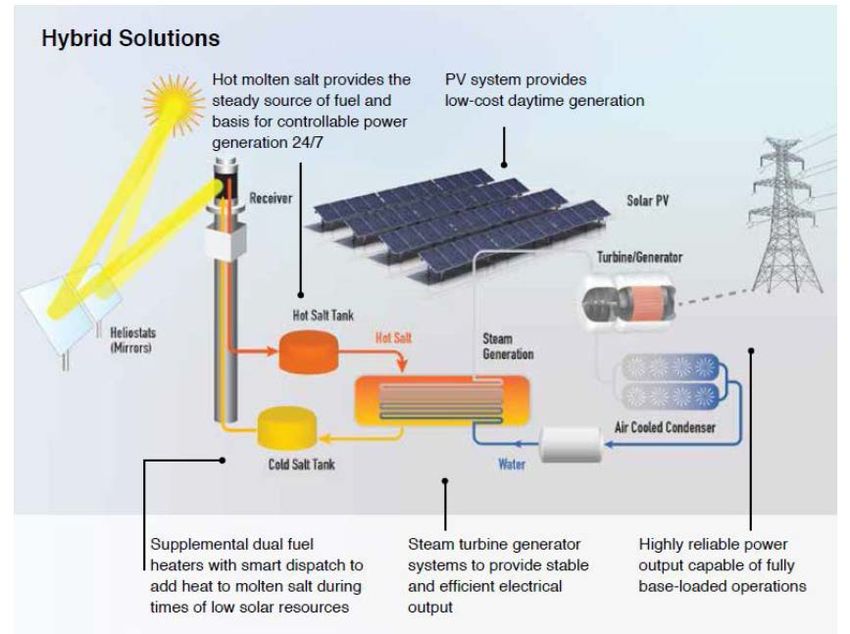
State of the Art

Sensible heat storage is based on the physical principle of storing and releasing energy from a medium
by a temperature difference. Latent heat storage makes use of a material’s enthalpy of transition, and
chemical heat storage is the use of reversible endothermic chemical reactions [28].
An example of sensible heat media is steam, mineral oils or molten salts, which are the most mature
technology for CSP. Whereas latent heat media can be paraffins, fatty acids or hydrated salts [28].
Sensible heat storage technology is mainly used in the form of active storage systems. This means that
the storage media stores and releases the heat through forced convective heat transfer [28]. There are
however, passive storage systems, where the heat transfer fluid gives away its heat energy to a
stationary solid material acting as storage. It can be regained afterwards by recirculating in the
opposite direction. An example of this technology is the ceramic storage system in the solar tower
Jülich, Germany.

Batteries can be classified into 3 main categories [29]
 • Primary batteries.
 • Secondary batteries.
 • Reserve batteries

Secondary batteries are also known as rechargeable batteries. Primary batteries are not able to be
recharged. A rechargeable battery is capable of transforming electricity into the form of chemical
energy in order to store it and using that chemical energy again to regain the electrical energy. This
process is enabled by an electrochemical redox reaction [29]. More information about batteries is
presented in Chapter 4.1.

2.4.2 Economic framework

Companies are looking into batteries as an increasingly growing market. In the US, the California
Public Utilities Commission aims to install 1.3 GW of energy storage in the state by 2020 [30]. In
Germany, on the other hand, there were until 2016 about 25.000 domestic battery installations for PV
systems, with a total capacity of 160 MWh. It is estimated that the amount will reach 150.000 in 2020
[31]. According to the World Energy Council, the total installed capacity of large batteries was
750 MW before 2016 and could reach 250 GW by 2030 [31].
Until 2014 the most utilized types of batteries in the power sector were [32]:
 • Sodium Sulphur batteries
 • Lithium-ion batteries
 • Advanced Lead-acid batteries
 • Redox flow batteries.

Even though sodium Sulphur batteries had the highest share on worldwide installed capacity until
2014, it is not expected that this technology will remain as the benchmark for this industry. Rather, the
Li-ion batteries and advanced Lead-acid batteries are trending to become the favorite technology [32].
Lithium-ion (Li-ion) batteries have been extensively researched in the last years, due to their
application in mobile applications and most recently in the electric car industry. The currently most
used batteries for electric cars are namely, lithium-nickel-cobalt-aluminum (NCA), lithium-manganese
oxide spinel (LMO), lithium-nickel-manganese-cobalt (NMC), lithium-iron phosphate (LFP) and
lithium titanate (LTO) [33]. Lead-Acid batteries have been used in large-scale storage systems since
many decades now. In 1988 the world’s largest energy storage battery facility was made of Lead-Acid
batteries and was located in California, US. It consisted of a 40 MWh system, being able to feed in
10 MW of electricity in the grid at 2 kV and 8 kA 4 hours long [29]. Nowadays there are larger battery

Ricardo Alexander Chico Caminos 11
You can also read