Techno-economic and Commercial Opportunities for CCS-Ready Plants in Guangdong Province, China - Feasibility Study of CCS-Readiness in Guangdong ...
←
→
Page content transcription
If your browser does not render page correctly, please read the page content below
Feasibility Study of CCS-Readiness in
Guangdong Province, China (GDCCSR)
          Final Report: Part 4

   Techno-economic and
Commercial Opportunities
 for CCS-Ready Plants in
   Guangdong Province,
          China

            GDCCSR-ED Team
              March 2013

                  1
Authors (GDCCSR-ED Team):
Prof Jon Gibbins, Dr Mathieu Lucquiaud
(School of Engineering, University of Edinburgh)
Dr Xi Liang
(Business School, University of Edinburgh)
Dr David Reiner
(Judge Business School, University of Cambridge)
Dr Jia Li
(College of Engineering, Mathematics and Physical Sciences, University of Exeter)

For comments or queries please contact:
Prof Jon Gibbins (jon.gibbins@ed.ac.uk ) or Dr Xi Liang (xi.liang@ed.ac.uk )

Disclaimer
This is the fifth part of the final report of the project “Feasibility Study of
CCS-Readiness in Guangdong (GDCCSR)”, which is funded by the Strategic
Programme Fund of the UK Foreign & Commonwealth Office joint with the Global
CCS Institute, nor of the funding organizations.
The report is written based on public data mainly. While the authors consider that the
methodology and opinions in this report are sound, they do not warrant the accuracy
or completeness of the reported subjects. The authors are not liable for any loss or
damage arising from decisions made on the bases of this report. The views in this
report are the opinions of the authors and do not necessarily reflect those of the
Universities of Edinburgh, Cambridge or Exeter, nor of the funding organizations.

The complete list of the project reports are as follows:
    Part 1 Analysis of CO2 emission in Guangdong Province, China.
    Part 2 Assessment of CO2 Storage Potential for Guangdong Province, China.
    Part 3 CO2 Mitigation Potential and Cost Analysis of CCS in Power Sector in
           Guangdong Province, China.
    Part 4 Techno-economic and Commercial Opportunities for CCS-Ready Plants
           in Guangdong Province, China.
    Part 5 CCS Capacity Building and Public Awareness in Guangdong Province,
           China
    Part 6 CCUS Development Roadmap Study for Guangdong Province, China.

                                          2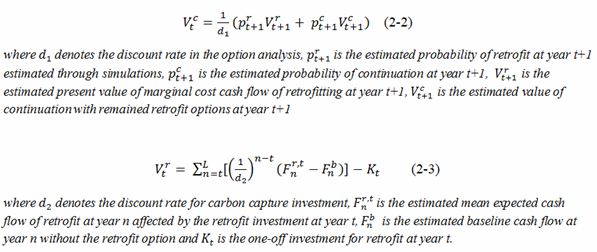
Contents
                                                                 Page
Background for the Report……………………………………………                       4

Executive Summary……………………………………………………                            5

1. Summary of CCS Ready (CCSR) Principles………………                  8

2. Technical Study on Steam Cycle Configuration for CCSR for a
Potential Ultra-supercritical Power Plant (USCPC) in Guangdong   9

3. The Economics of CCSR: A Case Study of A Generic
Ultra-supercritical Power Plant (USCPC) in Guangdong……………        18

4. The CCS Ready Hub Concept………………………………………                      25

5. Power Plant Developers’ Perspectives on Implementing CCSR…    32

6. Conclusions and Implications………………………………………                   43

Acknowledgements……………………………………………………                             44

References………………………………………………………………                               44

Appendix I: List of Papers Published or Presented…………………         47
Appendix II: Guangdong Cement Plant CCS Case Study …………          47

                                     3
Background for the Report
CO2 capture and storage (CCS) is an important technology to decarbonise the Chinese
coal-dominated electricity sector. On average, approximately 1 GW of new coal-fired power
capacity starts construction in China every week, but there is currently a lack of necessary
incentives to support a large scale implementation of CCS in China, since these would have to be
underpinned by a global climate change mitigation process with an appropriate level of ambition
and shared responsibilities to drive widespread CCS. Li (2011) investigated 74 large coal-fired
power plant sites 1 in China and discovered that less than one-fifth of these sites appear to have a
high retrofitting potential. To avoid the long-term persistence of this unfavourable situation for
subsequent CCS deployment, CO2 capture ready (CCSR) is a design concept to ease the future
retrofitting of fossil fuel plants 2 with CO2 capture, transport and storage in their lifetime. Building
new plants with a CCSR design and siting philosophy is crucial in terms of preventing carbon
lock-in 3 of new plants.

Guangdong is a pioneer in the reform of the Chinese economy and one of the most developed
provinces in China (OECD, 2010). The provincial government of Guangdong plans gradually to
establish a green energy system. In late 2010 the government set a target to reduce carbon
intensity and a pilot carbon emission trading scheme has started from 2012. However, by March
2010, 16GW of ultra supercritical pulverised coal power plants (USCPC) with a unit size of
1000MW were already in the construction stage, while an even greater amount of large coal-fired
power plants are pending for approval. The implementation of CCSR concepts in these plants to
ease subsequent retrofitting to CO2 capture therefore becomes an urgent task in Guangdong. This
study addresses the technical, economic, financial and stakeholder acceptability aspects of CCSR
in Guangdong and investigates potential drivers and barriers to implement CCSR in Guangdong
immediately.

This report forms the fourth part of the final report of the project “Feasibility Study of
CCS-Readiness in Guangdong (GDCCSR)”. The project (April 2010 to Mar. 2013) is funded by
the Strategic Programme Fund of the UK Foreign & Commonwealth Office joint with the Global
CCS Institute.

1
    The total installed capacity of each power plant site is equal to or larger than 1GW.
2
    Fossil fuel plants include coal‐fired power plants, natural gas power plants, refinery plants and etc.
3
    Inability to retrofit a plant to CO2 capture and reduce emissions in the lifetime.

                                                            4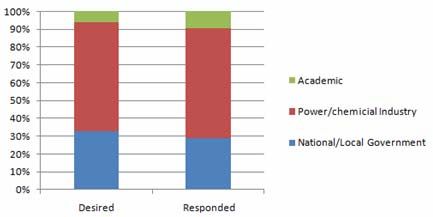
Executive Summary
Technical analyses undertaken for this study show that typical 1GW supercritical steam plant in
China can be made carbon capture and storage ready (CCS ready, or CCSR) without
compromising performance before CO2 capture is added to the plant. Carbon capture-readiness
would not penalise efficiency. Typical 1GW supercritical Chinese power plant steam cycles also
present the ability to be retrofitted and subsequently upgraded with a range of solvents and meet
the principles of good performance with capture, capacity to operate without capture and to be
retrofitted with a range of future improved solvents.
Limited additional capital costs would be necessary to implement the capture-ready measures to
ensure that the principles above are met. These low-cost measures would not significantly affect
initial power capital costs. The main effect is to allow a wide range of possible capture
equipment configurations to be realised at the time the plant is retrofitted with CCS, when
technical requirements and economic performance of the technologies to be used will be known
with sufficient accuracy to make the necessary decisions and optimisations.
The Real Options Analysis (ROA) model and simulation of a generic 1GW USCPC power plant in
Guangdong shows that CCSR investment can provide US$3 million to US$16.9 million value to
the power project. If the plant would otherwise be non-retrofittable, in absence of a CCSR design,
the benefit of CCSR investment can reach $81 million to US$94 million. In addition, CCSR will
also increase the retrofitting possibility by 5 to 8 percent; reduce the mean levelised cost of
electricity by $0.4/MWh and advance the optimal retrofitting timing by about 1 year.
In addition to assessing the economics of CCSR at individual plants, this report also investigates
the concept of a ‘CCS Ready Hub’, which requires designing CCS ready systems at a regional
planning level. The ability to transport CO2 to secure storage sites with the capacity to match
infrastructure investment capital recovery periods is a key requirement in addition to capture
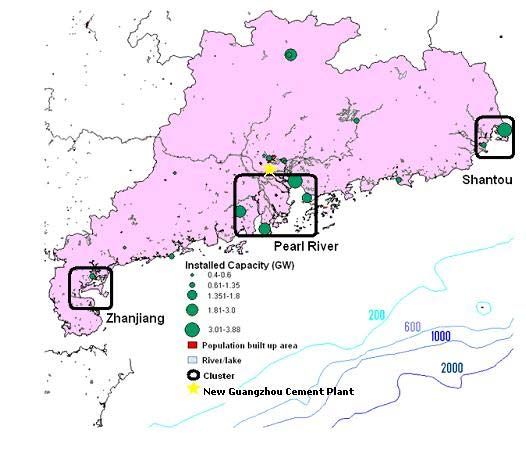
readiness at power plant and other major emission sites. The bulk of Guangdong’s storage
capacity is offshore and offshore storage also maximises the prospects of gaining public
acceptance. But cost-effective pipeline transport and storage site development for offshore
requires a degree of infrastructure sharing and hence common planning to achieve economies of
scale. This leads to the concept of a ‘CCS cluster’, already pioneered in the UK and Netherlands
(e.g. Central North Sea, Rotterdam Capture and Storage Demonstration Project), with a group of
adjacent onshore emission sources linked to a group of offshore storage sites by a large, and hence
cost-effective, common dense-phase CO2 pipeline.
A case study to evaluate the economics of the ‘CCS ready hub’ in Shenzhen (Li, J., Liang, X.,
Cockerill, T., 2011) suggested that there would be approximately 5% reduction in the average CO2
avoidance cost if designing CCSR occurred at a regional planning level rather than at the level of
individual power plants. This implies a significant synergy through coordinating the
5implementation of CCSR through the provincial or city governments. For initial projects, where
first-mover learning and regulatory barriers must be overcome, sharing the development of a
cluster with partners and government is likely to reduce effective risk-associated costs and
accelerate deployment even more strongly.
Through communication with industry and government officials it was found that there were a
number of potential drivers for CCSR, including:
(a) the potential support from the provincial low-carbon energy and industry upgrade policy,
(b) the role of CCSR in maintaining the security and diversity of electricity supply in Guangdong,
leading to likely greater ease for permitting new power plants,
(c) the power plant operators’ reluctance to close plant earlier in its lifetime,
(d) the possibility of partial retrofit and partial CO2 capture,
(e) potential financial support through the existing provincial or other local incentives to
encourage innovation; and
(f) attracting foreign Investment.
On other hand, the study also found a number of barriers, including:
(a) lack of national policy support schemes,
(b) rigid land control,
(c) lack of information on CCSR design among power companies (although this reduced
significantly over the course of the project),
(d) uncertainties in achieving access to storage sites; and
(e) lack of understanding and awareness of carbon markets or other possible financial support
instruments such as increased electricity tariffs for CCS plants.
Report Structure
This report consists of five sections. The first section of the report summarise the principles and
definitions of CO2 Capture Ready (CCS Ready, or CCSR). How are the CCSR principles
implemented immediately in Guangdong? We conduct an online survey and two focus group
discussions to understand the perceptions of stakeholders.
The second section presents a technical analysis of CO2 capture ready design configuration for an
ultra-supercritical coal-fired power plant (USCPC) in Guangdong.
Building on the existing studies on CCSR, for the third section, a real option analysis was
conducted to investigate the economic value of CCSR and the possibility of retrofit in an
individual project in Guangdong.
The transportation infrastructure and source-sink matching is essential for a large-scale
implementation of CCS and so an essential component of a CCSR project. Therefore, the fourth
section develops and analyses the concept of a capture ready hub and analyses its economics if
6applied in Shenzhen city. Other than CCSR at individual projects, the CCSR hub concept suggests
the implementation of CCSR at a regional planning level.
The fifth section discusses the perspective of plant developers on CCSR, following by an analysis
of the perspective of the Guangdong provincial government on CCSR and some possible incentive
mechanisms to finance the investment of CCSR immediately.
The last section concludes this study and discusses the implications for future work.
71. Summary of CCS Ready (CCSR) Principles
At the request of the Gleneagles G8 submit (G8, 2005), the IEA Greenhouse Gas Programme (IEA
GHG) published a study (IEA GHG, 2007) which identified the following key elements for CCS
Ready power plants:
A CO2 capture ready power plant is a plant which can include CO2 capture when the necessary
regulatory or economic drivers are in place. The aim of building plants that are capture ready is to
reduce the risk of stranded assets and carbon lock-in.
Developers of capture ready plants should take responsibility for ensuring that all known factors
in their control that would prevent installation and operation of CO2 capture have been identified
and eliminated. This might include:
A study of options for CO2 captures retrofit and potential pre-investments
Inclusion of sufficient space and access for the additional facilities
Identification of reasonable routes to storage of CO2
Competent authorities involved in permitting power plants should be provided with sufficient
information to be able to judge whether the developer has met these criteria.
Since the IEA GHG definition, a number of studies have been conducted to further discuss the
definition, the engineering requirements and the implementation of CCSR (IChemE, 2007;
Mott-McDonald, 2008; SCCS, 2008) In 2010, building on the study by IEA GHG, a joint
IEA/CCSLF/GCCSI meeting and subsequent working party in which three members of the current
project team (Gibbins, Li and Liang) participated prepared an internationally-agreed definition of
Carbon Capture and Storage Ready (GCCSI, 2010) with an initial summary as follows and a full
definition supplied in Appendix 1 :
“A CCSR facility is a large-scale industrial or power source of CO2 which could and is intended
to be retrofitted with CCS technology when the necessary regulatory and economic drivers are in
place. The aim of building new, or modifying existing, facilities to be CCSR is to reduce the risk of
carbon emission lock in or of being unable to fully utilise them in the future without CCS
(stranded assets). CCSR is not a CO2 mitigation option, but a way to facilitate CO2 mitigation in
the future. CCSR ceases to be applicable in jurisdictions where the necessary drivers (for CCS)
are already in place or once they come in place.”
82. Technical Study on Steam Cycle Configuration for CCSR for
Potential Ultra-supercritical Power Plant (USCPC) in Guangdong
2.1 Introduction
When considering building a plant as capture-ready for post-combustion capture, the design of the
steam cycle is of critical importance for effective thermodynamic integration of the capture
equipment with the power cycle. The thermodynamic integration may be less apparent and more
complex than the need to leave space for capture-related equipment and tie-ins.
Regulatory and technology related uncertainties make effective thermodynamic integration
throughout the whole operating life of fossil plants a challenging objective to achieve. The
characteristics of the capture system are likely to be unknown at the time of commissioning whilst
the plant must operate for an undetermined period without capture. These pre-requisites must be
taken into account when designing steam turbines for CO2 capture-ready plants. This work
examines options for capture-ready steam turbines for (Huaneng Yuanan power plant design, taken
here as a typical Chinese supercritical steam plant with a 1 GW capacity, as is proposed for
Pinghai power plant. Pinghai power plant is located on the east side of Daya Bay approximately
100km South of Huizhou city in Guangdong.
In addition to the general requirements for making the plant carbon capture-ready as stated in the
introduction above, amine-based post-combustion capture processes specifically require changes
to the flue gas desulphurization (FGD) equipment design so that high levels of sulphur oxide
removal can be achieved. Some developers may prefer to add a polishing unit after a previously
installed FGD process during the CO2 capture retrofit.
Making the steam cycle ‘capture friendly’ is also an important feature so as to be able to supply
the required amount of steam for the capture system, at the pressure corresponding to the required
saturation temperature for thermal regeneration of the solvent (allowing for pressure losses and
temperature drops in the system).
Ideal principles to make plant carbon capture-ready are introduced below. Although, in practice, it
is impossible to meet these principles simultaneously, power plant developers should aspire to
trade-offs to achieve close matching, whilst maintaining satisfactory operability of the plant.
Ideal carbon capture-ready (CCSR) plant principles
1. The efficiency of a CCSR plant before capture is fitted should be the same as the efficiency of a
state-of-the-art standard plant designed with no consideration of capture ready principles.
2. The efficiency of a retrofitted CCSR plant should be the same as a new plant built with CCS
from the start – and with the same steam conditions – at the time when the retrofit occurs.
3. There should be no upfront additional costs for a CCSR plant compared with a standard
state-of-the-art plant.
4. The retrofitted power plant should have the ability to operate without capture.
95. The CCSR plant should allow for future technology developments and when the capture
technology is upgraded the retrofitted plant should have the same efficiency as a CCS plant – with
the same steam conditions – built with perfect foreknowledge of what the upgrade technology
would be.
It should be noted that the approach adopted here follows previous work in this area by Sekar
(2005), Bohm et al. (2007) and Liang et al (2009). It implies that CCSR plants implement only
minimal essential upfront capital cost options, with an acceptable loss in the maximum power
output of the plant when it is fitted with CCS, and with little or no effect on plant performance
prior to retrofit, since economics depends critically on unknown parameters, such as time to fit
capture, future fuel, CO2 prices, etc.
2.2. Methodology
The performance of the Huaneng Yuhuan power plant in the Zhejiang Province, China has been
modelled in gPROMS (a process modelling software) based on a heat flow diagram provided by
the project partners to provide relevant guidance for the design of carbon capture-ready steam
plants in Guangdong with the same 1 GW capacity.
A diagram of the heat flow diagram is shown below in Figure 2.1. It is a supercritical steam cycle
with a single flow HP cylinder, a double flow IP cylinder and two double flow LP cylinders. Steam
exits the IP turbine around 6-6.5 bara, a value that is well suited for a retrofit with steam extraction
directly from the IP/LP crossover pipe.
LP LP
IP HP
1
3
2 1
condenser
3
2
Figure 2.1 Heat flow diagram of the Huaneng Yuhuan power plant
10The performance of the steam cycle without capture are calculated, and then compared to the
performance of the cycle when capture is added. Other assumptions are reported in Table 2.1.
When the plant operates with capture, effective thermodynamic integration between the power
plant and the capture and compression system is necessary to reduce the electricity output penalty
of steam extraction. State-of-the-art integration is implemented to provide the thermal energy
necessary for solvent regeneration in the capture plant and use low-grade heat available in the
compression train for feed water heating:
Steam is extracted from the crossover pipe between the intermediate pressure (IP) and low
pressure (LP) turbine to reject heat at a temperature as close as possible to the temperature of
regeneration of the solvent.
The solvent reboiler condensate returns to the power cycle at a temperature as close as possible to
the boiler condensate, as opposed to returning to the power cycle condenser.
Boiler condensate leaving the power cycle condenser is heated using low‐grade heat from the
compressor intercoolers and from the reflux condenser at the top of the desorber, as outlined in
Figure 2.2.
Table 2.1 Assumptions for modelling of the steam cycle
Steam cycle without capture
Base-load operation has been considered with the overload valve closed and no water-make up
Steam leakages through turbine glands and bearings have been neglected
Steam cycle with capture
Changes to LP turbine leaving losses have not been considered
Fuel specific emissions: 343.4 gCO2 per kWh thermal LHV, based on median coal properties in Appendix
2
Boiler efficiency assumed to be 94%
Solvent energy of regeneration range from 2GJ/tCO2 to 3.5GJ/tCO2
Solvent temperature of regeneration of 100ºC, 120ºC and 140ºC (with higher temperatures able to lead to
reduced overall electricity output penalties due to reduced CO2 compression power requirements)
2.3 Carbon capture retrofit and capture-ready design
When building a new plant carbon capture-ready it is important to take into account the
uncertainty related to the selection of the capture technology. New solvents for post-combustion
capture are still being developed. A key parameter is the temperature of regeneration of the
solvent in the reboiler of the capture system, which determines the extraction pressure of steam
11from the power cycle. When an existing unit is retrofitted, there is likely to be a mismatch
between the steam extraction pressure required for solvent regeneration and the pressure of the
crossover pipe between the IP and LP cylinder where low pressure can be extracted from. If the
crossover pressure is too low, the capture system is likely to operate in a region where
performance is sub-optimal and additional steam is required for the same amount of CO2 captured
and regenerated.
If the crossover pressure is too high, the LP turbine inlet needs to be throttled using the turbine
inlet valve to maintain the crossover pressure and steam in the extraction line going to the reboiler
also needs to be throttled. This creates a loss when pressure in the valve is reduced at the expense
of an increase in entropy. Given that the outlet pressure of the LP turbine is set by the cooling
temperature, and in this case limits the enthalpy drop, the LP turbine is effectively derated.
It is possible to avoid unnecessary thermodynamic losses by letting the IP turbine outlet pressure
“float” when steam is extracted, also called “uncontrolled extraction”. The pressure is no longer
controlled by the valve but rather determined by the amount of steam extracted and the low
pressure cylinder steam swallowing capacity. This system can eliminates all losses in the LP
turbine valve when the plant operates at base load, provided that the IP/LP crossover pressure does
not drop below the extraction pressure required for the capture process. If this is the case, then
throttling occur at the LP turbine inlet, but performance is still improved since additional work is
generated by the IP turbine.
The IP cylinder must be capable of accommodating both the reduced exit pressure and increased
stage loadings with capture, increased blade bending moments and possibly also flow restrictions.
This may be done by suitably designing the last stages of the IP turbine from the outset so that the
capture conditions can be sustained without any changes, thus avoiding the need to open up the
cylinder and make any modifications. Alternatively, the IP turbine can be modified as part of the
conversion to better match its new operating conditions. In both cases a slight loss in IP cylinder
efficiency occurs with capture although this is likely to be within normal design variations.
Steam turbine design with high numbers of turbine stages, hence less work generated per stage,
are more suited for floating pressure operation. Reduced IP turbine outlet pressure will also
increase axial thrust on the bearings but it can be expected that this will be balance out for double
flow units like in this configuration.
The plant steam cycle uses Siemens technology with 50% reaction stage, i.e. high numbers of
turbine of stages, and also a double flow IP turbine. It is thus well suited for floating pressure
operation (i.e. axial loads balanced, changing pressure/enthalpy drop distributed over many
stages).
12Floating pressure
LP LP back pressure
turbine
IP HP
1
3
2 1
condenser Desuperheater
3
Solvent reboiler
Heat recovery from 2
capture process
Figure 2.2 Heat flow diagram of the Huaneng Yuhuan power plant with integration with the carbon capture
unit
For improved solvents with a low thermal energy of regeneration, and hence reduced steam flow,
it is possible that the IP/LP crossover pressure, even when reduced from non-extraction values,
will be higher than the steam pressure required in the reboiler. The addition of a back pressure
turbine in the extraction line will avoid throttling losses and generate additional power. Although
this turbine is not required for operation without capture it is recommended that arrangements are
made as a carbon capture-ready feature. This notably involves provision for the addition of a
mechanical device, such as a self-synchronising SSS clutch (SSS) at the free end of the generator
and a turbine base-plate, to connect the back pressure turbine to the main shaft and avoid the need
for a separate generator when the plant is retrofitted.
It is also worth nothing that when operated without capture (e.g. to temporarily maximise power
output at periods of high demand (Chalmers et al.)) the steam cycle returns to an operating regime
similar to the conditions before retrofit to ensure that the plant operability is maintained.
2.4 Performance with capture
Steam turbine design for a subsequent capture retrofit should offer flexibility to allow for solvent
upgrading (probably several times over the lifetime of the plant) as well achieving a low electricity
output penalty at a selected design point (or averaged over a design range).
13More flexible arrangements for steam extraction help avoid the risk of a retrofitted plant turning
into a stranded asset after a period of technology change when less energy intensive solvents with
potentially a different temperature of regeneration are likely to become available.
The fifth principle for the design of CCS ready (CCSR) plant previously proposed is now being
considered. It is repeated below for clarity:
‐ A CCSR plant should allow for future technology developments, and when the capture
technology is upgraded the retrofitted plant should have the same efficiency as a CCS
plant with the same steam conditions built with perfect foreknowledge of what the
upgrade technology would be.
Capture-ready steam turbines can be designed for a given steam extraction rate at the IP/LP
crossover pipe to provide the right amount of heat for a specific solvent. Although it is impossible
to design a capture‐ready steam cycle with an ideal efficiency for a range of solvents, it is
feasible to design steam cycles that can achieve performance close to the ideal for a given range of
solvents. Future performance of solvents remains, by definition, unknown but reasonable options
in the design of the steam cycle can handle a wide range of uncertainty
The capture-ready retrofit option proposed with a floating IP outlet pressure is capable of meeting
this requirement for a range of solvents. A sensitivity analysis is presented below showing the
performance of the steam cycle for solvent energy of regeneration varying from 2 GJ/tCO2 to 3.5
GJ/tCO2, and temperature of regeneration of varying from 100ºC to 140ºC. Current state-of-the-art
technologies for post-combustion capture rely on a range of solvents with energy of regeneration
around 2.5-3 GJ/tCO2 +-30%, and temperature around 100-120ºC
The results are presented in Figure 2.3. It should be noted that this does not include power
requirement for CO2 compression and the ancillaries of the capture unit (additional flue gas
blowers, solvent circulating pumps etc), which typically account for 80-120 kWh/tCO2 depending
on the solvent. For the coal chosen in this analysis this would correspond to an additional 60-90
MWe. It is difficult to predict compression requirements for unknown solvents since their
thermodynamic properties have a significant effect on the performance of the solvent regeneration
part of the capture system, which in return determines the inlet pressure of the compression train,
and hence the power requirements.
14100ºC 120ºC 140ºC w/o capture
1020
1000
980
960
Generator Output (MW)
940
920
900
880
860
840
820
2 2.2 2.4 2.6 2.8 3 3.2 3.4
Solvent energy of regeneration (GJ/tCO2)
Figure 2.3 Generator output of retrofitted steam cycle for a capture rate of 90% for a range of solvent
energy and solvent temperature of regeneration. Note that an additional 60-90MW penalty is occurred for
compression to dense phase CO2 at 110 bar and for capture ancillaries.
It is also interesting to report the total electricity output penalty of adding capture so that
performance can be evaluated independently of the properties of the coal chosen. The total
electricity output penalty is defined as:
Electricity Output Penalty = Efficiency penalty / Fuel specific emissions (Eq 2-1)
Electricity Output Penalty (kWhe/tCO2)
Efficiency penalty (kWhe/kWhth or % point LHV)
Fuel specific emissions (tCO2/kWhth)
The electricity output penalty is the total net loss in plant output due to the capture and
compressions processes, including the reduction in steam turbine power output due to steam
extraction and the power requirement for compression and smaller amounts of power for the
capture plant ancillary equipment but also including any offsets due to beneficial heat recovery for
condensate heating and other purposes, divided by the absolute mass flow of compressed CO2
exiting the plant boundaries, as indicated below:
EOP = 1000 * (Loss of generator output + Compression power + Ancillary power)
/ CO2 mass flow (Eq 2-2)
Electricity output penalty (EOP) (kWhe/tCO2)
Loss of steam turbine generator output (MW)
Compression power (MW)
Ancillary power (MW)
CO2 mass flow (tonne/hr)
Results are reported as the electricity output penalty of steam extraction in Figure 2.4.
15100ºC 120ºC 140ºC
250
Electricity output penalty of steam extraction (kWh/tCO2)
200
150
100
50
0
2 2.2 2.4 2.6 2.8 3 3.2 3.4
Solvent energy of regeneration (GJ/tCO2)
Figure 2.4 Electricity output penalty of steam extraction for a CO2 capture rate of 90% and for a range of
solvent energy and solvent temperature of regeneration. Note that an additional 80-100kWh/tCO2 penalty is
occurred for compression to dense phase CO2 at 110 bar and for capture ancillaries
The IP turbine outlet pressure is also shown in Figure 2.5 for the same range of solvents. The
horizontal lines correspond to sub-optimal performance where the IP turbine outlet pressure has to
be controlled by throttling the inlet of the low pressure turbine inlet with a valve in order to
maintain solvent temperature of regeneration. It shows that high temperature of regeneration
solvents regenerated at 140ºC would require throttling of the LP turbine, whilst low temperature
solvents regenerated at 100ºC would not. The latter would be capable of performance very close to
new-build plants built with perfect knowledge of the solvent from the outset. For solvents
regenerated at 120ºC performance would be very close to new-build plants, except for solvents
requiring low levels of steam extraction.
16100ºC 120ºC 140ºC w/o capture
7
6
5
IP turbine outlet pressure
4
3
2
1
0
2 2.2 2.4 2.6 2.8 3 3.2 3.4
Solvent energy of regeneration (GJ/tCO2)
Figure 2.5 Intermediate turbine outlet pressure for a CO2 capture rate of 90% and for a range of solvent
energy and solvent temperature of regeneration. Note that the horizontal lines correspond to sub-optimal
performance where the low pressure turbine inlet has to be throttled to maintain solvent temperature of
regeneration
2.4 Carbon Capture Ready measures
This analysis shows that typical 1GW ultra supercritical steam plant in China can be made carbon
capture-ready without compromising performance before CO2 capture is added to the plant.
Carbon capture-readiness would not penalise efficiency. Typical 1GW supercritical Chinese power
plant steam cycles present the ability to be retrofitted with a range of solvents and meet the
principles of good performance with capture, capacity to operate without capture and to be
retrofitted with a range of future improved solvents.
Limited additional capital costs (0.5% to 3%) would be necessary to implement the following
capture-ready measures to ensure that the principles above are met. These low-cost measures
would not significantly affect capital costs. The principle additional items to implement carbon
capture-readiness to the steam cycle are:
Access to steam extraction from the IP/LP crossover within the turbine hall
A tee-piece with a flange for a suitably sized steam off-take to be connected at the IP/LP
crossover and a spool piece for the valve (or a spool piece for both),
Allocate space for a throttling valve in the extraction line downstream of the steam off-take
tee,
Reinforcement of the last IP turbine blades to tolerate pressure and temperature variations at
the IP/LP crossover
Reinforcement of turbine hall foundation for the future addition of a back pressure turbine,
ideally at the free end of the alternator (see below)
Provision for a clutch for connection of an additional back-pressure turbine to the main
alternator shaft free end
173. The Economics of CCSR: A Case Study of a Generic
Ultra-supercritical Power Plant (USCPC) in Guangdong
3.1 Background
The section presents the methodology and results of an economic model for valuing CCSR in a
generic ultra-supercritical pulverised coal (USCPC) power plant in Guangdong 4 . We take the
perspective of a project investor to investigate the value of CCSR and the strategy for exercising
the option of retrofitting CCS to the USCPC plant 5 .
3.2 Methodology
A deterministic net present value may fail to capture the option value of retrofitting involved in the
sequential decision-making (to retrofit or not) occurring at each year. Therefore, building on
previous studies on the economics of CO2 capture ready (Liang et al, 2009; Sekar, 2005), a real
option approach (ROA) 6 is applied to value of the retrofitting option in a generic 1GW USCPC
generation unit power plant built in Guangdong.
Uncertainty is the driver of the option value. We build a stochastic cost cash flow model and use
option value at each time-step (i.e. year) as the criterion to justify the decision of retrofitting.
The ROA decision-making framework for retrofitting is a complex model with American style
claims (i.e. options could be exercised anytime from now to an expiry date), therefore it requires a
backward looking algorithm to find the optimal exercise boundary. We will use a least square
regression method with Monte-Carlo simulation to estimate the continuation without upgrade and
upgrade option exercised value at each option decision node (Long staff and Schwartz, 2001).
At year t-1, the total value of a project if the retrofitting option is anticipated to be exercised in
year t is:
L
Vt retro D(t , n) Et [Vt retro ]K (Eq. 3-1)
n t
where D(t,n) denotes the discount factor applied at time t to the cash flows impact of exercising an
retro
the retrofitting option at year n, the retrofitting year is t, Vt is the expected cash flow impact of
retrofit at year n affected by the retrofit at year t, and K is the one-off investment for retrofit.
At t-1, the anticipated continuation value which is the optimal option value of the project if
choosing not to exercise the retrofitting option at year t:
4
We apply the electricity tariff, coal price, capital and labour cost of Guangdong for this study.
5
The model would be able to apply for analysing a specific plant base on subsequent engineering studies.
6
The real option approach assumes the business decisions are dynamic. It captures the value of flexibilities in
making decisions in an investment’s lifetime. For example, by investing in a coal‐fired power plant, an investor has
option to expand, close down, retrofit, change the operational load factor. The value of these options cannot be
captured through traditional deterministic approach.
18(Eq. 3-2)
cont
where Vt is the optimal value at year t affected by the continuing running decision at year n.
At year t-1, if the anticipated value of retrofitting to capture is higher than the anticipated value of
continuing running without exercising the retrofitting option, the retrofitting investment will takes
place at year t. Our study investigates the retrofitting option from year 5 (2012), the value of the
project will be equal to the risk neutral value of retrofitting at year 5 and the option value to
continue running at year 5.
(Eq. 3-3)
retro
Where pt is the risk neutral probability of retrofitting at year t anticipated at year t-1.
A number of uncertainties could potentially affect the investment decision of retrofitting the
underlying power plant. The main driver of retrofit is the cost of emitting CO2 (i.e. carbon price).
The retrofitting investment and electricity penalty need to be justified by the avoidance of CO2
emissions and hence lower carbon emissions cost.
dCt dT dz (Eq. 3-4)
Where is the expected growth rate; is the instantaneous standard deviation.
The study transformed the eq. 3-4 into a discrete time process to model the annual carbon prices.
The real growth of carbon price is assumed to be 4% per annual (as shown in Table 3.1). The
initial carbon price refers to CDM project contract price which is $15/tCO2e (or CNY93) in 2012.
This will imply a mean cost of CO2 emissions at $21/tCO2 (or CNY 130) in 2020 and $30/tCO2e
(or CNY186) in 2030.
In China the on-grid electricity tariff of thermal power is significantly affected by the cost of coal.
The correlation coefficient of the coal price and electricity tariff is set at 60%. The price of coal
and the on-grid electricity tariff are assumed to follow a mean reverting process. The growth of
both coal and electricity is projected to rise with inflation. Both prices tend to drift towards its
long term mean assumptions which are $4/GJ for coal (or CNY750/tonne metric coal) and
$0.065/kWh (or CNY0.42/kWh) for electricity. The study transformed the eq. 3-5 into a discrete
time process to model the annual electricity prices.
dPt ( Pt )dt t (Eq. 3-5)
where is the mean reversion rate, is the long-run equilibrium rate, is the standard
deviation, t is the random component.
As Li (2010) indicated, less than 20% of large power plant sites have good retrofitting prospect,
19therefore we analyse two scenarios: A. the plant is retrofittable without CCSR, but CCSR
investment would reduce the cost and efficiency penalty in and after retrofitting; and B. the plant
is unable to be retrofitted in absence of CCSR investment. In Scenario A, the value of CCSR
would be equal to the difference of retrofittable options (i.e. option value with CCSR – option
value without CCSR – investment for CCSR). In scenario B, the value of CCSR would be equal to
the total value of retrofitting option less the investment of CCSR.
Table 3.1 Assumptions for the Economic Analysis
Parameters Data Notes
Plant Type USCPC
Risk-Free Discount Rate 5%
Capacity before retrofit 1012.5 MW
Net Supply Efficiency (LHV) before retrofit 41.80% 42.7% at full load
Efficiency Penalty without CCSR at retrofit 8.4% (reduction with CCSR, please see
(CCSR will not cause energy penalty) Table 3.1)
Capacity with 90% capture 808.4 MW 8.4% efficiency penalty
Lifetime Degrading factor 1.00%
Fixed Capital Base Plant 634 US$ million (eqv. $626/kW)
Load factor before retrofit 70%
Load factor after retrofit 80%
Coal Price 4 $/GJ
Std dev of coal price 10%
On-grid Electricity Tariff 0.065 US$/kWh
Std dev of On-grid Tariff 5%
2008 Carbon Price 15 $/tonne
Annual Real Growth of Carbon Price 4%
Std dev of Emissions 10%
Emissions factor base 758.4 gram CO2/kWh
Emissions factor w capture 97.6 gram CO2/kWh
CO2 Captured 852.3 gram CO2/kWh
CO2 avoided 660.8 gram CO2/kWh
Full Load Coal Feed 8808.75 GJ/hr
Fixed O&M (Non-fuel) 32.54 US$ million
Fixed O&M after Upgrade (non-fuel) 56.34 US$ million
Decommissioning Cost Equal to the salvage value
Tax 25% 20 years depreciation
7
Transportation, Storage & Monitor Cost 10 US$/TonneCO2e captured
Note: All results are presented in US$, and all assumptions in the model are base in Yuan with
6.5 Yuan/Dollar exchange rate.
The major technical and economic assumptions are shown in Table 3.1. The USCPC plant in this
7
The transportation cost estimate for Guangdong by Li et al (2013) for this project is US$ 10.2 to 16.3 / tonne
CO2 for a 8.8 million tonne annual capacity pipeline while the storage cost estimate is US$6.5 / tonne.
20study is assumed to start construction in early 2012 for three years and start operation in early
2015. CCS Ready design doesn’t cause energy penalty. When a plant is retrofitted, the efficiency
penalty (i.e. 8.4%) will be an important input to the economic study, which is obtained by the
ASPEN model developed by Li (2010). The required capital investment for retrofit and the
additional fixed O&M after retrofit refers to the cost of non-capture ready plant in IEA GHG
(2007) shown in Table 3.2. The total transportation, storage and monitoring costs are assumed to
be US$10/tonne CO2 captured. Increasing the load factor after retrofit is a possible method to
recover the revenue loss caused by the electricity penalty in capturing CO2 (Liang, 2010). In this
study, we assume the load factor is increased from 70% to 80% after retrofit. All assumptions are
in real terms and for 2010 constant prices.
Table 3.2 Assumptions for Plant Retrofitting Performance and Investment (IEA GHG, 2007)
(% of original plant before capture) Non-CCSR CCSR essential CCSR essential CCSR essential
with throttled LP design with design with
turbine floating LPT clutched LPT
Additional pre-investment 0.49% 0.74% 2.89%
Additional investment for later capture 23.58% 21.90% 21.85% 21.23%
retrofit
Non-fuel O&M costs after retrofit 73.15% 66.43% 63.73% 62.07%
Efficiency penalty Reduction after 11.64% 16.56% 19.71%
capture retrofit
3.3 Simulation Results
Under the scenario A where the plant is retrofittable without CCSR investment, the value of
essential CCSR with throttled low pressure turbine (LPT) is significant and equal to US$8.45
million (Table 3.3, Figure 3.1). The probability of retrofitting to capture would be increased by 5%
from 41% to 46%. The CCSR essential design with floating LPT design has the highest financial
benefit, $16.39 million, and it also significantly reduces the average cost of electricity by
providing a cheaper retrofitting option through a plant’s lifetime. The chance of retrofitting is
increased from 41% to 48%. CCSR essential design with clutched LPT has marginally higher
performance in retrofitting, but the much higher up-front cost meant that economic performance
was worse than for alternative CCSR designs.
In Scenario B where the plant is not retrofittable in the absence of a CCSR design, the value of
CCSR investment is $ 86.54 million for throttled LPT, while perhaps more important CCSR
would increase the chance of retrofitting from 0% to 46% during the plant’s lifetime (Table 3.3,
Figure 3.2). For the floating LPT CCSR design, the CCSR benefit would amount to $94 million
and the impact of CCSR on COE (Cost of Electricity 8 ) reaches US$1.4/MWh. The odds of
retrofitting to CO2 capture increases from zero to 48%.
8
COE (Cost of Electricity) is the levelised cost of electricity, i.e. the required electricity tariff to achieve breakeven
in a power plant’s lifetime.
21Table 3.3 Option Value of CCSR, Retrofitting Possibilities and the Impact on the Levelised Cost of
Electricity of Various CCSR Investments under Different Scenarios
Non CCSR essential with CCSR essential design CCSR essential design
CCSR throttled LPT with floating LPT with clutched LPT
Impact on COE* -1.09 -1.26 -1.40 -1.41
(US$/MWh)
Retrofitting Chance 41% 46% 48% 49%
Retrofitting Option
Value (US$: million) 78.09 89.65 99.17 99.73
CCSR Investment 3.11 4.69 18.32
(US$: million)
CCSR Benefit in
Scenario A 8.45 16.39 3.32
(US$: million)
CCSR Benefit in
Scenario B 86.54 94.48 81.41
(US$: million)
* COE – Cost of electricity.
Figure 3.1 Cumulative Distribution of Payoffs of Different CCSR Investments in Scenario A
22Figure 3.2 Cumulative Probability of Payoffs of Different CCSR Investments in Scenario B
Figure 3.3 Probability histogram of retrofitting years with and without CCSR Investment
23In this study, the driver of the retrofitting decision is assumed to be the carbon price 9 . Under our
assumptions, we found there is less than 1% chance to retrofit to capture each year on or before
year 10, and less than 0.1% chance to retrofit on or before year 6, without CCSR investment
(Figure 3.3). We found that CCSR would result in an earlier exercising of the retrofitting option:
with Floating LPT, the central retrofitting year is 17.1, 1.1 years earlier than Non-Capture Ready
18.2.
3.4 Summary of Findings
The modelling results shows CCSR has a number of benefits: (a) increases the probability of
retrofitting by 5% to 8%; (b) provides a NPV benefit of US$ 3.3 million to 16.9 million even if the
original plant is retrofittable without CCSR investment; and (c) for a base plant which cannot be
retrofit without CCSR investment, the value of CCSR could reach US$81 million to US$ 94
million. In addition, CCSR investment will lead to an earlier optimal retrofitting year. Our
modelling results show the average retrofitting year floating LPV is 1.1 year earlier than
non-CCSR investment. In addition, CCSR can significantly reduce the levelised cost of electricity
in a plant’s lifetime by through creating or enhancing the retrofitting options.
9
It cannot be ascertained whether or not carbon price, or some other instrument such as premium pricing for
CCS electricity, will be the driver for CCS in the future, but the general principles examined here are expected to
apply.
244. The CCS Ready Hub Concept
4.1 Definition and Background
In contrast with making an individual project carbon capture ready the ‘CCS Ready Hub’ is a
concept which requires implementation of CCSR at a regional level. Building a CCS Ready Hub
would not only require the CCSR design in new plants, but also assess the economics of
retrofitting existing power plants.
A limited number of studies are also available which investigated the planning issues for CCS
projects. Middleton and Bielicki (2009) developed a cost-minimizing system (SimCCS) for
integrated CCS projects. By demonstrating SimCCS on 37 stationary CO2 sources and 14
reservoirs in California, they found the importance of systematic planning for CCS infrastructure.
Their results show that the greatest cost saving is a well-connected network rather than the
economies of scale in pipeline construction.
Building on existing literature, this section aims to analyse the economics of financing CCS ready
in China at a regional level, with a case study of the Shenzhen area. Shenzhen city, a pioneer of
economic system reform in China during the late 1970s, is now identified as one of ten pilot low
carbon zones in China (NDRC, 2010). The city has a population of 8.9 million and a total of more
than 11 GW power installed capacity (including 3.8GW nuclear power).
4.2 Methodology
Two scenarios for CCS ready investment strategies are identified in Shenzhen city based on the
level of investment-decision: CCS ready at individual project and CCS ready through planning
authorities (‘CCS ready hub’) 10 . A cost cash flow model is then developed to assess the economics
of two CCS ready investment options. The valuation methodology is presented in Section Three.
We also suggest potential financial strategies and evaluate immediate interests in local
governments, power companies and oil companies for CCS ready investment and the CCS ready
hub idea. The cost profile of CO2 abatement for the whole city is assessed. The sequence in
building and operating deploying CCS facilities will follow the least cost principle. When
operating CCS facilities, those with the lower marginal cost of CO2 abatement are assumed to
have priority. The implementing process of simulation and analysis is highlighted in Figure 4.1.
10
There are some limitations due to data and resource constraint, the paper does not considered stationary
emissions sources in nearby cities, such as Dongguan, Huizhou and Hong Kong. Also, the potential of EOR is not
yet built in the model. The distribution of generators may affect the cost of CCS, but the paper does not consider
the structure of power grids in Shenzhen and Guangdong.
25Figure 4.1 Methodology to investigate financing issues of CCS ready
We apply a standard project cost cash flow model applied for assessing the capture readiness
investment. The cost cash flow of a power plant is composed of investment cash flow which
includes fixed and working capital, and the cost component of operating cash flow includes all
fixed and variable operating expenses. The cost of pipelines varies with the length, capacity, route
and other technical factors. The cash flow of storage includes the cost of injection and monitoring.
No tax and financing cash flow is assumed in cost cash flow analysis. The decision node
assumption of retrofitting is different from the study by Liang et al (2009), since we investigated
scenarios for retrofitting occurring in 2020 and 2025 respectively. Two existing coal and two
existing natural gas power plants are retrofittable. The baseline of CO2 emissions refers to the
emissions per kWh electricity generated before capture. The total CO2 abated is calculated by
multiplying electricity generation by the difference between emissions/kWh before and after
capture at individual plants. The cost cash flow for two CCS ready scenarios in Shenzhen city are
evaluated:
A. Consider making a 4 x 1000 MW new USCPC coal-fired power plant CCS ready and the
route of backbone pipeline in project planning
B. Consider making a 4 x 1000 MW new USCPC coal-fired power plant CCS ready and the
route of backbone pipeline in project planning and other stationary emissions sources in
Shenzhen
4.3 Assumptions
Existing thermal power plants include natural gas combined cycle, heavy oil, subcritical and
supercritical units. To evaluate the retrofitting potential, the remaining lifetime of these units are
assessed through discussions with plant operators, because their design lifetime may not be the
actual effective lifetime. For example, some operators of coal and natural gas plants claimed their
units can operate 5 to 10 years longer than the stated lifetime, but heavy oil plants will be closed
within the next 2 years, much earlier than the design life, because of high operating costs and SOx
emissions. The lifetime of new USCPC plants is assumed to be 30 years and the capture rate is
85%. The capital cost of a new USCPC plant is set at CNY4250/kW or US$685/kW ( while the
capital cost of retrofitting capture with CCS ready investment is assumed to be 60% of original
26capital cost or CNY2550/kW or US$411/kW (without capture).
The key factors considered in the model are listed in Table 4.1. We assume the capture retrofit cost
advantage of CCS ready according to Table 3.2, the essential CCSR with throttled low-pressure
turbine. The cost of building onshore pipeline in scenario A will be 25% higher than scenario B in
the future. Two existing coal-fired power plants and two existing natural gas power plants are able
to be retrofitted in 20 years time.
Table 4.1 Key issues considered in evaluating the cost of CCS ready
Existing Power Plants New Power Plants
Fuel type Fuel type
Location Location
Efficiency Efficiency
Total installed capacity Cost of CCS ready investment
Unit installed capacity Lifetime
Current utilization hours (load factor) Installed capacity
Future utilization hours (load factor) Estimated utilization hours
Retrofitting feasibility Expected average cost of retrofitting to capture
Remaining Lifetime Expected average retrofitting year
Expected average cost of retrofitting to capture Require rate of return (base plant, capture unit)
Expected average retrofitting year Flexibility in capture
Require rate of return (base plant, capture unit)
Flexibility in capture (if applicable)
Potential Transportation (Pipeline) Potential Storage site
Route options Type
Length Injection capital cost
Capacity Injection operating cost
Capital cost Monitoring cost
Operating cost Estimated schedule for EOR (if applicable) 11
11
According to the findings of CO2 Storage Study in this project (Zhou et al, 2011), there is very limit CO2
enhanced hydrocarbon potential in Guangdong and in South China Sea.
27Figure 4.2 Location of existing and planning power plants in Shenzhen city (Green: Existing Power Plants;
Yellow: in Planning)
The cost estimate of pipeline factors is based on the studies by McCoy and Rubin (2008), by Liu
and Gallagher (2011) and by the project team, Li et al (2013) 12 . However, in the Chinese context,
we also consulted offshore engineering companies and obtained cost estimates from local gas
network operators. We assume a backbone pipeline to transport CO2 from large stationary
emissions sources. Scenario A, which does not consider existing emissions sources, will only
require a 250km offshore pipeline, with a flow rate of 25 million tonnes pa (based on 85% CO2
captured). Scenario B, which does consider existing emissions sources, will require additional
onshore pipelines with a total length of 292km. The backbone onshore pipeline will be 69km with
a capacity of 18 million tonnes pa (based on 40% CO2 captured). The backbone offshore pipeline
will be designed at 43 million tonnes pa. Under both scenarios, the operational cost of the offshore
pipeline will be CNY22000/km pa while the cost of onshore pipelines is assumed at
CNY11000/km pa.
From the study by Wei et al (2010) and Zhou et al (2011), sufficient offshore storage capacity is
estimated to be available for CO2 storage in saline aquifers. The depth of the sea area is within 200
metres or less. The capital cost of injection is assumed to be CNY57 million or US$ 9 million in
scenario A, and CNY62million in scenario B according to estimates by oil field operation
companies in Shenzhen. The operational cost and monitoring cost in present value is assumed to
be CNY25 or US$4 per tonne 13 .
12
The study completed before the GDCCSR project cost estimates are available. Therefore the study
didn’t apply the output of GDCCSR cost estimates.
13
The assumption is consistent with and close to the sensitivity study of CO2 storage cost study (Li et
28Based on a study on required returns by financial officials, Reiner and Liang (2009) found that
stakeholders from public or development banks perceived that the required return for capture
facilities to be between 5% to 8%, but those at private banks required a return of 12% to 20% to
compensate for risk. To simplify, we apply a 12% capital charge factor in real terms for all capital
cost of capture, transportation and storage facilities.
4.4 Summary of Results
The simulation results show that CCS ready investment will reduce the average CO2 abatement
cost of CCS retrofit in 2020 by approximately 20% in Shenzhen area (Figure 4.3). In addition,
CCS ready scenario B (CCS Ready hub), which considers the retrofit potential for existing coal
and gas power plants and an optimised pipeline network, will have a significant cost advantage
when capture rises above 17 million tonnes of CO2 per year, compared with scenario A, in which
only 4GW of new coal plant capacity is CCS ready.
Figure 4.3 Average cost of CO2 abatement of 2020 CCS retrofit
The average cost of CO2 abatement rises when the total amount of CO2 avoided is above 17
million tonnes (Figure 4.4), because the remaining effective lifetime of existing plants will be less
than 20 years and the efficiency of existing plants is not as high as for new plants. The average
cost of transportation and storage are generally lower when the total amount of CO2 avoided is
higher. Figure 4.5 presents the marginal cost of CO2 abatement per million tonnes. The marginal
abatement cost found in scenario B is lower than scenario A in retrofitting existing coal or natural
gas power plants.
al, 2013), which found the lifetime CO2 storage cost at CNY34 or US$5 per tonne CO2 for a 26.4
million tonne CO2 storage per year scenario.
29You can also read