Adapting Existing Energy Planning, Simulation, and Operational Models for Resilience Analysis - NREL
←
→
Page content transcription
If your browser does not render page correctly, please read the page content below

Adapting Existing Energy Planning,
 Simulation, and Operational Models for
 Resilience Analysis
 Caitlin Murphy, Eliza Hotchkiss, Kate Anderson,
 Clayton Barrows, Stuart Cohen, Sourabh Dalvi, Nick Laws,
 Jeff Maguire, Gord Stephen, and Eric Wilson

NREL is a national laboratory of the U.S. Department of Energy Technical Report
Office of Energy Efficiency & Renewable Energy NREL/TP-6A20-74241
Operated by the Alliance for Sustainable Energy, LLC February 2020
This report is available at no cost from the National Renewable Energy
Laboratory (NREL) at www.nrel.gov/publications.

Contract No. DE-AC36-08GO28308
Adapting Existing Energy Planning,
 Simulation, and Operational Models for
 Resilience Analysis
 Caitlin Murphy, Eliza Hotchkiss, Kate Anderson,
 Clayton Barrows, Stuart Cohen, Sourabh Dalvi, Nick Laws,
 Jeff Maguire, Gord Stephen, and Eric Wilson

 Suggested Citation
 Murphy, Caitlin, Eliza Hotchkiss, Kate Anderson, Clayton Barrows, Stuart Cohen, Sourabh
 Dalvi, Nick Laws, Jeff Maguire, Gord Stephen, and Eric Wilson. 2020. Adapting Existing
 Energy Planning, Simulation, and Operational Models for Resilience Analysis. Golden,
 CO: National Renewable Energy Laboratory. NREL/TP-6A20-74241.
 https://www.nrel.gov/docs/fy20osti/74241.pdf.

NREL is a national laboratory of the U.S. Department of Energy Technical Report
Office of Energy Efficiency & Renewable Energy NREL/TP-6A20-74241
Operated by the Alliance for Sustainable Energy, LLC February 2020

This report is available at no cost from the National Renewable Energy National Renewable Energy Laboratory
Laboratory (NREL) at www.nrel.gov/publications. 15013 Denver West Parkway
 Golden, CO 80401
Contract No. DE-AC36-08GO28308 303-275-3000 • www.nrel.gov
NOTICE

This work was authored by the National Renewable Energy Laboratory, operated by Alliance for Sustainable
Energy, LLC, for the U.S. Department of Energy (DOE) under Contract No. DE-AC36-08GO28308. Funding
provided by a Laboratory Directed Research and Development investment at NREL. The views expressed herein
do not necessarily represent the views of the DOE or the U.S. Government.

 This report is available at no cost from the National Renewable
 Energy Laboratory (NREL) at www.nrel.gov/publications.

 U.S. Department of Energy (DOE) reports produced after 1991
 and a growing number of pre-1991 documents are available
 free via www.OSTI.gov.

Cover Photos by Dennis Schroeder: (clockwise, left to right) NREL 51934, NREL 45897, NREL 42160, NREL 45891, NREL 48097,
NREL 46526.

NREL prints on paper that contains recycled content.
Acknowledgments
 This analysis benefited greatly from thoughtful comments and suggestions from several
 colleagues who generously reviewed either the entire report or portions of it in draft form.
 The authors thank Mercy DeMenno from Bosque Advisors for Sandia National Laboratory,
 Wilson Rickerson from Converge Strategies, and Jordan Cox, Sean Ericson, and Daniel
 Steinberg from the National Renewable Energy Laboratory (NREL).

 This work was authored by the NREL, operated by Alliance for Sustainable Energy, LLC, for
 the U.S. Department of Energy (DOE) under Contract No. DE-AC36-08GO28308. This work
 was supported by the Laboratory Directed Research and Development (LDRD) Program at
 NREL. The views expressed in the article do not necessarily represent the views of the DOE
 or the U.S. Government. The U.S. Government retains and the publisher, by accepting the
 article for publication, acknowledges that the U.S. Government retains a nonexclusive, paid-
 up, irrevocable, worldwide license to publish or reproduce the published form of this work, or
 allow others to do so, for U.S. Government purposes.

 iv
This report is available at no cost from the National Renewable Energy Laboratory at www.nrel.gov/publications.
Executive Summary
 Resilience is a topic receiving much attention in relation to energy systems, with particular
 attention being paid to the supply of electricity. Within the context of the electricity system,
 definitions of resilience encompass holistic concepts that emphasize preparing for, absorbing,
 adapting to, and recovering from interruptions in electricity supply (White House 2013; DHS
 2013; Hotchkiss and Dane 2019; Watson et al. 2014; Stankovic and Tomsovic 2018). Recent
 research has focused on understanding the resilience of the electricity sector to a core set of
 disruptions, which reflects (1) the economy’s increased dependence on electricity, (2)
 multiple emerging threats to the system (e.g., severe weather, aging infrastructure,
 cyberattacks, and physical attacks), and (3) the rapid evolution of the electricity system in
 recent decades (National Academies of Sciences, Engineering, and Medicine 2017).
 However, disruptions that test the resilience of a system or community can result in large-
 scale consequences, as opposed to being constrained to a single sector or service type.

 As a result of the growing interest in electricity sector resilience, research communities have
 proposed a plethora of candidate resilience indicators and metrics, most of which remain
 immature at different scales and segments within the energy system. Given the complexity
 of resilience analyses and mitigation strategies, there is limited value in attempting to identify
 a single resilience metric, as no one metric can quantify resilience or its associated value for
 all stakeholders. Instead, a necessary focus of the research community should lie in
 implementing, testing, and validating resilience metrics and analysis approaches in energy
 sector models, which will be invaluable for informing resilience planning and investment
 decisions.

 Recognizing these challenges that need to be addressed, we explored how to effectively
 integrate resilience considerations into energy sector models and tools. The overarching
 goal of the effort was to evaluate the data needs, methodologies, and outcomes—including
 consequences and/or changes in investment or operational decisions due to avoided
 consequences—for resilience analysis in a range of existing tools. In particular, we selected
 five models—originally built at NREL to explore non-resilience energy research
 questions—in which to implement and exercise resilience metrics and analysis approaches.

 To demonstrate the importance of perspective, we selected models that represent different
 segments of the energy sector, geographic scales, and modeling approaches. The ultimate
 set of models selected spans simulations of building stocks and campus-level backup power
 systems, to the bulk power system across the contiguous United States. In addition, to
 explore different approaches for implementing a chosen resilience metric, we chose tools
 with very different modeling approaches, including (1) optimization for both long-term
 planning and electricity dispatch and (2) detailed simulations of energy system performance
 under adverse conditions.

 A second important aspect of our effort was the development of generalized power
 interruption scenarios. These scenarios were intended to help establish a framework for
 simulating the effects of real-world threats in terms of their impacts on system components
 and, in turn, power interruption. In this case, the term “threat” refers to something that could
 negatively impact a part of the energy system, and threats were defined based on variations
 across two dimensions: (1) whether system operators have time to prepare and (2) the
 duration of the associated power interruption.

 v
This report is available at no cost from the National Renewable Energy Laboratory at www.nrel.gov/publications.
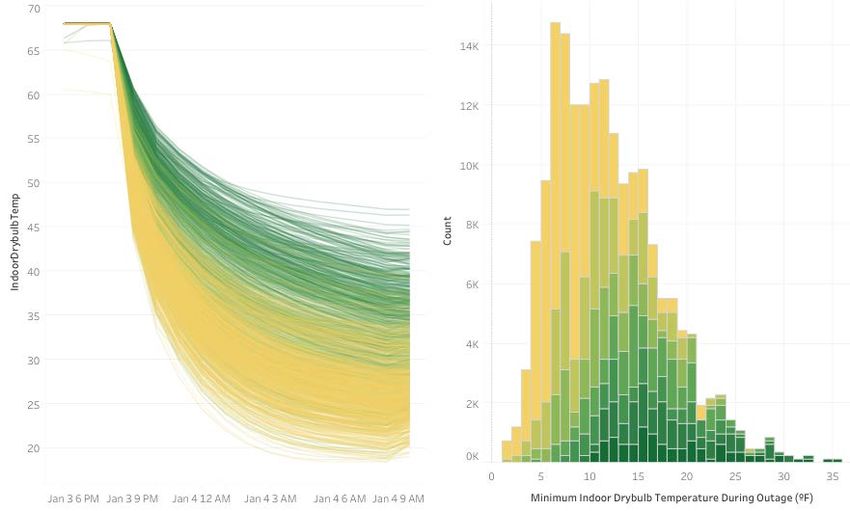
Based on their chosen resilience metric and power interruption scenario, each modeling team
 performed a preliminary resilience analysis. Similar resilience analyses could be replicated in
 future research that seeks to explore questions related to these preliminary results and
 findings, which are summarized here:

 1. The ResStock tool simulates energy use in housing stocks at national, regional, or
 local scales. Based on research completed under this study, ResStock can now
 simulate a power interruption, and it can evaluate the thermal resilience of the
 residential building stock during a power interruption that is coincident with adverse
 weather conditions. Initial results showed that more-efficient buildings tend to be
 more-resilient because they can maintain livable indoor temperatures longer during
 interruptions in the supply of electricity or natural gas.
 2. The Probabilistic Resource Adequacy Suite (PRAS) simulates outage events on
 the bulk power system to quantify the risk of unserved load events resulting from
 shortfalls in the supply or deliverability of capacity. Under this study, PRAS was used
 to evaluate how the deployment of energy storage on a regional grid could impact the
 resilience of the system during a multiday disruption of fuel supply for natural gas
 generators. Initial results showed that adding energy storage devices could reduce the
 depth of shortfall, as quantified by the expected unserved energy metric applied to a
 58-hour fuel supply disruption scenario.
 3. The Scalable Integrated Infrastructure Planning Power Systems Toolkit
 (SIIP::Power) provides a flexible framework for defining and solving power systems
 analysis problems, including a variety standard unit commitment and economic
 dispatch formulations. As a result of research completed under this study, SIIP::Power
 can now model a value of lost load that varies (a) over the duration of a power
 interruption and (b) by node. SIIP::Power uses this information to select which buses
 to serve at each time-step when there is not enough energy to serve all loads in order
 to minimize total system cost (including both outage and generation costs). Exercising
 the production cost modeling framework in SIIP::Power with this duration-dependent
 value of lost load results in operational differences, such that the total level of lost
 load (in megawatt-hours) is similar, but the overall system costs and the maximum
 hours of outage experienced by any bus on the network are reduced.
 4. The Regional Energy Deployment System (ReEDS) model is a bottom-up electric
 sector capacity expansion model for the contiguous United States that finds the least-
 cost construction and operation of generation, storage, and transmission assets
 through 2050. Under this study, ReEDS was modified to represent forced outage rates
 on the transmission system. Together with existing model capabilities, this
 preliminary resilience analysis involved five model constructs that were used to
 analyze ways to plan for resilience, based on the attribute-based metric of redundancy.
 Across the full suite of scenarios explored, initial results indicate that resiliency
 concerns can influence the optimal investment portfolio in different ways, depending
 on whether you are concerned about operating reserves, resource adequacy at peak
 loads, more-frequent generator outages, or more transmission outages.
 5. The Renewable Energy Optimization (REopt) is a techno-economic decision
 support model used to optimize energy systems for buildings, campuses,
 communities, and microgrids. Based on research completed under this study, the tool
 can now incorporate the avoided cost of a power interruption into the lifecycle cost
 calculation for backup power systems. Initial results indicate that accounting for the
 benefits associated with surviving all or part of a grid outage could change the optimal
 design of a backup power system. In particular, for scenarios that incorporate a “value

 vi
This report is available at no cost from the National Renewable Energy Laboratory at www.nrel.gov/publications.
of resilience,” the cost-optimal backup power system has increased PV capacity,
 energy storage duration, and net present value.
 Beyond these initially observed outcomes based on preliminary analysis efforts, each
 modeling team also identified how future research could improve the ability to explore
 energy resilience in more detail. Moreover, common findings from across our preliminary
 resilience analyses include:

 1. There is no one-size-fits-all metric, nor should one metric be deemed appropriate for
 implementation in all systems modeling. A multilayered metric system will be needed
 for resilience work and would be helpful for industry discussion and analysis at
 many scales.
 2. Our current understanding of what customers are willing to pay to avoid long-
 duration power interruptions is highly limited, and it could benefit from an improved
 understanding of (a) the duration-dependence of customer damages, (b) the influence
 of sectoral interdependencies, and (c) the relationship between impacts and
 consequences (e.g., degraded health, safety, and economic activity). There is
 significant uncertainty about whether these factors can be rigorously quantified.
 3. Accurately quantifying how a given resilience investment could lead to performance
 improvements (and, in turn, value) requires a more fundamental understanding of the
 relationship among a threat, its impacts, and the resulting consequences. An important
 area for future research is the development of methodologies for endogenously
 representing probabilities and a time-dependence for response and recovery activities
 in energy models.
 4. An alternative approach to modifying existing tools to enable them to effectively
 quantify and estimate the value of potential resilience investments would be to
 develop a new model specifically for energy sector resilience analysis. However,
 there are many challenges with such an approach.
 In summary, the research presented in this report was motivated by a growing need among
 energy industry stakeholders to evaluate the resilience of their systems to a variety of threats.
 In general, previous frameworks have outlined the steps needed to evaluate resilience, which
 can be summarized through linkages among a variety of research components. A perfect
 resilience analysis would involve detailed approaches for each individual component of the
 analysis. However, in an effort to avoid letting “great being the enemy of good,” it is often
 valuable to make simplifying assumptions for certain components of resilience analysis,
 while approaching others with a higher level of fidelity and granularity.

 Within the research community and energy industry, discussions often center on the need for
 detailed approaches to resilience metrics. However, such requests may only get at part of the
 ultimate need, as the utility of a metric depends strongly on the ability to evaluate it in a
 sophisticated and rigorous manner. In this study, we chose to approach resilience analysis by
 implementing simplified power interruption scenarios and resilience metrics in highly
 sophisticated simulation and optimization tools. To do so, we modified model inputs,
 constraints, and/or objective functions to capture the benefits associated with improved
 resilience, from a variety of stakeholder perspectives. Additionally, across the full suite of
 models, we quantified resilience in energy models designed to represent generation,
 transmission, capacity expansion, distributed energy resources, and energy end use. This
 research demonstrates the value associated with tradeoffs, which help ensure resilience
 analyses remain tractable for a diverse set of stakeholders.

 vii
This report is available at no cost from the National Renewable Energy Laboratory at www.nrel.gov/publications.
Table of Contents
 Executive Summary .............................................................................................................................. v
 1 Introduction ................................................................................................................................... 1
 1.1 Distinguishing Resilience from Reliability ............................................................................. 2
 1.2 Quantifying Resilience and its Value...................................................................................... 3
 1.3 Considering Resilience in Energy Planning............................................................................ 6
 2 Resilience Analysis in Energy Sector Models ............................................................................. 8
 2.1 Power Interruption Scenarios .................................................................................................. 8
 2.2 Energy Sector Models ........................................................................................................... 11
 2.3 Scenario Analysis.................................................................................................................. 11
 3 Adapting Simulation Models for Resilience Analysis .............................................................. 14
 3.1 ResStock ............................................................................................................................... 14
 3.2 Probabilistic Resource Adequacy Suite (PRAS)................................................................... 17
 4 Adapting Least-Cost Optimization Models for Resilience Analysis....................................... 20
 4.1 Scalable Integrated Infrastructure Planning: Power Systems Toolkit (SIIP::Power)............ 20
 4.2 Regional Energy Deployment System (ReEDS)................................................................... 23
 4.3 Renewable Energy Optimization (REopt) ............................................................................ 25
 5 Discussion..................................................................................................................................... 27
 6 Conclusions and Future Research Needs .................................................................................. 30
 References ............................................................................................................................................ 32
 Appendix .............................................................................................................................................. 36

 viii
This report is available at no cost from the National Renewable Energy Laboratory at www.nrel.gov/publications.
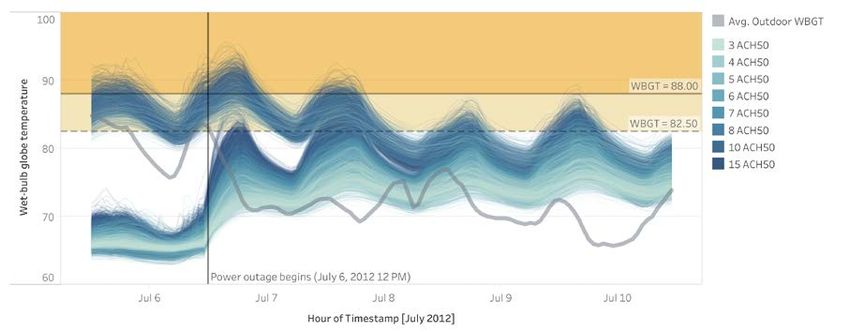
List of Figures
 Figure 1. Internal temperature trajectories (left) and distribution of minimum indoor temperatures
 (right) for buildings in Buffalo, New York, during a power interruption resulting
 from a hypothetical 12-hour ice storm, as modeled in ResStock..................................... 16
 Figure 2. Internal temperature trajectories for buildings in Chicago, Illinois, during a power
 interruption resulting from a heat wave, as modeled in ResStock ................................... 17
 Figure 3. Expected unserved energy across natural gas disruption scenarios with varying levels of
 energy storage capacity, as modeled in PRAS................................................................. 19
 Figure 4. Under degraded conditions, considering a duration-dependent value of lost load resulted in a
 modified system dispatch, which reduced outage duration at each bus and overall system
 costs, as modeled in the production cost model framework in SIIP::Power.................... 22
 Figure 5. Accounting for the value obtained by mitigating the power interruption experienced by a
 facility or campus resulted in a cost-optimal backup power system that is larger and
 incorporates longer-duration storage, as modeled in REopt. ........................................... 26
 Figure 6. Components of a comprehensive resilience analysis............................................................. 27
 Figure A-1. Sample SIIP::Power results, indicating that the cost of lost load varies with the duration
 of the outage .................................................................................................................... 38

 List of Tables
 Table 1. Qualitative Comparison of the Attributes of Reliability and Resilience-Testing Events ......... 2
 Table 2. Performance-Based, System-Level Metrics for Reliability and Resilience, Classified by
 Perspective and Type of Consequence .............................................................................. 5
 Table 3. Example Past Events for Representative Power Interruption Scenarios, Defined by
 Preparation Time and Power Interruption Duration ........................................................ 10
 Table 4. NREL Tools in Which Preliminary Resilience Analyses Were Performed ............................ 12
 Table 5. Model Constructs Used to Analyze Resilience Planning in v2018 ReEDS............................ 24
 Table 6. Summary of Preliminary Resilience Analyses in Existing NREL Tools ................................ 28

 ix
This report is available at no cost from the National Renewable Energy Laboratory at www.nrel.gov/publications.
1 Introduction
 Within the context of energy systems, definitions of resilience encompass holistic concepts
 that emphasize preparing for, absorbing, adapting to, and recovering from interruptions in
 energy supply (White House 2013; DHS 2013; Hotchkiss and Dane 2019; Watson et al.
 2014; Stankovic and Tomsovic 2018), which are often characterized by likelihood and
 impact. 1 In this study, we refrain from suggesting our own definition for the term resilience;
 instead, we focus on the characteristics of resilience-testing events that are most important for
 informing resilience planning and investment decisions. For example, disruptions that test the
 resilience of a system or community often result in large-scale consequences, which extend
 over multiple sectors, service types, and timescales.

 Recent research has focused on understanding the resilience of the electricity sector to a core
 set of disruptions, which reflects (1) the economy’s increased dependence on electricity, (2)
 multiple emerging threats to the system (e.g., severe weather, aging infrastructure,
 cyberattacks, and physical attacks), and (3) the rapid evolution of the electricity system in
 recent decades (National Academies of Sciences, Engineering, and Medicine 2017). The
 electricity sector is arguably more advanced in its consideration and assessment of resilience
 than other critical infrastructure sectors (e.g., water, oil and gas, or telecommunications;
 Willis and Loa 2015), but it is also more complex, exposed, and vulnerable to disruptions
 than many of those sectors. Moreover, there are interdependencies between infrastructure
 sectors to consider (DHS and DOE 2015; Judson 2013; EIS Council 2016), such as the
 reliance of water treatment and pumps on electricity supplied from the grid and the
 dependence of hydropower and thermal generators on available water supply.

 Power system modelers and operators have been challenged by resilience, including by how
 to measure the concept and how to apply metrics (Rickerson, Gillis, and Bulkeley 2019). A
 specific challenge is that while many metrics have been proposed, the implementation,
 testing, and validation of those metrics has been limited. In part, resilience metrics (in
 general) have only been validated to a limited extent because of the complexities associated
 with resilience-testing events, whose consequences depend on the timing, nature, magnitude,
 impacts, and extent of the realized threat. Moreover, individual metrics are only exercised
 sporadically because resilience analyses target only the most appropriate metric, which
 depends on a given stakeholder’s goals and perspectives. Beyond the validation of resilience
 metrics themselves, another prominent challenge lies in how resilience can be quantified,
 valued, and monetized, as well as how the value of resilience can be integrated into
 investment or operational decisions.

 In general, a resilience metric is a measurable quantity that can inform an entity’s broader
 risk management strategy through the quantification of a system or asset’s resilience under a
 range of natural hazards, intentional threats, and mitigation strategies. While many resilience
 metrics have been developed (Willis and Loa 2015; GMLC 2017)—primarily from the
 perspective of the electric utility—most proposed metrics are immature (Willis and Loa
 2015), and none is widely agreed upon (National Academies of Sciences, Engineering, and
 Medicine 2017; Keogh and Cody 2013; Willis and Loa 2015; Vugrin, Castillo, and Silva-
 Monroy; DOE 2016; Kintner-Meyer et al. 2016).

 1
 Select examples of power interruption characteristics include low- or high-probability; low- or high-
 consequence; small- or large-scale; and short- or long-duration events.

 1
This report is available at no cost from the National Renewable Energy Laboratory at www.nrel.gov/publications.
1.1 Distinguishing Resilience from Reliability
 Within the resilience metrics literature, there is agreement on the need for distinct metrics
 (or characteristics) that go beyond those established for the related concept of electricity
 system reliability (Table 1). Reliability is defined as the ability to “maintain power delivery
 to customers in the face of routine uncertainty in operating conditions” (Kintner-Meyer et al.
 2016), and it therefore reflects the inherent uncertainty associated with fluctuating load and
 generation, fuel availability, and outages of assets from different causes. Specific data,
 metrics, and valuation methods for electricity reliability are mature and widely adopted
 (GMLC 2017), and they all help inform the mandatory and enforceable reliability standards
 that are (a) developed by the North American Electricity Reliability Council and (b) reviewed
 and approved by the Federal Energy Regulatory Commission. Reliability is often considered
 in integrated resource and transmission planning processes and by regulators and markets
 (Kintner-Meyer et al. 2016).

 Table 1. Qualitative Comparison of the Attributes of Reliability and Resilience-Testing Events

 Attribute Resilience Reliability
 Event Low-probability, high-consequence, Uncertainty associated with
 Characteristics events that represent black-sky fluctuating load and generation, fuel
 operating conditions and apply stress availability, and outage of assets
 to a system over a large-scale under normal operating conditions
 Outage Duration Days to months Seconds to hours
 Spatial Extent Large geographic region (e.g., states, Concentrated area (e.g., one facility,
 regions, or islands) campus, or neighborhood)
 Economic Losses Losses arising from both lost load and Losses largely limited to unserved
 cascading impacts to the economya load for a subset of customersb
 Assets Impacted N–k c N–1, N–1–1
 State of Metrics Many immature metrics proposed; Mature, well-defined, reported
 none universally adopted metrics for the bulk power system
 (e.g., loss of load expectation,
 expected unserved energy) and
 electricity distribution system (e.g.,
 SAIDI, SAIFI, and CAIDI)d
 Example Entities None North American Electricity Reliability
 Responsible for Council, Federal Energy Regulatory
 Standards Commission, Public Utility
 Commissions, Institute of Electrical
 and Electronics Engineers
 Relevant Data Forward-looking modeling and Aggregation of historical records for
 simulations, with some insights from small-scale events over a given
 infrequent historical events period (e.g., one year)
 a Select examples of cascading impacts include business losses, community economic failures, and
 degraded water or natural gas delivery to customers as a result of a power.
 b Losses associated with dropped load reflect interruptions in services or operations for a limited time

 c An N–k contingency involves the near-simultaneous failure of a set of k critical components. Beyond

 resulting in a maximized power interruption, a key challenge in analyzing N–k contingencies lies in
 identifying which of the possible combinations of component failures are both likely and impactful.
 d For acronym definitions, see Table 2 (page 5).

 2
This report is available at no cost from the National Renewable Energy Laboratory at www.nrel.gov/publications.
The distinction between reliability and resilience is particularly important for system
 planning, cost recovery, and utility regulation. Utilities seeking to identify and invest in
 resilience solutions must be able to identify measures that either are unique to resilience or
 provide both resilience and reliability benefits. To recover capital costs for these types of
 investments, regulated utilities must be able to justify the additional costs within the context
 of system benefits (i.e., resilience improvements) for all customers. Reliability metrics and
 assessment methodologies can provide some helpful insights, but they likely undervalue the
 benefits associated with resilience improvements (Stockton 2014). Moreover, a significant
 fraction of utilities exclude outages caused by major events 2 when calculating their
 performance on reliability metrics (Eto et al. 2012; Keogh and Cody 2013; National
 Academies of Sciences, Engineering, and Medicine 2017), because the nature of costs from
 major events are different from those from minor events. 3 Because major events are most
 relevant for informing resilience investments, reliability metrics and assessments are likely
 insufficient for resilience cost-benefit analyses. In addition, the benefits of power sector
 resilience may expand within given timescales.

 Despite their important differences, reliability and resilience often overlap as concepts.
 Customers value both, and there are likely synergies between their mitigation approaches.
 In some cases, a measure can improve both the reliability and the resilience of a system
 (e.g., the relocation of critical equipment to higher elevations or less flood-prone locations).
 Therefore, considering them separately would likely result in suboptimal solutions, and
 regulators must be careful to avoid approving cost recovery for separate reliability and
 resilience investments that provide the same benefits. Co-consideration of reliability and
 resilience measures will help identify potential tradeoffs between reliability and resilience
 measures. For example, reinforced concrete poles could improve reliability through
 resistance to forest fires and wind damage, but they could reduce resilience (in terms of
 recovery type options after an event), as damaged concrete poles often take longer to
 replace (Watson et al. 2014; National Academies of Sciences, Engineering, and Medicine
 2017; Keogh and Cody 2013).

 1.2 Quantifying Resilience and its Value
 The literature is focused on quantifying resilience, which requires determining both (1) the
 quantity (or magnitude) of resilience needed and (2) its value to end users, communities,
 and/or governments. Universally agreed upon metrics and values for resilience are currently
 lacking, primarily because each quantity depends strongly on circumstances, goals, and
 perspectives. While electricity customers will experience similar impacts (i.e., loss of service)
 during multiple types of disruptive events, the specific impacts on the electricity system itself
 will vary based on the scale and duration of the power interruption; for example, hurricanes,
 cyberattacks, and long-term drought have different characteristics, consequences, associated
 scales, and repair and recovery costs and times.

 2
 According to the analysis that revealed this statistic, major events are “extraordinary power interruptions and
 are defined by a variety of criteria to differentiate them from routine power interruptions. There are several
 different definitions for major events. (See Eto and LaCommare 2008, Endnote Error! Bookmark not
 defined.). IEEE Standard 1366-2003 is a voluntary industry standard that articulates a consistent set of
 definitions and procedures for measuring and reporting distribution reliability information, including a
 heuristically-derived and statistically- based definition of major events.” (Eto et al. 2012)
 3 Estimates in the corresponding references range from 25% to 50% of regulated utilities and up to two-thirds of

 public power utilities, based on responses to surveys regarding the reporting of reliability metrics.

 3
This report is available at no cost from the National Renewable Energy Laboratory at www.nrel.gov/publications.
Resilience metrics must reflect the underlying resilience goals, the diverse array of which
 depends on perspective and encompasses the broad definition of resilience. The primary
 resilience goal of an electric utility may focus on rapid recovery of the system as a whole
 after an extreme event. However, community leaders may focus on providing essential
 services, as well as the unforeseen consequences of a large-scale, long-duration event, such as
 the interdependencies of electricity service with other essential services (e.g., water, natural
 gas, and telecommunications). In turn, the corresponding metrics associated with these goals
 are related but inherently different (Table 2).

 Several approaches have been developed in which metrics are developed and evaluated in
 order to quantify resilience, including the Resilience Analysis Process (Vugrin, Castillo,
 and Silva-Monroy 2017) and a matrix format for quantifying energy resilience (Roege et al.
 2014). Resilience metrics can be categorized as “attribute-based” or “performance-based.”
 Attribute-based resilience are “based on system characteristics and typically include
 categories of system properties that are generally accepted as being beneficial to resilience”
 (Watson et al. 2014); as a result, they tend to be implemented through qualitative
 measurements and processes that include systematic review. By contrast, performance-based
 resilience metrics “measure how well the system delivers on its intended purpose during and
 after the threat” (Watson et al. 2014); they tend to be data-driven, and they have been
 implemented for both postmortem and prescriptive analyses.

 For quantitative analysis, it is preferable to use performance-based metrics that consider both
 likelihood and consequence of a given event and its corresponding consequences, as well as
 temporal evolution of an event. The performance of the system is crucial to electric
 resilience, so the metrics highlighted in Table 2 are those that can be quantitatively evaluated
 through infrastructure performance (e.g., using energy sector models) (Vugrin, Castillo,
 and Silva-Monroy 2017).

 Quantitative, performance-based metrics and modeling are inherently forward-looking 4 and
 are particularly important for informing planning and investment efforts related to resilience
 solutions, as well as potential response and recovery activities (National Academies of
 Sciences, Engineering, and Medicine 2017). However, detailed quantitative resilience
 analysis is not always possible, because of data or analytical resource limitations. As a result,
 “attribute-based” metrics have been developed to reflect more-qualitative characteristics that
 describe what makes a system resilient (e.g., robust, adaptive, and flexible) (GMLC 2017).

 The most mature performance-based metrics have largely been developed for use at the
 utility or system levels (GMLC 2017). The sheer volume of individual resilience metrics that
 have been proposed (on the order of many tens of metrics) makes it difficult to summarize
 them, but categorizing resilience metrics helps simplify the discussion. The Grid
 Modernization Laboratory Consortium (GMLC 2017) summarized performance-based
 resilience metrics as falling into the following direct consequence categories: electrical
 service, critical electrical service, restoration, and monetary (Table 2). The distinction
 between the first two categories lies in the customers considered (i.e., all customers versus
 critical customers, such as those that provide emergency services), while the final two
 categories focus more on the timing and cost of recovery, largely from the utility perspective.

 4
 Given the infrequent nature of long-duration outages, forward-looking (or leading) metrics are likely more
 relevant than lagging metrics. However, it is worth noting that both lagging and leading metrics are typically
 used for reliability events, given that historical data for reliability events are widely collected and available.

 4
This report is available at no cost from the National Renewable Energy Laboratory at www.nrel.gov/publications.
Table 2. Performance-Based, System-Level Metrics for Reliability and Resilience, Classified by
 Perspective and Type of Consequence

 Perspective
 Reliability Metric [Units] Resilience Metric [Units] (Example of
 Organization Type)

 Customer minutes interrupted Customer-hours of outages [hrs.] or Utility
 (CMI) [mins.] load not served [kilowatt-hours, or kWh]
 Electrical Service (All and Critical)

 Customers interrupted [number Average number (or percentage) of Utility
 of customers] customers experiencing an outage

 System average interruption Critical customer-hours of outages [hrs.] Community leaders,
 frequency index (SAIFI) or load not served [kWh] Utility
 System average interruption Average number (or %) of critical Community leaders,
 duration index (SAIDI) customers experiencing an outage Utility
 [mins./customer]
 Customer average interruption Critical services (e.g., hospitals, fire Community leaders
 duration index (CAIDI) stations, and police stations) without
 [hrs./customer] power
 Customers experiencing Critical services without power for more Community leaders
 multiple interruptions (CEMI) than N hours (e.g., N > hours of backup
 fuel requirement)

 System average restoration Time to recovery [hrs.] Utility, Insurance
 Restoration and Monetary

 index (SARI) [min]
 Loss of utility revenue [$] Utility, Insurance
 Cost of grid damages [$] Utility, Insurance
 Cost of recovery [$] Utility, Insurance
 Avoided outage cost [$] Utility, Insurance
 Loss of assets and perishables [$] Insurance
 Business interruption costs [$] Insurance

 Thin vertical lines separate related metrics for reliability and resilience, and thick lines indicate
 separate metrics that fall under the same consequence category (far left column). Resilience
 metrics tend to be leading (i.e., forward-looking) in nature and can be focused on critical
 customers; reliability metrics can also be forward-looking, but they are often based on historical
 data that represent averages across multiple events and a given system. The table provides a
 qualitative comparison of select metrics for resilience and reliability events, but it is not meant
 to be comprehensive.

 For all categories, it is important to consider the dimensions across which the metric is
 evaluated and reported. For example, each of the electrical service resilience metrics in
 Table 2 could be evaluated as a final integrated value that summarizes system performance
 throughout the event (i.e., during the disturbance), in the wake of the disturbance, and
 throughout the restoration process. However, depending on your perspective and goals, the
 time-dependence of a given metric over the course of an event could be of interest (Panteli
 et al. 2017). For example, a utility might want to know the sequence of events, such as how
 rapidly the service level to all customers (or critical customers) was reduced, the minimum
 level of electrical service that was provided (and the duration over which that minimum level

 5
This report is available at no cost from the National Renewable Energy Laboratory at www.nrel.gov/publications.
occurred), how quickly service was restored, or the time evolution of lost revenue. Or, a city
 might be interested to know the time evolution over which critical services lost power, which
 would provide insights as to whether the loss of critical services was due to backup generator
 failures or an event duration that exceeded the ability for backup power to maintain power.

 A final and challenging step is translating impacts to consequences regarding societal
 welfare. For example, a long-duration power interruption would likely have direct effects on
 the health and safety of a community, due to the loss of critical community services (e.g.,
 hospitals, fire stations, or police stations). However, many factors inform this relationship.
 Accurately assessing the impacts of the outage itself also requires comparison against the
 relevant “baseline” health and safety of a community, which depends on highly localized
 demographic and intangible factors. A long-duration power interruption could also indirectly
 effect (or threaten) the health and safety of a community, such as through degraded national
 security (e.g., due to the loss of critical infrastructures or long-duration outages at military
 bases). Finally, a very important step lies in translating the consequences of a long-duration
 power interruption to the loss of human life, the “value” of which is highly controversial
 (Viscusi and Aldy 2003).

 1.3 Considering Resilience in Energy Planning
 Some insights into the costs of potential resilience measures have been reported by utilities
 engaged in resilience planning in the wake (or anticipation) of emerging threats. For example,
 following Hurricane Sandy in 2012, the Edison Electric Institute released a report
 summarizing “best practices with regards to hardening the distribution infrastructure and
 creating a more resilient system” (EEI 2014). The report serves as a useful resource for
 utilities by providing a menu of options for hardening and resilience measures at the
 distribution level, as well as their relative cost impacts, cost recovery mechanisms, and
 relevant state programs. Common mitigation measures include “undergrounding” of power
 lines, vegetation management, higher design and construction standards, and smart grid,
 microgrid, and advanced technologies, as well as planning and operational measures that
 improve recovery times (e.g., an increased labor force, standby equipment, and restoration
 materials). A similar summary that covered a wider array of threats and solutions provides
 a comparable list of common mitigation measures, but it placed greater emphasis on the
 growing importance of advanced meters, smart-grid technologies, cybersecurity measures,
 and probabilistic risk models (Finster, Phillips, Wallace 2016).

 For regulated utilities, investments are subject to the approval of the regulators who are
 responsible for evaluating the economics of such measures. Interviews with public utility
 commission staff found that requests for cost recovery or investments in resilience are
 typically included in general rate case proceedings, although little or no distinction is made
 between reliability and resilience. Moreover, while the cost of a given resilience measure is
 well understood (e.g., the costs of labor and materials to “underground” specific power lines),
 the resulting benefits are more difficult to assess, particularly because of a lack of supporting
 data (LaCommare, Larsen, and Eto 2017). 5 The types of data that would support the benefits
 associated with resilience measures are difficult to collect because of the time and types of
 events needed to demonstrate the value of resilience investments (e.g., 1,000-year flood
 events happen so infrequently that the benefits of mitigation measures associated with those
 events are difficult to quantify in a realistic time frame). In addition, demonstrating that a
 5Two primary reasons for this are the infrequent nature of this type of event (some of which have never
 occurred before) and the lack of a universal methodology for quantifying the cost of a given interruption
 (e.g., to residential or government customers).

 6
This report is available at no cost from the National Renewable Energy Laboratory at www.nrel.gov/publications.
local investment will provide benefits to the broader customer base is often challenging
 (Rickerson, Gillis, and Bulkeley 2019). These findings represent an important challenge for
 resilience investments, as the use of reliability metrics alone may be insufficient for guiding
 investments in mitigation strategies for more costly and higher-impact disruptive events
 (National Academies of Sciences, Engineering, and Medicine 2017; Keogh and Cody 2013).

 7
This report is available at no cost from the National Renewable Energy Laboratory at www.nrel.gov/publications.
2 Resilience Analysis in Energy Sector Models
 Recognizing that implementing, testing, and validating resilience metrics are challenges that
 need to be addressed, we dedicated staff and time to researching how to effectively integrate
 resilience considerations into energy sector models and tools. The overarching goal of this
 effort was to evaluate the data needs, methodologies, and outcomes—including consequences
 and/or changes in investment or operational decisions due to avoided consequences—based
 on resilience analysis in a range of existing tools. This section provides a brief overview of
 the underlying approach to achieving this goal, which includes defining generalized power
 interruption scenarios, identifying an appropriate range of tools, and performing and
 interpreting results from preliminary resilience scenario analyses.

 2.1 Power Interruption Scenarios
 The first step in our research effort was the development of power interruption scenarios,
 which were intended to help establish a framework for simulating real-world grid outages
 and their impacts on system components. In this case, the term “threat” refers to something
 that could negatively impact some part of the energy system, which we define them based
 on variations across two dimensions: (1) whether system operators have time to prepare and
 (2) the duration of the associated power interruption. These two dimensions were chosen to
 capture both the variation in the types of threats on a given system, as well as variation in
 the severity of events types.

 The resulting suite of power interruption scenarios were defined by the:

 • Forecast availability, in terms of preparation time before an event occurs: 0, less
 than 12, and greater than 12 hours
 • Duration of the power interruption: less than 12 or greater than 12 hours.
 These thresholds were chosen primarily based on existing model parameterizations, which
 include both day-ahead scheduling and real-time operations. In addition, they were developed
 with potential bulk power system performance impacts in mind, which can be classified as
 one of the following:

 • The bulk power system can serve all load but may need re-dispatch, commitment,
 or configuration.
 • Bulk power system generation capacity is sufficient, but the transmission network
 is compromised.
 • Both generation and transmission are compromised at the bulk power system level.
 While we did not define the power interruption scenarios based on a specific event type,
 Table 3 offers additional intuition by providing examples of causes that could lead to power
 interruptions with similar levels of advanced notice (i.e., time for preparation) and duration.
 As outlined in the Federal Emergency Management Agency’s Critical Infrastructure
 Protection Program (DHS 2018), 6 the three widely acknowledged categories for disruptive
 events to infrastructure performance are:

 • Human-caused disruptions could be related to a lack of maintenance, insufficient
 vegetation management programs, or adversarial acts, for example.

 6
 “Lesson Summary—Lesson 4: Managing Risk, FEMA,
 https://emilms.fema.gov/IS0921a/CIPP0104summary.htm.

 8
This report is available at no cost from the National Renewable Energy Laboratory at www.nrel.gov/publications.
• Natural hazards typically include weather related events (e.g., tornadoes, hurricanes,
 floods, storm surge, flooding, and ice storms) and earthquakes, among other hazards.
 • Technological failures could include equipment failures, or system malfunction that
 are due to poor design or overloaded lines, for example.
 These three categories are reflected in the examples provided in Table 3 (page 10). It is
 important to note that a power interruption’s duration cannot be generalized across all
 instances of a given event type. For example, one cannot know a priori whether the duration
 of a power interruption associated with a hurricane would be longer or shorter than that of a
 tornado; in each case, the duration will depend on the strength of the event, as well as on the
 magnitude and extent of its impacts (e.g., damage to critical grid assets). Similarly, a simple
 relationship does not currently exist between an event type and the recovery time associated
 with it, since this will depend on characteristics of the event itself, as well as on impacts on
 other critical infrastructure sectors (e.g., the inundation of roads that are needed for recovery
 effort). Instead, a power interruption’s duration is primarily a function of how a system
 performs against, and how quickly it can recover from an event.

 By contrast, the degree of advanced notice depends on the forecasting characteristics of a
 given threat type. Human-caused and technological threats typically occur with little or no
 warning, while natural threats inherently have different forecast availabilities, which inform
 both when the event will occur and when crews might be able to commence recovery
 activities. For example, earthquakes typically occur with little or no warning, whereas
 advanced notice before a wildfire, tsunami, regional storm, or tornado could range from
 minutes to hours (depending on proximity to the origination of the event). Other natural
 events, such as hurricanes or volcanic activity, can be reasonably forecasted many hours or
 days before the event. 7

 The general scenario definitions and examples provided in Table 3 are for the types of
 scenarios that energy models could consider and the dimensions that could be important
 to represent endogenously; however, additional research is needed to enable such
 representations. For example, data limitations inhibit the endogenous representation of
 response and recovery activities, which are a necessary component for informing the duration
 of a given power interruption. Recovery timelines may be a function of advanced notice,
 type, and timing of the threat of interest; available resources; and dependency (or
 interdependency) with other critical infrastructures. This limitation primarily represents
 a need for data to inform such a relationship, as the improved understanding could be
 translated into energy decision models in a variety of ways.

 Another important research area lies in the improved forecasting of extreme events,
 particularly for renewable energy resources. In general, increased advanced notice can
 improve the bulk power system operators’ ability to cost-effectively plan and prepare for
 a major event, thus reducing overall recovery times. In addition, considering spatial
 temperature forecasts and prior precipitation data can improve predictions for the availability
 of renewable generation resources during extreme events, thus removing surprise failures on
 the system.

 7
 More-chronic natural stressors on the energy system (e.g., drought) can have forecast availabilities of weeks
 to months or years; however, these stressors are often treated separately, as they do not represent acute threats
 to the energy system.

 9
This report is available at no cost from the National Renewable Energy Laboratory at www.nrel.gov/publications.
Table 3. Example Past Events for Representative Power Interruption Scenarios, Defined by Preparation Time and Power Interruption Duration

 Power Interruption Duration

 12 Hours

 None In December 2015, three electric grid control centers in eastern On July 27, 2017 a construction crew working on a replacement
 Ukraine were the subject of a cyberattack. Though the event was bridge in the Outer Banks of North Carolina severed a power cable;
 initially facilitated by spear-phishing tactics that were employed this caused an eight-day blackout during peak tourist season on the
 months in advance, the attackers ultimately shut down the grid Outer Banks, affecting more than 7,000 people.
 without any warning. While the duration of the power interruption
 was relatively short (on the order of hours), the attack had severe
 implications for the long-term operational levels of the system.

 12 In 2019, Hurricane Dorian neared the Florida coastline after In 2017, two Category 5 hurricanes, Irma and Maria, damaged Saint
 Hours devastating the Bahamas. Though the hurricane remained off the Croix, Saint John, and Saint Thomas in the U.S. Virgin Islands, as
 coast of Florida, it caused power outages in the state by blowing well as Puerto Rico and other smaller islands. Hurricane Irma hit the
 downed trees, vegetation, and debris into power lines. Given the U.S. Virgin Islands on September 6, with the eye passing over St.
 significant advanced notice afforded to Florida utilities, power was Thomas and St. John. On September 20, the eye of Hurricane Maria
 restored quickly, with Florida Power and Light reporting that the swept near St. Croix with maximum winds of 175 mph. The
 average customer’s power was restored in approximately one destruction the storms left on the islands — about 90% of customers
 hour. The utility cited their previous smart grid technology and lacked power in September — was at times overshadowed by the
 system hardening investments as key to avoiding outages and catastrophic devastation on neighboring Puerto Rico. About half of
 reducing restoration times for the 160,000 customers that did Puerto Rico’s more than three million people did not have electricity
 experience outages as a result of the storm (FPL 2019). 100 days after Maria cut across the territory.

 10
 This report is available at no cost from the National Renewable Energy Laboratory at www.nrel.gov/publications.
2.2 Energy Sector Models
 For this preliminary resilience analysis effort, we selected a range of models that represent
 different segments of the energy sector, geographic scales, and modeling approaches. The
 models we selected (Table 4) span simulations of regional building stocks and campus-level
 backup power systems, to the bulk power system across the contiguous United States. In
 addition, we chose tools with very different modeling approaches; in general, the selected
 models can be categorized as either (1) optimization models for both long-term planning and
 electricity dispatch (ReEDS, REopt, and SIIP::Power) or (2) detailed simulation models of
 resource adequacy for electricity supply (PRAS) and building stock performance (ResStock).

 The range of metrics that were implemented across the suite of models demonstrates the
 importance of stakeholder perspectives and model architectures when identifying the most
 appropriate resilience metric (Table 4). For example, the chosen metric in ResStock—which
 simulates energy use and thermal performance in the U.S. residential building stock—is
 intuitively based on the perspective of a building resident. Moreover, PRAS takes the
 perspective of an energy supplier, who is concerned with the possibility of unserved energy
 due to resource inadequacy. As a result, the resilience metric that was implemented in PRAS
 is the expected unserved energy. While this metric is typically used in reliability analysis, we
 found its application here to be appropriate because it was applied to a power interruption
 scenario that corresponds to a resilience-testing event (see Section 3.2).

 The selection of metrics based on stakeholders’ resilience goals may be informed by their
 available data and/or analytical capabilities. Therefore, another important consideration in
 selecting resilience metrics lies in the architecture(s) of available energy sector models,
 which is captured by the range of models included in our preliminary resilience analysis
 efforts. In particular, in contrast to the models discussed in the previous paragraph, the least-
 cost optimization models are formulated to minimize system costs, based on a variety of
 input assumptions and subject to multiple constraints. As a result, the chosen metrics in least-
 cost optimization more often take the form of a resilience “value,” or a measure of the
 damages incurred as a result of an interruption in electricity supply. The one exception is the
 chosen metric in ReEDS (Table 4), which is a long-term capacity expansion model. In this
 case, the modeling team chose to implement and evaluate an attribute-based metric (Section
 1.1.2), because of the model’s inability to represent localized short-term interruptions on the
 bulk power system.

 2.3 Scenario Analysis
 The remainder of this report presents results from our preliminary resilience analyses in
 existing NREL models. Each modeling team considered the proposed suite of power
 interruption scenarios and identified which ones could be adequately represented within their
 modeling framework. Among the candidate power interruption scenarios, each modeling
 team chose one to explore by attempting to understand the necessary methodologies, data,
 and resulting outcomes that could be evaluated (Table 4).

 11
This report is available at no cost from the National Renewable Energy Laboratory at www.nrel.gov/publications.
You can also read