Development of an alternative electric propulsion layout
←
→
Page content transcription
If your browser does not render page correctly, please read the page content below
Development of an alternative electric
propulsion layout
Dimensioning of the electric propulsion layout and
comparison with Polestar 2

Master’s Thesis in Product Development

MARIA OTTOSSON NORDIN
ANNA RYDIN

C HALMERS U NIVERSITY OF T ECHNOLOGY
Gothenburg, Sweden 2019-06-12
Department of Industrial and Materials Science
Master’s thesis 2019

      Development of an alternative electric propulsion layout

Dimensioning of the electric propulsion layout and comparison with Polestar 2

                   MARIA OTTOSSON NORDIN
                             ANNA RYDIN

               Department of Industrial and Materials Science
                Chalmers University of Technology
                        Gothenburg, Sweden 2019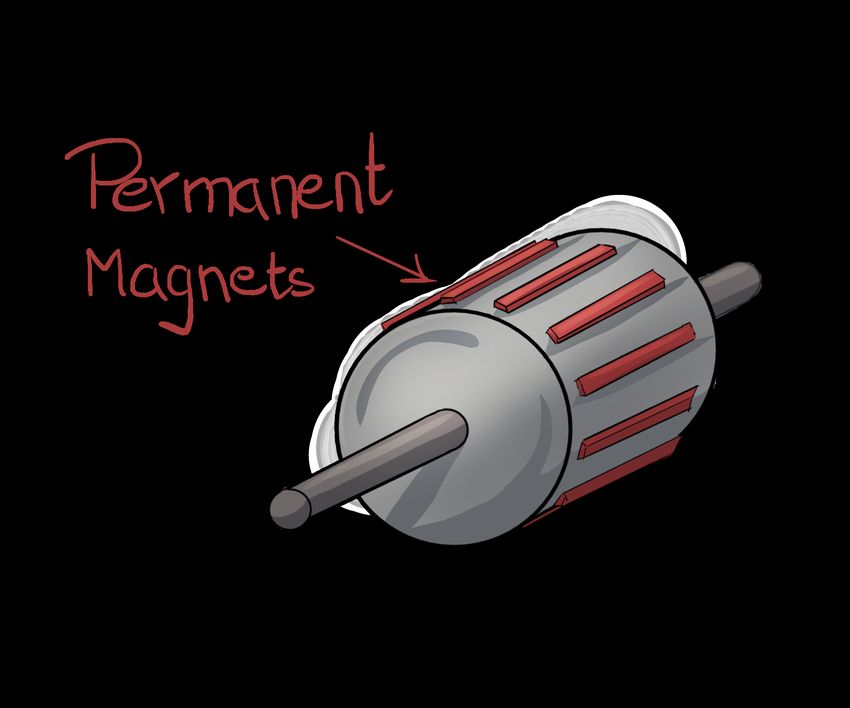
Development of an alternative electric propulsion layout
Dimensioning of the electric propulsion layout and comparison with Polestar 2

© Maria Ottosson Nordin and Anna Rydin, 2019.

Supervisor: Lars Stenvall, Volvo Car Group (VCG), Polestar
Supervisor: Johan Malmqvist, Chalmers University of Technology
Examiner: Johan Malmqvist, Department of Industrial and Materials Science (IMS)

Master’s Thesis 2019
Department of Industrial and Materials Science (IMS)
Chalmers University of Technology
Chalmersplatsen 4, SE-412 96 Gothenburg
Telephone +46 31 772 1000

Cover: CAD-model. Credit: Lars Stenvall.

Typeset in LATEX
Printed by Reproservice
Gothenburg, Sweden 2019

iv
Abstract

One of the challenges of the automotive industry is the transformation from combus-
tion vehicles to electric propulsion, through optimisation of the vehicle architecture
for batteries and electric machines to develop the cars of tomorrow. Today’s car
OEMs within the premium segment seem all to follow the same trend; to increase
the number of electric machines when increasing car performance. In collaboration
with Volvo Car Group, this Master’s Thesis has been conducted to dimension and
compare an alternative electric propulsion layout utilising one electric machine in
combination with a conventional AWD system, with the industry standard layout
represented by Polestar 2. The two layouts have been compared regarding acceler-
ation capacity and range, followed by a cost and weight analysis.

Initially an extensive literature study was carried out to understand the basic the-
ory behind important components of the battery electric propulsion layout. Sub-
sequently, a technology analysis was conducted including a competitor benchmark
resulting in the identification of the industry standard propulsion layout for premium
battery electric vehicles. Polestar 2 was confirmed to be a suitable representation
of the industry standard.

The alternative propulsion layout was dimensioned by the means of Matlab simu-
lations, focusing on the electric machine, which resulted in a similar performance
in terms of range and acceleration compared to Polestar 2. Comparing the cost
and weight of the systems resulted in a 4 % decrease in cost and a 3 % decrease
in weight with the alternative propulsion layout. Thus, the new propulsion layout
was concluded to be a cost and weight efficient alternative to the industry standard
layout.

Keywords: BEV, electric, propulsion

                                                                                    v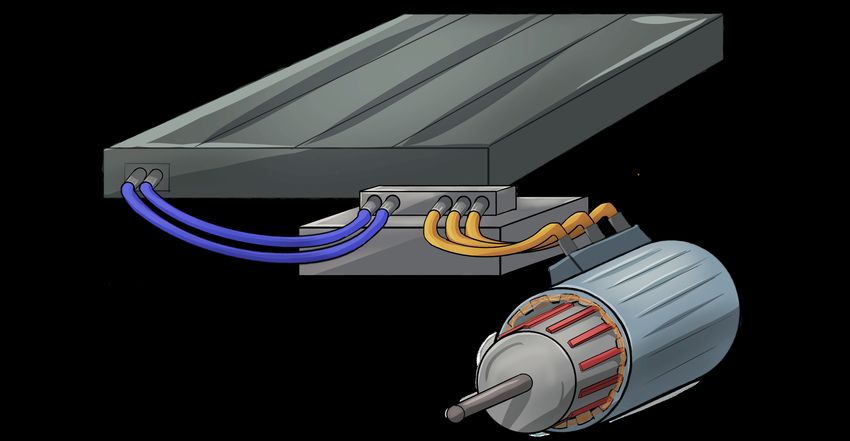
vi
Acknowledgements

And so the day was here. Five years at Chalmers University of Technology are
wrapped up and finalised with the Master’s Thesis. We are grateful to have been
given the opportunity to write our Thesis at Volvo Cars and Polestar. It has been
a challenging and fun experience where we have learnt a lot. Viewing the findings
we have at hand we can humbly conclude that this work would not have been
accomplished without the expertise and support from other people. We would like
to send our warmest thanks to everyone who has been contributing to this project.

Some people have had extra involvement and importance for this Master’s Thesis.
Lars Stenvall, not only have you been the creator of the conceptual idea behind
the whole project but you have also taken your time to support and help us in any
possible way. Always with an optimism and interest we have never seen before.
We could not have asked for a better supervisor. Tomas Åhlen, we are grateful for
having been welcomed to your group.

Professor Johan Malmqvist, our examiner and supervisor, your feedback has both
helped us to improve our report and opened up our eyes for how to visualise results
in an intuitive way. Your guidance have helped us to keep on track all the way.

Bengt Noren, your help with navigation in the jungle of calculation methods has
meant a great deal to us. The combination of valuable information and fun has been
unbeatable. Professor Torbjörn Thiringer, your expertise in electric machines and
inverters along with your helpful spirit have been invaluable for us and the project.
You have been a true inspiration source for us when it comes to electrification. Viktor
Briggner, Kim Bergsro and Mathias Jörgensson, your helpfulness and patience with
all our questions have been very much appreciated.

Sara Miric-Smojver, we are impressed by your work as our opponent. You managed
to give us valuable feedback of how to improve our report as well as encourage us and
highlight good aspects. Lucile Boulainghier, Luisa Zlatoidska and Robin Söderblom,
your support and enthusiasm has been important for us.

Thank you!

Elvorna Gothenburg, 2019-06-12

                                                                                    vii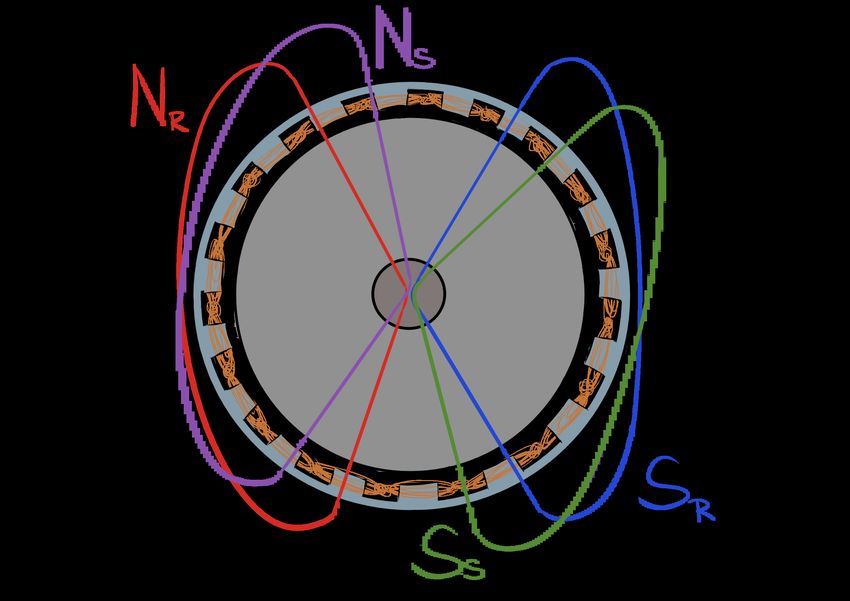
I will take this opportunity to thank my Master’s thesis partner Maria Ottosson
Nordin. I am so happy to have done this project with you. Apart from always
giving your all (which is a lot and more than one can ask for) for the project you are
a wonderful friend who supports when needed. Together we have fought with the
project, celebrated important milestones and have made this spring a great time.
We should be proud of what we have accomplished. I wish you all the best in future!

To my family, thank you from the bottom of my heart for your unconditional love.
You are nothing but the best! Karl, your support means the world to me.

Thank you!

Anna

I would like to dedicate a massive thank you to Anna Rydin, my amazing partner
in this Master’s Thesis. I remember when we worked together for the first time at
Chalmers, where I gained a talented colleague, but above all a really good friend.
With your drive and passion you have inspired me since day one. Through the ups
and downs, I have had so much fun doing this Master’s Thesis together with you!
And I agree, we should be proud of what we have accomplished. All the best wishes
in your future adventures. From one "Elva" to another, thank you!

I would also like to express my deepest gratitude to my family and my boyfriend
Viktor for their endless support. I love you!

Thank you!

Maria

viii
Acronyms

4WD Four-Wheel Drive. 13

AC Alternating Current. 6

AD Autonomous Drive. 2

ADAS Advanced Driver Assistance Systems. 2

AFM Axial Flux Machine. 10

AWD All-Wheel Drive. 5

BEV Battery Electric Vehicle. 1

CEO Chief Executive Officer. 28

DC Direct Current. 6

EFAD Electric Front Axle Drive. 7

ERAD Electric Rear Axle Drive. 7

EU European Union. 1

EV Electric Vehicle. 1

FDU Front Drive Unit. 36

FTO Freedom To Operate. 18

FWD Front-Wheel Drive. 14

                                             ix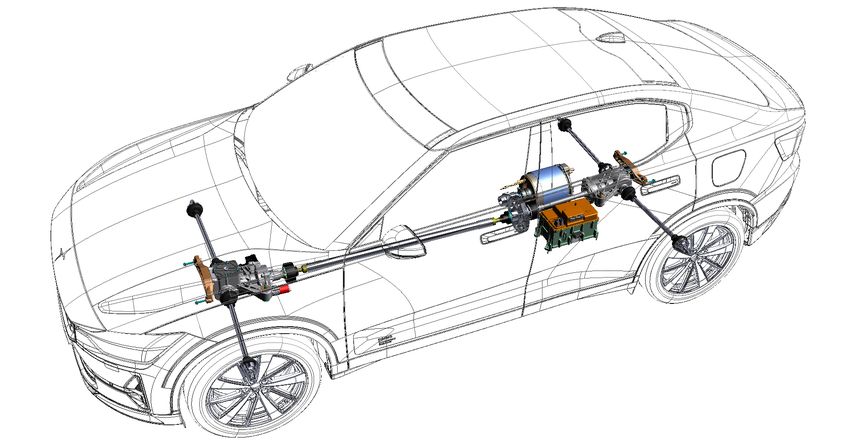
Acronyms

HEV Hybrid Electric Vehicle. 1

ICE Internal Combustion Engine. 1

Li-Ion Lithium-ion batteries. 15

NEDC New European Driving Cycle. 6

NVH Noise, Vibration, and Harshness. 30

OEM Original Equipment Manufacturer. 1

PHEV Plug-in Hybrid Electric Vehicle. 2

PM Permanent Magnets. 9

R&D Research and Development. 21

RDU Rear Drive Unit. 36

RFM Radial Flux Machine. 10

RMF Rotating Magnetic Field. 9

rpm revolutions per minute. 43

RWD Rear-Wheel Drive. 15

SUV Sport Utility Vehicle. 2

TRL Technology Readiness Level. 15

VCG Volvo Car Group. 2

WLTC Worldwide Harmonised Light-duty Vehicle Test Cycle. 37

WLTP Worldwide Harmonised Light-duty Vehicle Test Procedure. 6

x
Contents

Abstract                                                                                                                                     v

Acknowledgements                                                                                                                           viii

Acronyms                                                                                                                                     x

List of Figures                                                                                                                            xiii

List of Tables                                                                                                                             xv

1 Introduction                                                                                                                               1
  1.1 Background . . . . . . .         .   .   .   .   .   .   .   .   .   .   .   .   .   .   .   .   .   .   .   .   .   .   .   .   .     1
  1.2 Volvo Car Group . . . .          .   .   .   .   .   .   .   .   .   .   .   .   .   .   .   .   .   .   .   .   .   .   .   .   .     2
  1.3 Project background . . .         .   .   .   .   .   .   .   .   .   .   .   .   .   .   .   .   .   .   .   .   .   .   .   .   .     2
  1.4 Scope and Delimitations          .   .   .   .   .   .   .   .   .   .   .   .   .   .   .   .   .   .   .   .   .   .   .   .   .     3
  1.5 Goals and Deliverables .         .   .   .   .   .   .   .   .   .   .   .   .   .   .   .   .   .   .   .   .   .   .   .   .   .     3
  1.6 Report Structure . . . .         .   .   .   .   .   .   .   .   .   .   .   .   .   .   .   .   .   .   .   .   .   .   .   .   .     4

2 Theoretical Framework                                                                                                                      5
  2.1 Electric Vehicles . . . . . . . . .              .   .   .   .   .   .   .   .   .   .   .   .   .   .   .   .   .   .   .   .   .     5
  2.2 BEV Propulsion System . . . .                    .   .   .   .   .   .   .   .   .   .   .   .   .   .   .   .   .   .   .   .   .     6
  2.3 Components and their Function                    .   .   .   .   .   .   .   .   .   .   .   .   .   .   .   .   .   .   .   .   .     7
      2.3.1 Electric Machine . . . .                   .   .   .   .   .   .   .   .   .   .   .   .   .   .   .   .   .   .   .   .   .     8
      2.3.2 Inverter . . . . . . . . .                 .   .   .   .   .   .   .   .   .   .   .   .   .   .   .   .   .   .   .   .   .    11
      2.3.3 Transmission Elements .                    .   .   .   .   .   .   .   .   .   .   .   .   .   .   .   .   .   .   .   .   .    12
      2.3.4 Disconnect Clutch . . .                    .   .   .   .   .   .   .   .   .   .   .   .   .   .   .   .   .   .   .   .   .    14
      2.3.5 Battery Pack . . . . . .                   .   .   .   .   .   .   .   .   .   .   .   .   .   .   .   .   .   .   .   .   .    15

3 Methodology                                                                                                                               17
  3.1 Literature Study . .     .   .   .   .   .   .   .   .   .   .   .   .   .   .   .   .   .   .   .   .   .   .   .   .   .   .   .    17
  3.2 Technology Analysis      .   .   .   .   .   .   .   .   .   .   .   .   .   .   .   .   .   .   .   .   .   .   .   .   .   .   .    18
  3.3 Preliminary Design .     .   .   .   .   .   .   .   .   .   .   .   .   .   .   .   .   .   .   .   .   .   .   .   .   .   .   .    19
  3.4 Final Evaluation . .     .   .   .   .   .   .   .   .   .   .   .   .   .   .   .   .   .   .   .   .   .   .   .   .   .   .   .    19

4 Technology Analysis                                                         21
  4.1 Current BEV Environment . . . . . . . . . . . . . . . . . . . . . . . . 21

                                                                                                                                            xi
Contents
4.1.1 Benchmark . . . . . . . . . . . . . . . . . . . . . . . . . . . . 21
4.1.2 Polestar 2 Comparison . . . . . . . . . . . . . . . . . . . . . . 25
4.1.3 Patent Search . . . . . . . . . . . . . . . . . . . . . . . . . . . 27
4.1.4 Summary of the Current BEV Environment . . . . . . . . . . 27
4.2 Polestar 2 . . . . . . . . . . . . . . . . . . . . . . . . . . . . . . . . . 28
4.3 Polestar 2 Propulsion Layout . . . . . . . . . . . . . . . . . . . . . . 29
4.3.1 Electric Machine, Inverter and Transmission . . . . . . . . . . 29
4.3.2 Battery Pack . . . . . . . . . . . . . . . . . . . . . . . . . . . 30
4.4 Technical Specifications . . . . . . . . . . . . . . . . . . . . . . . . . . 30
5 Preliminary Design 33
5.1 Concept Description . . . . . . . . . . . . . . . . . . . . . . . . . . . 33
5.2 Technical Requirements . . . . . . . . . . . . . . . . . . . . . . . . . 33
5.3 Alternative Propulsion Layout . . . . . . . . . . . . . . . . . . . . . . 34
5.3.1 Components . . . . . . . . . . . . . . . . . . . . . . . . . . . . 34
5.3.2 Positioning and Placement . . . . . . . . . . . . . . . . . . . . 36
5.4 Dimensioning . . . . . . . . . . . . . . . . . . . . . . . . . . . . . . . 37
5.4.1 Machine . . . . . . . . . . . . . . . . . . . . . . . . . . . . . . 38
5.4.2 Range . . . . . . . . . . . . . . . . . . . . . . . . . . . . . . . 40
5.4.3 Acceleration . . . . . . . . . . . . . . . . . . . . . . . . . . . . 41
5.5 Cost and Weight Estimations . . . . . . . . . . . . . . . . . . . . . . 43
5.5.1 Cost Estimation . . . . . . . . . . . . . . . . . . . . . . . . . . 43
5.5.2 Weight Estimation . . . . . . . . . . . . . . . . . . . . . . . . 44
5.6 Sensitivity Analysis . . . . . . . . . . . . . . . . . . . . . . . . . . . . 44
6 Final Evaluation 45
6.1 11:an Propulsion Layout . . . . . . . . . . . . . . . . . . . . . . . . . 45
6.2 Comparison with Polestar 2 . . . . . . . . . . . . . . . . . . . . . . . 46
6.2.1 Architectural Design . . . . . . . . . . . . . . . . . . . . . . . 46
6.2.2 Performance Requirement Fulfilment . . . . . . . . . . . . . . 47
6.2.3 Cost and Weight Analysis . . . . . . . . . . . . . . . . . . . . 47
7 Discussion 51
7.1 Alternative Propulsion Layout . . . . . . . . . . . . . . . . . . . . . . 51
7.2 Goal Fulfilment . . . . . . . . . . . . . . . . . . . . . . . . . . . . . . 52
7.3 Validity . . . . . . . . . . . . . . . . . . . . . . . . . . . . . . . . . . 53
7.4 Reflection on Sustainability . . . . . . . . . . . . . . . . . . . . . . . 54
8 Conclusions and Recommendations 57
8.1 Conclusions . . . . . . . . . . . . . . . . . . . . . . . . . . . . . . . . 57
8.2 Recommendations and Future Work . . . . . . . . . . . . . . . . . . . 58
References 59
xiiList of Figures
1 BEV Propulsion System. Flow chart showing the propulsion system
of a BEV. [Own illustration]. . . . . . . . . . . . . . . . . . . . . . . . 7
2 Conventional BEV System Chart. Tree chart illustrating the hier-
archy of the BEV propulsion system, including EFAD and ERAD
subsystems. [Own illustration]. . . . . . . . . . . . . . . . . . . . . . 8
3 Stator and Rotor. Illustration of the rotor rotating inside the station-
ary stator. [Own illustration]. . . . . . . . . . . . . . . . . . . . . . . 9
4 RMF Illustration. Two RMFs, one on the stator and one on the rotor,
as a result of the attraction and repulsion of stator- and rotor- poles.
[Own illustration]. . . . . . . . . . . . . . . . . . . . . . . . . . . . . . 9
5 Rotor Comparison. The different rotor structures of the PM - and
induction - machines.[Own illustration]. . . . . . . . . . . . . . . . . . 10
6 RFM and AFM Comparison. Own illustration of the structure and
directional flux flow of the different machine categories, inspired by
the graphic illustrations on the Magnax website. . . . . . . . . . . . . 11
7 Inverter Relative Size. Own photograph illustrating the size of an
inverter from a current HEV in relation to a pen. . . . . . . . . . . . 12
8 Inverter Cabling. Own illustration of how the inverter is connected
to the machine and battery respectively, converting DC to AC. . . . . 12
9 Transmission Components. Illustrations of a bevel- and planetary-
gear, which are commonly used transmission elements in BEV- and
non-BEV- AWD-systems. Pictures retrieved from Wikipedia. . . . . . 14
10 Standard Open Differential. Illustration of the structure of a standard
open differential, acquired from Wikimedia Commons. . . . . . . . . . 14
11 Methodology. Presenting the process steps that has been followed to
conduct this project. [Own illustration]. . . . . . . . . . . . . . . . . 17
12 Benchmark Segment Representatives. From the left: BMW i3s Com-
fort Edition, Tesla Model 3 Long Range and Mercedes-Benz EQC 400
4MATIC. . . . . . . . . . . . . . . . . . . . . . . . . . . . . . . . . . 22
13 Medium/Large/Executive Cars. Comparative study of Polestar 2 and
its competitors within the corresponding car segment. [Own illustra-
tion]. . . . . . . . . . . . . . . . . . . . . . . . . . . . . . . . . . . . . 26
14 Polestar 2. Side view of Polestar 2, acquired from Polestar’s website. 28
xiiiList of Figures
15 Polestar 2 Propulsion Layout. Top view and side view of the Polestar
2 propulsion layout, acquired from Polestar’s website. The car front
is to the left. . . . . . . . . . . . . . . . . . . . . . . . . . . . . . . . . 29
16 The profile of WLTC. It is represented as a graph describing the
velocity as a function of time. The total cycle duration is 1800 s and
reaches a maximum velocity of 131.3 km/h. [Own graph]. . . . . . . . 37
17 Alternative Machine Dimensions. Presenting the generated machine
specifications and dimensions. [Own figure]. . . . . . . . . . . . . . . 39
18 Final Architectural Design. The final architectural design of the al-
ternative propulsion layout. Modelled by Lars Stenvall. . . . . . . . . 45
19 Propulsion Layout Comparison. The propulsion system layout of Po-
lestar 2 and 11:an in comparison. The top of the picture represents
the rear of the car. Modelled by Lars Stenvall. . . . . . . . . . . . . . 46
20 Component Cost Comparison with Polestar 2. Graph showing the
cost of the components of 11:an in relation to the corresponding com-
ponents in the layout of Polestar 2. [Own Illustration]. . . . . . . . . 49
21 Component Weight Comparison with Polestar 2. Graph showing the
weight of the components of 11:an in relation to the corresponding
components in the layout of Polestar 2. [Own Illustration]. . . . . . . 49
22 Cost Walk of 11:an. Graph showing the cost walk of 11:an comparing
the component cost in relation to the overall layout of Polestar 2.
[Own illustration]. . . . . . . . . . . . . . . . . . . . . . . . . . . . . . 50
23 Weight Distribution of 11:an. Graph showing the weight distribu-
tion of 11:an comparing the component cost in relation to the overall
layout of Polestar 2. [Own illustration]. . . . . . . . . . . . . . . . . . 50
xivList of Tables
1 General Benchmark Data. In the left column, car brands are lis-
ted followed by corresponding car model. Their acceleration, range,
weight, and price are given in the following columns. . . . . . . . . . 24
2 Motor Specific Data. In the left column, car brands are listed follow-
ing by corresponding car models. Subsequent columns present the
number of, type and position of, and drive type of the machine(s)
utilised in each car model. . . . . . . . . . . . . . . . . . . . . . . . . 25
4 Polestar 2 dimensions. In the left column the length of the car is
presented, followed by the height of-, the width of- (including mirrors)
and the wheelbase measurements. . . . . . . . . . . . . . . . . . . . . 30
3 Polestar 2 data. In the left column the components and subsystems
are stated, followed by their weight and cost. X and Y denotes the
total cost and weight of the system respectively. X1 and Y1 is the
cost and weight of EFAD, while X2 and Y2 is the cost and weight of
ERAD. Moreover the properties of the components and subsystems
are presented. . . . . . . . . . . . . . . . . . . . . . . . . . . . . . . . 31
5 Technical Requirements. In the left column the criteria is presen-
ted, followed by the target value and the level of requirement. Then
the weight of the desired criteria is presented along with verification
method and specifier. ta,P S2 represents the acceleration capacity of
Polestar 2 and DP S2 its range. X represents the total propulsion cost
of Polestar 2, and Y represents its total weight. . . . . . . . . . . . . 35
6 Cost Results. Showing the cost of the alternative propulsion layout
expressed as a proportion of the cost of the propulsion layout of Po-
lestar 2. X representing the total cost, x1 the cost of the machines,
x2 the cost of the inverters, x3 the transmission cost and x4 the cost
of the battery pack. . . . . . . . . . . . . . . . . . . . . . . . . . . . . 47
7 Weight Results. Showing the weight of the alternative propulsion
layout expressed as a proportion of the weight of the propulsion layout
of Polestar 2. Y representing the total weight, y1 the weight of the
machines, y2 the weight of the inverters, y3 the transmission weight
and y4 the weight of the battery pack. . . . . . . . . . . . . . . . . . 48
xvList of Tables xvi
1
                           Introduction

To understand the foundation of the project presented within this report, this
chapter aims at introducing the reader to the company- and project background,
along with the purpose of execution. Moreover, the scope and necessary delimit-
ations are presented, followed by goals and key deliverables. Finally, the report
structure is summarised.

1.1     Background
The World is presently facing enormous challenges regarding environmental issues.
The global warming is a hot topic discussed all around the globe in several contexts,
political as well as others. To stop the ongoing increase of the global temperature a
number of actions have been discussed and taken, many of them regarding CO2 and
other greenhouse gas emissions. According to the European Commission around
12 % of the CO2 emissions in the European Union (EU) come from cars. To reduce
the emission levels in EU a new target will be implemented stating that "by 2021 the
fleet average to be achieved by all new cars is 95 grams of CO2 per kilometre" [1].
Every automotive Original Equipment Manufacturer (OEM) exceeding the target
will be penalised with payment for every g/km above the target.

Another problem being discussed is air pollution, specially in big cities having prob-
lems with high amounts of harmful particles in the air. Now some cities and countries
have indicated that they will ban Internal Combustion Engine (ICE) vehicles in the
coming years or decades [2]. A pattern seen in many claims is to first introduce a
diesel restriction and then to follow up and ban all ICE cars.

The environmental aspects as well as the legislation around cars, are two strong
drivers for the automotive industry to develop technology for more sustainable means
of transportation. The introduction of the Electric Vehicle (EV) has been a usual
strategy among the car manufacturers and as a first step essentially all big OEMs
have launched at least one kind of Hybrid Electric Vehicle (HEV), providing syner-
gistic use of the two power sources of the ICE and an electric machine. The next step
seem to be the Battery Electric Vehicle (BEV), also called Fully Electric Vehicle, as
there today have been many announcements of BEVs coming in the near future.

While the electrification work is fully going on at some OEMs, others have different
strategies. E.g. Toyota has confirmed that they are not planning to launch any

                                                                                    1
1. Introduction BEV, instead they are focusing on, what they believe will be the next technology phase, hydrogen fuel cell cars [3]. Nevertheless, a lot is happening within the area of BEVs at the moment and most OEMs seem to take part of the race during this technology change. Apart from the car industry, the electrification of other vehicles such as trucks and buses is well under way [4]. A local example from Gothenburg is ElectriCity, a joint venture that is operating electric buses [5]. Progress is also seen in the electric boat and aircraft industries [6], [7]. 1.2 Volvo Car Group This Master’s Thesis has been performed in collaboration with Volvo Car Group (VCG), a car manufacturer within the premium segment offering models of sedan, station wagon, and Sport Utility Vehicle (SUV) types. VCG is to put one million EVs on the road by 2025. Both BEV and Plug-in Hybrid Electric Vehicle (PHEV) models will play a role in this commitment [8]. The company was founded by Assar Gabrielsson och Gustaf Larson as a subsidiary of the rolling-element bearing manufacturer AB SKF (Svenska Kullagerfabriken) in Gothenburg, Sweden. The name Volvo derives from the Latin "I roll" [9]. In 1927 the factory in Torslanda was opened and the first mass produced Volvo entered the roads. Volvo Cars was a part of AB Volvo until 1999, when it was sold to Ford Motor Company [10]. In 2010 Volvo Cars was bought by the current owner Zhejiang Geely holding (Geely Holding) [11]. Today VCG consists of Volvo Cars and five other businesses, all related to Volvo Cars. Polestar is an electric performance car brand, Care by Volvo offers a car subscription service as an alternative to owning or leasing a Volvo car, Zenuity are building Advanced Driver Assistance Systems (ADAS) and Autonomous Drive (AD) systems, M is a mobility company developing an on-demand service for cars, and Lynk & Co is a Chinese car brand [12], [13], [14], [15], [16], [17]. 1.3 Project background Today the automotive industry is facing great challenges. One of them is the trans- formation from combustion to electric propulsion, e.g. optimising the vehicle archi- tecture for batteries and electric machines to develop the cars of tomorrow. The electrification of cars was initiated over 100 years ago. Electric cars then competed with combustion cars for market share until the beginning of the 20th century, when combustion cars took over the market as they became more affordable and accessible compared to the electric car [18]. This caused the development of electric cars to halter. However, due to e.g. environmental aspects, the interest in and development of electric cars has accelerated in recent decades. 2
1. Introduction

In order to be competitive in the market, efficient electric propulsion layouts need
to be in place. This is where the Master’s Thesis will contribute. Today’s car
OEMs within the premium segment seem all to follow the same trend; to increase
the number of electric machines when increasing performance (acceleration capacity
and top speed). In addition, transmission elements and an inverter is needed for
each machine. By investigating an alternative propulsion layout with one machine
only, the aim is to reduce the weight and/or cost of the system, two important
parameters in the automotive industry that always are desired to be minimised.
Components included in the system investigated are the electric machine, inverter,
and transmission. However the result will affect other systems, like the battery pack.

1.4     Scope and Delimitations
This project investigates a given alternative propulsion system solution and dimen-
sions its including components. Further, with equivalent performance in terms of
range and acceleration, the weight and cost is compared with the industry typical
layout, represented by a reference BEV, Polestar 2. The alternative system layout
will be built on increased integration of functions which might contribute to a lower
weight. Also, the project aims in answering why the typical performance layout
includes at least two machines.

In order to focus the scope of the project, relevant delimitations associated with the
thesis work are set and presented below.

  • The initial concept layout, referring to an electric propulsion system for a car
    model, will be provided by the company supervisor.
  • The components included in the system to be compared are the machine,
    inverter, and transmission. Other systems, such as the battery pack, will be
    outside the scope for this project.
  • The dimensioned alternative electric propulsion layout will only be compared
    to Polestar 2.
  • The Master’s Thesis is not expected to investigate if the alternative solution
    is possible to be produced in the current factories.
  • The project will be limited in time. Two master students will spend approx-
    imately 20 weeks, corresponding to 800 hours each. The project will run from
    January to June 2019.

1.5     Goals and Deliverables
The main goals identified for this project are summarised as follows.

  • Performing a competitor benchmark describing the current standard propul-
    sion layout within the BEV premium car segment.
  • Mapping the current layout of Polestar 2, including crucial components and
    their function within the system.

                                                                                    3
1. Introduction
• Proposing an alternative BEV propulsion layout, where components are di-
mensioned based on a given system solution. Further, investigating the effi-
ciency of the proposed layout in terms of cost and weight.
• Comparing the efficiency of Polestar 2 with the proposed alternative layout
regarding cost and weight, given the same capacity in terms of range and
acceleration.
• Recommending actions to take regarding future development of the alternative
BEV propulsion layout.
Based on the presented goals, important deliverables of the project have been iden-
tified. A summary of which is presented below.
• Planning report to structure the thesis work.
• Summary of a benchmark study in order to build knowledge on the industry
standard layout and identify possible advantages and innovation potential.
• Summary of a pre-study in order to gather information on weight, cost, range
and acceleration properties of the propulsion layout of Polestar 2.
• Geometrical layout of the alternative system solution, with included compon-
ents dimensioned.
• Comparison of the alternative layout with the one of Polestar 2, in terms of
weight and cost, range and acceleration properties.
• List of positive and negative aspects for the alternative layout with respect to
Polestar 2.
• Conclusions based on facts and engineering judgement, whether or not the
alternative propulsion layout is more efficient, in terms of cost and weight,
compared to Polestar 2.
• Final Master’s Thesis report.
1.6 Report Structure
The report starts with an Introduction of the study, presenting the background from
a wide perspective of electrification in general followed by its presence within the car
industry, narrowing it down to application at VCG and in detail within the study.
In the next chapter the Theoretical Framework required to understand the context
of EVs is presented, focusing on the architecture of BEVs. Subsequently, the Meth-
odology process followed when conducting the project is described. The succeeding
chapter presents the Technology Analysis that has been carried out including a
benchmark study identifying the current BEV environment, an initial patent search
and mapping of the reference car, Polestar 2. In the Preliminary Design chapter the
alternative propulsion layout is presented and dimensioned, including positioning
and placement of components. Moreover the Final Evaluation is presented in the
following chapter, including a comparison with Polestar 2. The final two chapters
include Discussion of the result and use of methodology, followed by Conclusions
and Recommendations on further development.
42
Theoretical Framework
This chapter aims at providing the reader with a basic understanding of EVs today
and more in detail how the components of a BEV propulsion system are laid out.
Therefore, relevant theory is presented, starting with a general description of EVs
followed by an overview of the BEV propulsion system, including the energy trans-
fer between the components and how they work together to propel the vehicle.
Moreover deeper theory on how the components work individually are described to
indicate which are prioritised within this project and why. This theory includes
non-BEV components and systems as well, such as transmission components used
to achieve All-Wheel Drive (AWD), which are relevant to understand the alternative
propulsion layout developed in Chapter 5. Further, some theory on the calculations
and simulations that has been performed are discussed, to enrich the reader’s com-
prehension of the dimensioning and evaluation of the alternative propulsion layout.
Overall, the theory presented constitutes a knowledge base which facilitates a deeper
understanding when further reading the report.
2.1 Electric Vehicles
An EV is more or less propelled by electricity. There are different types of EV’s
on the market today, including fully electric vehicles and different levels of hybrid
solutions (HEVs and PHEVs). Hybrid solutions typically use electric machine(s)
and an ICE to propel the vehicle, while the BEV is powered solely by electricity
through the use of a battery pack [19]. Electric power accumulation in EVs allows
for regenerative braking which enables efficient usage of the ICE in HEVs, lowering
associated emissions. However, compared to a BEV the main source of power in a
HEV is still the ICE [20],[21]. Plug-in EVs are mainly charged by connecting a plug
to the electric power source, in addition kinetic energy can be regenerated through
braking [22]. The focus of this project is the BEV.
In the ongoing race of electrification in the automotive industry there are some para-
meters of extra importance as they are used as measurement when the players are
comparing one another. The parameters of highest priority are the ones that the
customers are valuing in their analysis when choosing a car.
Driving range, henceforth denoted range, is a criterion of high concern for both the
OEMs and the customers. Range anxiety [23] among potential buyers is one aspect
52. Theoretical Framework of it, which according to studies seems to be more commonly present among car owners not owning any BEV [24]. Essentially, the range can be described as the battery capacity minus losses, hence the battery capacity is the most important factor for the range. The losses are related to both vehicle design and driving style [25]. Parameters affecting the range are, e.g., the outside temperature, the usage of heating, air condition or other accessories in the car, the road profile, the speed, and the usage of the accelerator and brakes [26]. Further, the vehicle weight has an influence on the range [27]. Thus, comparing the specifications of two cars, the battery capacity in kWh does not give the full picture. In order to make a fair range comparison between two BEVs it is important to use the same drive cycle. There are a number of drive cycles and different markets have different standards of which one to use. In EU all new cars, since September 2018, have to be certified according to the Worldwide Harmonised Light-duty Vehicle Test Procedure (WLTP) drive cycle [28]. WLTP is tougher than the previous EU stand- ard New European Driving Cycle (NEDC), thus gives a shorter, more realistic, range [29]. Another important performance parameter is acceleration. The time to accelerate from 0 to 100 kmh can easily be compared between several car models. Whereas the range is a parameter discussed by more or less everybody, being a parameter of interest for all BEVs regardless of segment, the acceleration instead divides the models into different segments. For premium cars the acceleration is a factor con- sidered by the consumers and is important for the feeling of a powerful car when driving. In the automotive industry weight is a parameter to consider for every component in every project. Lighter vehicles are advantageous as they require less battery capacity, which in turn has a positive impact on the cost as the battery is a significant cost driver. In such a competitive market as the car industry the cost is super important as it has a great impact on the final price tag offered to the customers. Further, cost reduction is important for every company’s economical sustainability. 2.2 BEV Propulsion System The propulsion systems of EVs differ depending on the number and nature of their power source(s). In Figure 1 a schematic overview of the propulsion system of a BEV is presented. The battery pack transmits constant Direct Current (DC) to the inverter that converts it into Alternating Current (AC) that powers the electric motor. The electric motor then transforms the electric energy to mechanical energy through the transmission of torque. The rotation speed is then reduced by a set gear ratio transferring the torque onto the wheel axle. Moreover, energy recovery is possible through regenerative breaking, which is further explained in Section 2.3.2. A central part of the propulsion system is the electric machine, which mainly acts as a motor but periodically takes on the role of a generator, depending on the current 6
2. Theoretical Framework
Figure 1: BEV Propulsion System. Flow chart showing the propulsion system of
a BEV. [Own illustration].
driving mode. Further, the electric machine refers to motor/generator, while motor
and generator refers to the different modes respectively.
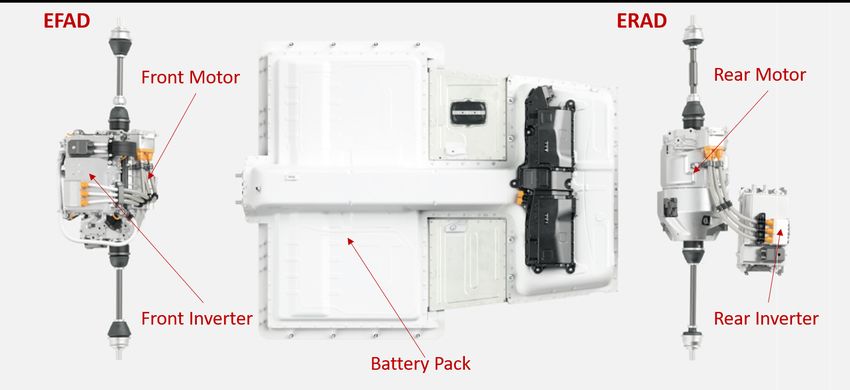
BEVs can be front-, rear- or all-wheel driven, depending on the specifications of the
vehicle. AWD systems are usually more expensive, because of the increased com-
plexity of the propulsion system. Within electric drive, front- and rear wheel drive
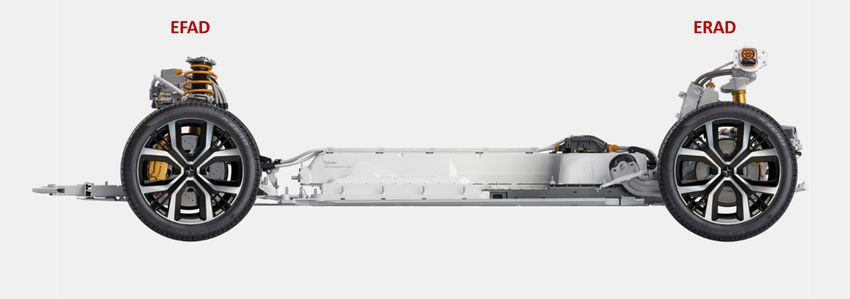
axles are denoted Electric Front Axle Drive (EFAD) and Electric Rear Axle Drive
(ERAD) respectively. Depending on the propulsion architecture, EFAD and ERAD
usually include the layout of the inverter, the electric machine and the transmission
component.
The system boundary in this Master’s Thesis is covering EFAD and ERAD, accord-
ing to Figure 2, including the inverter, machine, and transmission in both subsys-
tems. As can be seen, the propulsion system contains other subsystems, such as the
cooling system and battery pack. Those systems are all going to be more or less
affected by the alternative layout, but to what extent will not be investigated here.
In order to set the system to be compared into context Figure 1 can be helpful since
it shows the subsystems to which the energy is flowing from an to.
2.3 Components and their Function
Within this section, theory behind some of the basic components of the BEV propul-
sion system is presented; the electric machine, transmission elements, disconnect
clutch, inverter and battery pack. The summarised transmission theory also includes
conventional AWD transmission components as they are relevant for understanding
the alternative BEV propulsion layout.
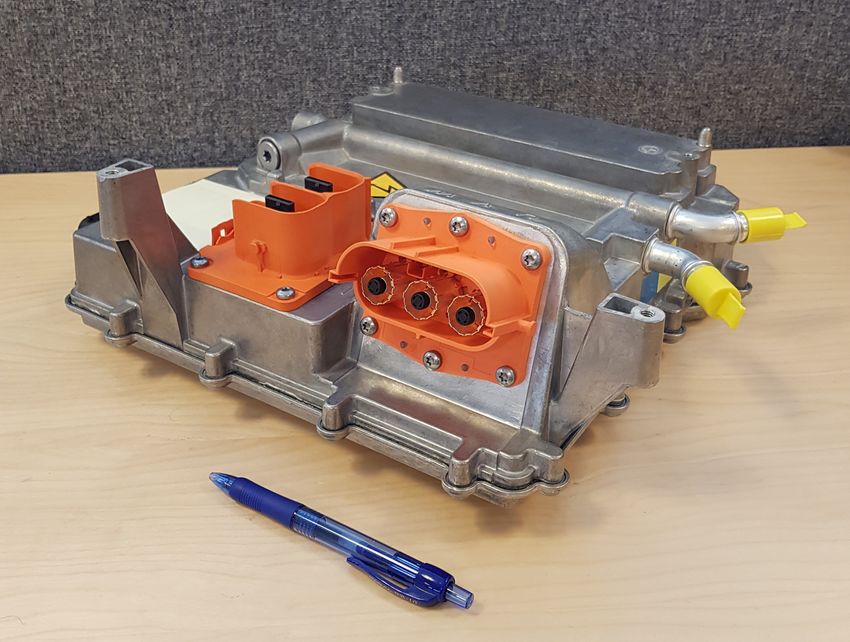
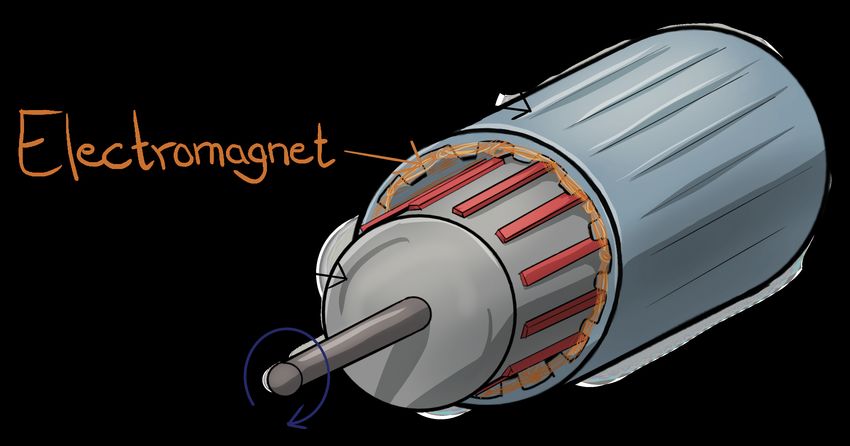
72. Theoretical Framework Figure 2: Conventional BEV System Chart. Tree chart illustrating the hierarchy of the BEV propulsion system, including EFAD and ERAD subsystems. [Own illustration]. 2.3.1 Electric Machine One of the driving elements in BEVs is the electric machine, further also denoted the machine, which is powered by electricity and consists of two basic elements; the stator and the rotor. The stator constitutes the stationary part of the machine, while the rotor is the rotating part, see Figure 3. Usually, the stator and the rotor are constructed differently depending on the machine type. The physical effect ex- ploited in the electric machine is magnetism [30]. When a conductor, e.g. the stator, is fed with current a magnetic field is initiated. Moreover, when another magnetic field is introduced, e.g. in the rotor, the interaction between them generates a force which causes the machine to operate [31]. Electric machines in commercial BEVs typically run on three phase AC, since the rotation speed is easily regulated by changing the frequency of the AC. Since the machine rotation speed is very fast it needs to be slowed down through transmission onto the wheel axle, in order to achieve an appropriate wheel torque and speed. DC machines require less control electronics, but are not applied to the same extent in BEVs because of losses caused by physical wear on their brushes and commutators [32]. Furthermore, there are synchronous and asynchronous AC machines, depending on how the rotation speed of the machine matches the frequency of the AC that comes from the inverter, which is another important component of the driveline further explained in Section 2.3.2. In a synchronous machine its rotation speed matches the frequency of the incoming AC, while in an asynchronous machine it does not [33]. If unloaded, the asynchronous machine will rotate with the same speed as the magnetic field of the stator and if subjected to a load the machine will experience a decrease in speed, which is called backlog. This backlog increases with the load, which in turn gives a higher machine torque. Thus, the speed difference between 8
2. Theoretical Framework

Figure 3: Stator and Rotor. Illustration of the rotor rotating inside the stationary
stator. [Own illustration].

Figure 4: RMF Illustration. Two RMFs, one on the stator and one on the rotor, as
a result of the attraction and repulsion of stator- and rotor- poles. [Own illustration].

the Rotating Magnetic Field (RMF) of the stator and the rotor determines the
machine torque. The larger the speed difference, the higher the torque. As for syn-
chronous machines, they are working at constant speed despite the load and if the
load exceeds the initiate power, the machine will be overloaded and simply stop [34].

The stator of a synchronous and asynchronous machine is built in a similar man-
ner. Usually it consists of copper winded coils constituting an electromagnet, whose
poles are constantly switching places as a result of the AC feed, causing a RMF
to occur. The rotor of a synchronous machine has magnetic poles made up by
Permanent Magnets (PM) generating a magnetic field. The magnetic poles of the
rotor chase the stator poles as they attract and repel each other making the ro-
tor turn [35]. Thus, the RMF of the stator causes the magnetic field of the rotor
to rotate resulting in two RMFs, see Figure 4. The PM machine is a commonly
used synchronous machine in EVs, because of its efficiency characteristics and its re-
latively small size. Though it generates magnetic losses that affect its efficiency [36].

                                                                                       9
2. Theoretical Framework
PM Rotor Induction Rotor
Figure 5: Rotor Comparison. The different rotor structures of the PM - and
induction - machines.[Own illustration].
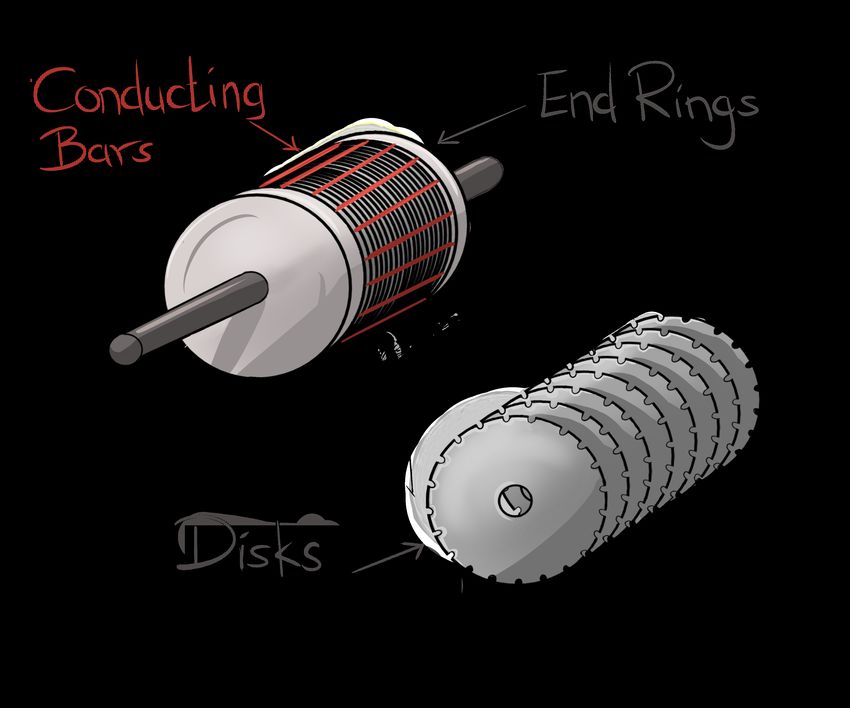
An example of an asynchronous machine is the induction motor invented by Nicola
Tesla in 1887. It was the first AC machine not using any brushes or PMs [37],[33].
Instead of using PMs and brushes, the rotor consists of conducting bars of e.g. alu-
minium in the shape of a squirrel cage, that are short circuited by two end rings.
The core of the rotor is made up by a set of disks e.g. of iron [38],[39]. Thus, both
the stator and the rotor constitutes electromagnets. The coils in the stator receives
three phase AC from the inverter, which generates a RMF as previously described.
In turn the RMF of the stator induces the bars of the rotor, creating a second mag-
netic field which makes the rotor turn. A comparison of the rotors of the PM- and
induction- machines, is presented in Figure 5.
In addition to the synchronous PM machine and the asynchronous induction ma-
chine, there are other machines used in EVs but to a lower extent. An example of
which is the switched reluctance machine whose torque, apart from the previously
presented machines, is determined solely by the magnetic attraction between the
stator electromagnets and the rotor varying reluctance areas [34].
The machines presented are examples of the Radial Flux Machine (RFM), meaning
that the direction of the produced magnetic flux is peripendicular the direction of the
rotor axis. In addition to the RFMs there is the Axial Flux Machine (AFM) where
the direction of the flux is axial and thus parallel the direction of the rotor axis.
The structure of the RFM constitutes e.g. an internal rotor and an external stator
as previously presented, while the structure of the AFM e.g. has one internal rotor
and two external stators, one on each side, or vice versa [40]. The AFM is said to
provide a higher power density compared to the conventional RFM, partly because
of its electromagnetic topology as the flux path is shorter in the AFM [41],[42]. An
illustration of the different structured machines including flux direction, is presented
in Figure 6.
102. Theoretical Framework
RFM AFM
Figure 6: RFM and AFM Comparison. Own illustration of the structure and
directional flux flow of the different machine categories, inspired by the graphic
illustrations on the Magnax website [42].
The number of electric machines in EVs typically vary, compared to combustion
vehicles that use one ICE. HEVs and PHEVs often use one ICE and one or more
electric machines, while BEVs only use one or more electric machines. A common
way of positioning the electric machine in any EV is coaxial to the drive axle, i.e.
transversal to the driving course. Compared to the ICE the electric machine is
effective within any speed range, which reduces the complexity of transmission onto
the wheel axle, i.e. there is no need for a multi-gear gearbox [38]. Important aspects
of the transmission elements utilised in BEVs is presented in Section 2.3.3.
2.3.2 Inverter
AC motors require elements to transform the DC from the battery to AC, which
normally constitutes inverters with powerful transistors to be able to withstand the
high current [33]. The powerful transistors generate heat and thus require effect-
ive cooling systems to function properly. Apart from converting the current, the
inverter acts as the brain of the electric machine, regulating the frequency of the
AC fed to the stator through intelligent software. To get an idea of the size of the
inverter, a picture of an example of an inverter from an existing HEV relative a pen,
is presented in Figure 7.
Acceleration is achieved by pressing down the acceleration pedal, causing the in-
verter to send out an increasing frequency AC to the machine activating its motor
function. Moreover, as the acceleration pedal is released, the frequency AC to the
machine is decreased and it starts to act as a generator instead. Thus it starts to
generate AC that the inverter converts back to DC, which in turn charges the bat-
tery pack [43]. This is what is referred to as regenerative braking in EVs. In addition
to converting the DC and controlling the frequency of the AC, the inverter can reg-
ulate the amplitude of the AC to control the power output of the electric motor [38].
As the machine in the propulsion system requires an inverter, the number of the
two components usually align. There are two main ways of installing the inverter,
as it can be integrated in the machine-housing or separate in its own housing [44].
112. Theoretical Framework Figure 7: Inverter Relative Size. Own photograph illustrating the size of an inverter from a current HEV in relation to a pen. Figure 8: Inverter Cabling. Own illustration of how the inverter is connected to the machine and battery respectively, converting DC to AC. The separated inverter can be mounted in various ways, which affect the cabling differently. To be able to remove the cabling between the inverter and the machine, the inverter has to be connected directly onto the machine, however the cabling between the inverter and the battery remains. If separeted, the inverter can be rigged offset the machine, resulting in cables between them and the battery respectively. An illustration of how the machine, inverter and battery are connected is presented in Figure 8. 2.3.3 Transmission Elements In most BEVs of today there is no gear shifting since there is one gear only. Hence in connection to the electric machine a fixed gear transmission still needs to be installed to match the speed of which the wheel axle rotates. An important trade-off when it comes to choosing gearbox is the balancing between acceleration and top speed. Many BEVs today use one-speed gears that facilitates high and constant torque from 12
2. Theoretical Framework
zero, which contributes to low weight, cost and volume. Fast acceleration typically
requires a higher torque at low velocity, and thus a lower gear, while fast top speed
instead requires a higher gear. Thus, to be able to achieve both effects, a two-speed
gear transmission needs to be installed [45].
ICE vehicles usually achieve AWD through the use of a propeller shaft and various
types of gears, to distribute the power to all wheels. There are AWD- and Four-
Wheel Drive (4WD) - systems, which are similar apart from 4WD-systems allowing
the driver to manually engage or disengage one of the wheel pairs [46],[47]. The
propeller shaft connects the front- and rear- wheel axles and is often parted and
supported in the middle when the shaft is long and/or heavy, to avoid excess vibra-
tion when it rotates which would otherwise have a negative effect on its durability
[48]. The two parts are typically connected through a rubber mounted bearing and
at an angle, neither too small nor too large, to further decrease wear and noise from
vibrations [49].
Another commonly used transmission element is the planetary gear, consisting of
three different wheel types, namely; a sun wheel, planet wheels and a ring wheel.
The sun wheel is located in the middle of the construction, around which the planet
wheels are rotating. They are connected to a movable element that accommodates
transferring the rotation onto e.g. a connecting axle. Moreover, the planet wheels
are kept in place by the outer element of the construction which is the ring wheel.
Hence, torque is being transferred from the sun wheel to the planet wheels [50].
Planetary gears are commonly utilised in connection to coaxially placed machines
to transfer the power to the wheels.
Further, bevel gears are common elements used in transmission systems within auto-
motive. They are shaped as cones, along the surface of which the teeth are located,
making them well suited for applications including intersecting shafts [51]. There
are different types of bevel gears and the angle of the cone can be adjusted depend-
ing on the application. Moreover, the teeth of the gear can be straight, spiral or
hypoid which gives different characteristics. With straight teeth the entire tooth is
engaged simultaneously, while in the case of hypoid teeth, only parts of the tooth are
engaged at the same time. Hypoid bevel gears are commonly used in differentials
[52]. An example of a bevel gear and a planetary gear is presented in Figure 9.
Differentials are other commonly utilised transmission elements in conventional driv-
elines. Two of their three main functions within the propulsion system include;
transferring the power to the wheel axles and reducing the gear one last time to
match the speed of the wheels. Yet the most important feature is their ability to
allow wheels on the same axle to rotate at different speed [55].
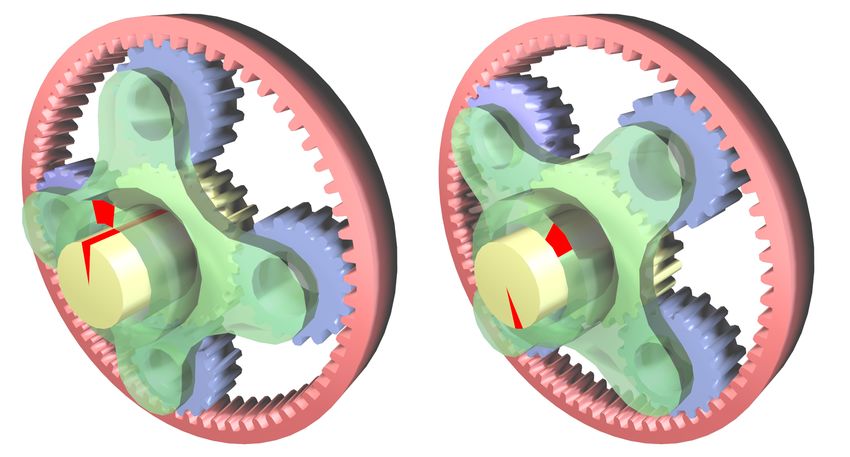
Differentials include a pinion gear, a ring gear, spider gear(s) as well as side gears
connected to the left and right drive shafts respectively, according to Figure 10. The
pinion gear (6), at the end of the pinion shaft (7), rotates along the ring gear (2),
while the spider gear (4) is mounted on the ring gear. When driving in a straight
132. Theoretical Framework
Bevel Gear Planetary Gear
Figure 9: Transmission Components. Illustrations of a bevel- and planetary- gear,
which are commonly used transmission elements in BEV- and non-BEV- AWD-
systems. Pictures retrieved from Wikipedia [53],[54].
Figure 10: Standard Open Differential. Illustration of the structure of a standard
open differential, acquired from Wikimedia Commons [56].
line the spider gears are locked in their position and the two side wheels (3) rotate
with the same speed, i.e. the left and right drive shafts (1) rotate with the same
speed. When turning, the spider gear starts to turn around its own axis resulting in
one side gear rotating faster and the other being slowed down and thus allowing the
two drive shafts, ergo the wheels, to rotate at independent speed [55]. The spider-
and side- gears are surrounded by a housing (5).
2.3.4 Disconnect Clutch
A clutch is a device located between two working elements, with the function of
engaging and disengaging them as needed [57]. Typically there are several types of
clutches with different functions placed in a propulsion system. For a car with more
than one machine installed, the disconnect clutch can disconnect the machine which
does not have to operate in the current driving mode. In a HEV the clutch can
disconnect the ICE whenever the electric machine is enough [58]. For a BEV, in-
stead, the clutch can disconnect one of the electric machines if one alone can provide
the required torque. In a BEV with two machines, one installed on the front axle
and the other on the rear axle, the AWD can be substituted by Front-Wheel Drive
142. Theoretical Framework
(FWD) or Rear-Wheel Drive (RWD), depending on which machine is the main drive
one. Moreover a disconnect clutch can engage or disengage one of the wheel axles
in a conventional, mechanical AWD system with one engine, when four wheel drive
is redundant.
2.3.5 Battery Pack
The energy in a BEV is stored in the battery package consisting of battery cells
connected to achieve a total voltage of about 400 V. Today most electric cars have
cuboid shaped battery cells, however, there are also solutions with many small cyl-
inder shaped battery cells similar to AA batteries [59].
A central issue for BEVs is the Technology Readiness Level (TRL) of batteries and
studies are ongoing in order to develop and improve them further. TRL refers to
the level of maturity of a certain technology [60]. Many different types of batteries
have been and are still discussed. The technology that seems most promising in
the nearest prospect is Lithium-ion batteries (Li-Ion), that exist in a number of
varieties. Design improvements and new materials are studied in order to increase
e.g. range and lifespan and to decrease cost [32].
152. Theoretical Framework 16
3
                          Methodology

In this chapter the methodology followed within this project is presented and mo-
tivated, focusing on means to conduct the initial literature study followed by the
technology analysis, dimensioning of the alternative propulsion layout and evalu-
ating the final architectural design. The purpose of which is to guide the reader
through the process and means of which the study has been carried out. An over-
view of the process that has been followed is presented in Figure 11.

Figure 11: Methodology. Presenting the process steps that has been followed to
conduct this project. [Own illustration].

3.1     Literature Study

Initially, a Literature Study was carried out to gather information on EVs and more
specifically, BEVs, including general information of EVs as well as specific informa-
tion of BEVs. The general structure of the BEV propulsion layout was established
whereby deeper knowledge on its components was obtained. Theory on different im-
plementations of components and their contribution to the function of the propulsion
system has been studied and summarised to provide sufficient understanding to lead
and follow the reasoning behind the development of the alternative propulsion lay-
out.

Moreover the collection of information has been conducted by the means of scientific
literature, including published articles and theses work. Even informative videos
e.g. illustrating the functionality of the different components of the propulsion
system layout, have been sources of information. Illustrations of theory results are
represented by drawings created using the digital painting app Krita Desktop [61].

                                                                                  17
3. Methodology 3.2 Technology Analysis Next a competitor benchmark has been carried out, as part of the Technology Ana- lysis, in order to map out the current BEV market and compare the reference car, Polestar 2, with its competitors. The benchmark has been conducted following the six steps presented in the method by Otto & Wood [62]. Relevant properties for com- parison were specified and researched through the utilisation of a number of different sources. To make a fair comparison between various car models could be complic- ated when the data is collected from separate sources. A2Mac1 and Caresoft are two external companies providing data of different car models [63],[64]. They should be objective in respect to different OEMs, hence they were made the sources of first pri- ority to the benchmarking when it comes to identifying competitors and gathering information on properties for comparison. Other assumed objective sources, such as car magazines, e.g. Teknikens Värld, have been used as priority two. Finally, when data has still been missing, the OEMs own web pages have been utilised. The data gathered was organised in an Excel [65] document and further analysed in terms of performance and segmentation. In addition to the benchmark, a patent search has been carried out to investigate the Freedom To Operate (FTO) with the alternative propulsion layout following the method presented by Haldorson [66]. Thus a clearance search was conducted to de- tect the presence of similar solutions and possible infringement on existing patents. The main tools utilised for this purpose was the smart and advanced search options of the database Espacenet [67]. Relevant keywords to be investigated include a combination of electric, powertrain, propulsion and layout. Mainly the category of mechanical engineering was consulted. For further investigation of similar solutions and possible infringement, a more extensive clearance search has been carried out through the help of VCG. Next the propulsion system layout of the reference car, Polestar 2, was mapped out and compared to other car models investigated in the benchmark. It was of importance to capture the knowledge existing at VCG, thus interviews with intern- als were conducted. People that have been taking part of the development of the propulsion system, having a good holistic view of it, as well as experts with deep technical knowledge have been answering questions and discussed different aspects of the project. The interviews have been managed in a semi-structured way, with a set of questions prepared in advance, but with a focus of keeping a dialogue and giving room for additional questions coming up along the way. The main outputs of the technology analysis include the identification of the industry standard propulsion layout regarding premium BEVs as well as the mapping and comparison of the Polestar 2 layout. The result of the data collection has been summarised in tables, see, e.g. Table 1. 18
3. Methodology

3.3     Preliminary Design
Within the Preliminary Design phase the alternative propulsion layout is developed
based on the originally formulated concept idea. Based on the identified perform-
ance parameters of Polestar 2, a technical requirements specification has been formu-
lated for the alternative propulsion layout. The technical requirements specification
presents the System, What criteria has been set, How they should be verified and
Who is the specifier [68]. The requirements have been updated as the development
of the alternative propulsion layout has proceeded and make up the foundation for
the comparison of the new propulsion layout and the one of Polestar 2.

Furthermore, based on the literature study results and the semi-structured inter-
views performed with technical experts within VCG, possible implementations of
the alternative propulsion layout have been discussed. These implementations in-
clude which components that can be used and how they can be placed and positioned
within the propulsion system, based on the wheelbase of the car.

The process of how the alternative propulsion layout has been dimensioned is then
presented, starting with the electric machine. An existing machine has been scaled
up and dimensioned in combination with the mechanical AWD transmission system,
with the ambition to match the performance level of Polestar 2. The calculations
used to assess the dimensions of the machine, the required power and torque, range
and so on, are described in detail within Chapter 5.4. All calculations have been
performed by the means of Matlab [69] simulations. Moreover, the range has been
calculated through WLTC simulations in Matlab. To enable a fair comparison, both
the propulsion layout of Polestar 2 and the alternative have been subjected to the
same simulations.

Following the dimensioning, a cost- and weight- analysis was performed on both
the propulsion layout of Polestar 2 and the alternative layout. The point of the
analysis is to evaluate the effect of the dimensioning work and enable comparison
between the two layouts. As information regarding cost and weight are confidential,
the properties of the alternative propulsion system has been assessed in relation to
Polestar 2. Conclusively, the main output of the preliminary design phase is an
extensive description of how the methodology has been applied in the case of this
study. Moreover, a minor sensitivity analysis has been carried out to evaluate the
robustness of the dimensioning.

3.4     Final Evaluation
After the process of describing how the alternative propulsion layout has been dimen-
sioned, it has been compared with Polestar 2 in the Final Evaluation phase. Based
on the results of the calculations and consultation with technical experts within
VCG, the final implementation of the alternative propulsion layout was established.
The final propulsion layout, henceforth denoted 11:an, has been compared to the

                                                                                  19
You can also read