Electrification Futures Study: Operational Analysis of U.S. Power Systems with Increased Electrification and Demand-Side Flexibility
←
→
Page content transcription
If your browser does not render page correctly, please read the page content below

Electrification Futures Study:
Operational Analysis of U.S. Power Systems with
Increased Electrification and Demand-Side Flexibility

Ella Zhou and Trieu Mai
National Renewable Energy Laboratory

Electrification Futures Study:
 Operational Analysis of U.S. Power
 Systems with Increased Electrification
 and Demand-Side Flexibility
 Ella Zhou and Trieu Mai
 National Renewable Energy Laboratory

 Suggested Citation
 Zhou, Ella, and Trieu Mai. 2021. Electrification Futures Study: Operational Analysis of
 U.S. Power Systems with Increased Electrification and Demand-Side Flexibility. Golden,
 CO: National Renewable Energy Laboratory. NREL/TP-6A20-79094.
 https://www.nrel.gov/docs/fy21osti/79094.pdf.

NREL is a national laboratory of the U.S. Department of Energy Technical Report
Office of Energy Efficiency & Renewable Energy NREL/TP-6A20-79094
Operated by the Alliance for Sustainable Energy, LLC May 2021
This report is available at no cost from the National Renewable Energy National Renewable Energy Laboratory
Laboratory (NREL) at www.nrel.gov/publications. 15013 Denver West Parkway
 Golden, CO 80401
Contract No. DE-AC36-08GO28308 303-275-3000 • www.nrel.gov
NOTICE

This work was authored by the National Renewable Energy Laboratory, operated by Alliance for
Sustainable Energy, LLC, for the U.S. Department of Energy (DOE) under Contract No. DE-AC36-
08GO28308. Funding provided by U.S. Department of Energy Office of Energy Efficiency and Renewable
Energy Office of Strategic Programs. The views expressed in the article do not necessarily represent the
views of the DOE or the U.S. Government.

 This report is available at no cost from the National
 Renewable Energy Laboratory (NREL) at
 www.nrel.gov/publications.

 U.S. Department of Energy (DOE) reports produced
 after 1991 and a growing number of pre-1991
 documents are available
 free via www.OSTI.gov.

Cover image from iStock 452033401.

NREL prints on paper that contains recycled content.
Preface
 This report is one in a series of Electrification Futures Study (EFS) publications. The EFS is a
 multiyear research project to explore potential widespread electrification in the future energy
 system of the United States. Electrification is defined as the substitution of electricity for direct
 combustion of non-electricity-based fuels used to provide similar services.

 The EFS is specifically designed to examine electric technology advancement and adoption for
 end uses in the major economic sectors of the United States, electricity consumption growth and
 load profiles, future power system infrastructure development and operations, and economic and
 environmental implications of electrification. Because of the expansive scope and the multiyear
 duration of the study, research findings and supporting data will be published as a series of
 reports, with each report being released on its own time frame. The table below lists the reports
 published to date from the series.

 Published reports to date from the Electrification Futures Study series
 1. Jadun, Paige, Colin McMillan, Daniel Steinberg, Matteo Muratori, Laura Vimmerstedt, and Trieu
 Mai. 2017. Electrification Futures Study: End-Use Technology Cost and Performance Projections
 through 2050. NREL/TP-6A20-70485.
 2. Mai, Trieu, Paige Jadun, Jeffrey Logan, Colin McMillan, Matteo Muratori, Daniel Steinberg, Laura
 Vimmerstedt, Ryan Jones, Benjamin Haley, and Brent Nelson. 2018. Electrification Futures Study:
 Scenarios of Electric Technology Adoption and Power Consumption for the United States.
 NREL/TP-6A20-71500.
 3. Hale, Elaine, Henry Horsey, Brandon Johnson, Matteo Muratori, Eric Wilson, Brennan Borlaug,
 Craig Christensen, Amanda Farthing, Dylan Hettinger, Andrew Parker, Joseph Robertson, Michael
 Rossol, Gord Stephen, Eric Wood, and Baskar Vairamohan. 2018. The Demand-Side Grid
 (dsgrid) Model Documentation. NREL/TP-6A20-71491.
 4. Sun, Yinong, Paige Jadun, Brent Nelson, Matteo Muratori, Caitlin Murphy, Jeffrey Logan, and Trieu
 Mai. 2020. Electrification Futures Study: Methodological Approaches for Assessing Long-term Bulk
 Power System Impacts of End-Use Electrification. NREL/TP-6A20-73336.
 5. Murphy, Caitlin, Trieu Mai, Yinong Sun, Paige Jadun, Matteo Muratori, Brent Nelson, and Ryan
 Jones. 2021. Electrification Futures Study: Scenarios of Electric System Evolution and
 Infrastructure Development for the United States. NREL/TP-6A20-72330.
 6. Zhou, Ella and Trieu Mai. 2021. Electrification Futures Study: Operational Analysis of U.S. Power
 Systems with Increased Electrification and Demand-Side Flexibility. NREL/TP-6A20-79094.
 [this report]

 This report, the sixth in the EFS series, presents a power system operational analysis of high
 electrification scenarios. The analysis includes detailed grid simulations of future 2050 power
 systems and electricity demand developed in earlier EFS reports, particularly the “demand-side”
 scenarios from Mai et al. (2018) and the “supply-side” scenarios from Murphy et al. (2021). This
 report also presents an analysis of the potential role and value of flexible load, using assumptions
 of demand-side flexibility described by Sun et al. (2020). The input data and assumptions for
 these studies were developed through a broad and rigorous stakeholder process during 2017-
 2018. They do not reflect targets on electric vehicle adoption or power sector decarbonization
 announced in recent years. More recent data and assumptions may yield different results, though
 the assumptions in the EFS high electrification and enhanced flexibility scenario are not far from

 iv
This report is available at no cost from the National Renewable Energy Laboratory (NREL) at www.nrel.gov/publications.
the more recent estimations. For example, initiatives supported by the U.S. Department of
 Energy are investigating the potential of greater demand flexibility in the buildings sector
 (Neukomm, Nubbe, and Fares. 2019). Nevertheless, the current study provides valuable lessons
 on power systems operations for a highly electrified future with expansion of flexible loads. By
 supplementing the previously published EFS scenario analysis with more detailed modeling, this
 analysis helps both validate the operational feasibility of some of the scenarios modeled in the
 previous studies and identify new insights.

 More information, the supporting data associated with this report, links to other reports in
 the EFS, and information about the broader study are available at www.nrel.gov/efs.

 v
This report is available at no cost from the National Renewable Energy Laboratory (NREL) at www.nrel.gov/publications.
Acknowledgments
 The Electrification Futures Study (EFS) is led by researchers at the National Renewable
 Energy Laboratory (NREL) but relies on significant contributions from a large collaboration
 of researchers from the U.S. Department of Energy (DOE), Evolved Energy Research, Electric
 Power Research Institute, Lawrence Berkeley National Laboratory, Northern Arizona University,
 and Oak Ridge National Laboratory. We would like to thank all EFS contributors for useful
 analysis, data, and input throughout the project.

 A technical review committee of senior-level experts provided invaluable input to the overall
 study, with some committee members sharing thoughtful comments to this specific report as
 noted on the following page. The committee members offered input throughout the study
 analysis period (from 2017 to 2020), the results and findings from this analysis and the broader
 EFS do not necessarily reflect their opinions or the opinions of their institutions. The technical
 review committee is comprised of the following individuals with affiliations listed as of 2020:

 Doug Arent (committee chair) Jonathan Hughes
 National Renewable Energy Laboratory University of Colorado Boulder

 Sam Baldwin Michael Kintner-Meyer
 U.S. Department of Energy Pacific Northwest National Laboratory

 Armond Cohen John Larsen
 Clean Air Task Force Rhodium Group

 Steve Clemmer Bryan Mignone
 Union of Concerned Scientists ExxonMobil Research and Engineering Company

 Laura Cozzi Granger Morgan
 International Energy Agency Carnegie Mellon University

 Francisco de la Chesnaye Patrick Riley
 Electric Power Research Institute GE Global Research

 Keith Dennis Joan Ogden
 National Rural Electric Cooperative Association University of California Davis

 Carla Frisch Laurie ten Hope
 Rocky Mountain Institute California Energy Commission

 Arnulf Grübler Susan F. Tierney
 International Institute for Applied Systems Analysis Analysis Group, Inc.

 Howard Gruenspecht
 Massachusetts Institute of Technology

 vi
This report is available at no cost from the National Renewable Energy Laboratory (NREL) at www.nrel.gov/publications.
This analysis benefited greatly from thoughtful comments and suggestions from several
 colleagues who generously reviewed either the entire report or portions of it in draft form,
 including:

 • Sam Baldwin, Paul Donohoo-Vallett, Sarah Garman, and Kevin Lynn (DOE)
 • Imran Lalani and Cara Marcy (EPA)
 • Gregory Brinkman, Wesley Cole, Brady Cowiestoll, Elaine Hale, Paige Jadun, Jeffrey
 Logan, Matteo Muratori, Caitlin Murphy, Gian Porro, and Laura Vimmerstedt (NREL)
 • Dallas Burtraw, Kathryne Cleary, Karen Palmer, and Jhih-Shyang Shih (Resources for
 the Future)
 • Steve Clemmer and Julie McNamara (Union of Concerned Scientists)
 • Oscar Serpell (University of Pennsylvania)
 We also thank Paige Jadun, Yinong Sun, and Caitlin Murphy for data support, Nathaniel Gates,
 Christopher Schwing for graphical support, Mike Meshek and Devonie McCamey of NREL for
 editing and communications support. Of course, any errors and omissions are the sole
 responsibility of the authors.

 Primary funding support for the EFS is provided by the DOE Office of Energy Efficiency and
 Renewable Energy Office of Strategic Analysis Team. We especially thank Paul Donohoo-
 Vallett (DOE) for his support and leadership throughout the EFS and for this report.

 vii
This report is available at no cost from the National Renewable Energy Laboratory (NREL) at www.nrel.gov/publications.
List of Acronyms and Abbreviations
 AEO Annual Energy Outlook
 BA balancing area
 CAISO California Independent System Operator
 CBECS Commercial Buildings Energy Consumption Survey
 DOE U.S. Department of Energy
 DSF demand-side flexibility
 EFS Electrification Futures Study
 EIA U.S. Energy Information Administration
 ERCOT Electric Reliability Council of Texas
 FRCC Florida Reliability Coordinating Council
 GW gigawatt
 GWh gigawatt-hour
 HOGR high oil and gas resource
 HVAC heating, ventilation, and air conditioning
 ISO independent system operator
 LDV light-duty vehicle
 LNG liquefied natural gas
 LOGR low oil and gas resource
 MISO Midcontinent Independent System Operator
 MTN Mountain Census Division
 MWh megawatt-hour
 NEMS National Energy Modeling System
 NERC North American Electric Reliability Corporation
 NG-CC natural gas-combined cycle
 NG-CT natural gas-combustion turbine
 NREL National Renewable Energy Laboratory
 NSRDB National Solar Radiation Database
 O&M operation and maintenance
 ORNL Oak Ridge National Laboratory
 PRM planning reserve margin
 RE renewable energy
 ReEDS Regional Energy Deployment System model
 RTO regional transmission organization
 SCE Southern California Edison
 SERC SERC Reliability Corporation
 SIC Standard Industrial Classification
 SPP Southwest Power Pool
 TEPPC Transmission Expansion Planning Policy Committee (WECC)
 TWh terawatt-hour
 VRE variable renewable energy
 W watt
 WECC Western Electricity Coordinating Council

 viii
This report is available at no cost from the National Renewable Energy Laboratory (NREL) at www.nrel.gov/publications.
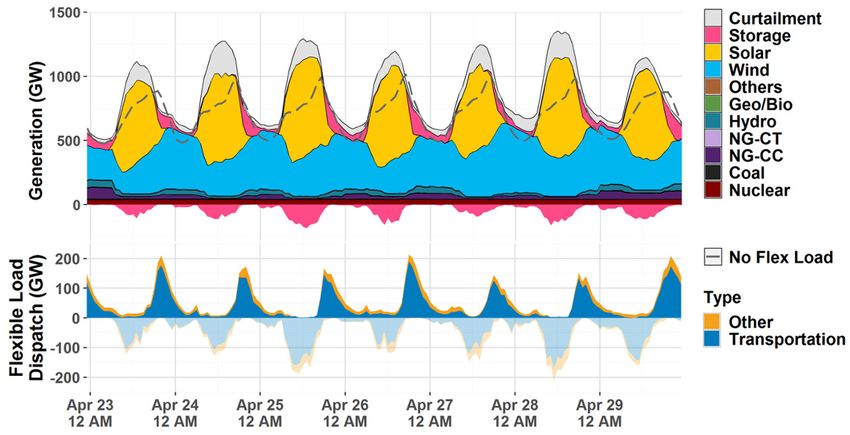
Executive Summary
 Increased electrification of the demand sectors—residential and commercial buildings, industry,
 and transportation—can lead to broad and significant impacts across the energy system.
 Widespread electrification could transform the end-use equipment stock; alter the mix and
 quantity of fuel and energy consumed; require substantial growth and change in power system
 infrastructure; and impact the operation and flexibility needs of the power system. The
 Electrification Futures Study (EFS) 1 is designed to examine these potential changes and their
 impacts. This report—the sixth in the EFS series—uses detailed grid simulations to provide a
 high-resolution U.S. national-scale assessment of power system operations in future scenarios
 with widespread electrification.

 The assessment relies on hourly unit commitment and economic dispatch modeling of a range
 of future power systems for the conterminous United States, as envisioned by prior EFS studies
 (Murphy et al. 2021). These power systems are modeled to provide sufficient electricity to serve
 up to 36% of 2050 final U.S. energy demand, which equates to 2050 electricity consumption that
 is 81% greater than that in 2018 (Mai et al. 2018; Murphy et al. 2021). The purpose of this
 assessment is to explore how variations in the magnitude and shape of electricity demand driven
 by electrification, and the extent of load participation to more-actively provide grid services,
 might impact the hourly operation, operational costs, and emissions of various power systems in
 2050. The impacts of electrification and demand flexibility are overlayed across systems with
 significantly greater penetrations of variable renewable energy (VRE) than today.

 Overall, we find that the high electrification scenarios envisioned in the EFS with significant
 VRE penetration (66% of annual national generation) can be operated to meet future increased
 levels of electrified demand. 2 We also find that demand-side flexibility—especially from newly
 electrified loads—can enhance operational efficiency by reducing VRE curtailment and
 increasing utilization of generators that have lower operating costs.

 Figure ES-1 shows simulated generation from supply-side resources along with dispatch of
 flexible loads for a spring week in 2050 when nearly all generation is from VRE. During this
 week, the flexible loads—which are principally from system-optimal charging of electric
 vehicles, but also from the buildings and industrial sectors—alter electricity consumption
 patterns to better align with mid-day solar generation. Electric vehicles are charged during the
 daytime hours (negative lighter blue areas in the bottom chart), thereby helping to avoid charging
 during evening and nighttime hours (positive darker blue areas) when available renewable
 generation is low or declining. In doing so, the flexible loads can reduce VRE curtailment. The
 largest amount of avoided VRE curtailment from demand-side flexibility is found under the
 scenarios with the highest VRE share, highlighting the potential complementary relationship
 between VRE and demand-side flexibility. Conversely, in the absence of demand-side flexibility,
 electrification can exacerbate VRE curtailment due to the misalignment of some electrified loads
 with renewable generation patterns: high electrification scenarios have curtailment rates of 6%–
 9% (of available annual VRE generation) compared to 2%–3% in reference scenarios.

 1
 For more information, see “Electrification Futures Study,” NREL, www.nrel.gov/efs
 2
 The limited amount of unserved load found in the scenarios suggests that the systems are resource adequate
 although additional probabilistic analysis with multiple weather years are needed to confirm the findings.

 ix
This report is available at no cost from the National Renewable Energy Laboratory (NREL) at www.nrel.gov/publications.
Figure ES-1. Simulated 2050 generation (top) and flexible load (bottom) dispatch during a high-
 renewable period in spring under a high electrification scenario. Dash line indicates the original
 static load without demand-side flexibility. Pink portion below the X-axis indicates storage 3
 charging.
 Geo/Bio = geothermal/ bioenergy; NG -CT = natural gas-combustion turbine; NG-CC = natural gas-combined cycle.

 Flexible loads in high electrification systems can also reduce system production costs by
 providing high-value grid services during periods of system stress and by increasing the
 utilization of more efficient units (including VRE). In high electrification scenarios with the
 greatest amount of demand-side flexibility, annual production costs are estimated to be $5
 billion–$10 billion (9%–10%) lower than in scenarios without flexibility. The largest savings on
 a percentage basis are found in scenarios with the highest VRE levels. These gross system
 benefits translate to an operational value of $17/MWh–$22/MWh of shifted load. These gross
 benefits should be compared with the costs of implementing demand-side flexibility and any
 associated monetary costs to end users, neither of which were in the scope of our analysis.

 Finally, flexible load can enhance the ability of electrification to decarbonize the energy sector,
 in large part through more efficient use of VRE generation and avoiding fossil thermal generation.
 These effects are most pronounced under the high electrification scenario (i.e., with the greatest
 amount of potential flexible load) and with high VRE penetrations (i.e., through greater reduction
 of VRE curtailment). We found reductions in annual CO2 emissions from enhanced demand-side
 flexibility of 1.6% (10.8 million tonnes CO2/year) under reference electrification and 8.3% (44.4
 million tonnes CO2/year) when high electrification is combined with high VRE penetration,
 compared with corresponding scenarios without flexibility.

 While there are many uncertainties regarding the extent of future electrification, the evolution of
 the U.S. power system, and the degree to which demand-side resources can be used to support

 3
 Storage modeled in the EFS includes pumped hydro storage, compressed air energy storage, and 4-hour battery
 storage.

 x
This report is available at no cost from the National Renewable Energy Laboratory (NREL) at www.nrel.gov/publications.
grid operations, this analysis shows the complementarity of flexible loads and renewable energy
 under high electrification futures—and that without demand-side flexibility, electrification can
 result in load profiles that could lead to greater challenges and costs. This finding highlights the
 value of increased integration and coordination of demand- and supply-side resources in future
 electric system planning and operations.

 xi
This report is available at no cost from the National Renewable Energy Laboratory (NREL) at www.nrel.gov/publications.
Table of Contents
 1 Introduction ......................................................................................................................................... 1
 2 Overview of the Electrification Futures Study Scenarios ............................................................... 2
 2.1 Electrification Level: Demand-Side Scenarios ............................................................................. 2
 2.2 Power Sector Evolution: Supply-Side Scenarios .......................................................................... 5
 2.3 Demand-Side Flexibility ............................................................................................................... 7
 3 Methods................................................................................................................................................ 9
 3.1 Modeling Overview ...................................................................................................................... 9
 3.2 Implementation of Demand-Side Flexibility in PLEXOS .......................................................... 12
 3.3 Scenarios ..................................................................................................................................... 16
 3.4 Scope and Modeling Limitations ................................................................................................ 19
 4 Results: Operation an Electrified System without Demand-side Flexibility ............................... 21
 4.1 Generation and Resource Adequacy ........................................................................................... 21
 4.2 Transmission Impacts ................................................................................................................. 25
 4.3 Renewable Curtailment ............................................................................................................... 28
 5 Results: Increasing Efficiency of High Electrification Systems with Demand-Side Flexibility 30
 5.1 Energy Shifting ........................................................................................................................... 30
 5.2 Operating Reserves ..................................................................................................................... 36
 5.3 Impacts on Fossil Generators ...................................................................................................... 38
 5.4 Production Costs and Price Variations........................................................................................ 44
 6 Results: Envisioning High Renewable High Electrification Futures ........................................... 47
 6.1 Operational Feasibility ................................................................................................................ 47
 6.2 Curtailment ................................................................................................................................. 49
 6.3 Production Costs ......................................................................................................................... 51
 6.4 Emissions .................................................................................................................................... 54
 7 Conclusion ......................................................................................................................................... 55
 8 References ......................................................................................................................................... 57
 Appendix. Operating Reserve Parameters ............................................................................................. 66

 xii
This report is available at no cost from the National Renewable Energy Laboratory (NREL) at www.nrel.gov/publications.
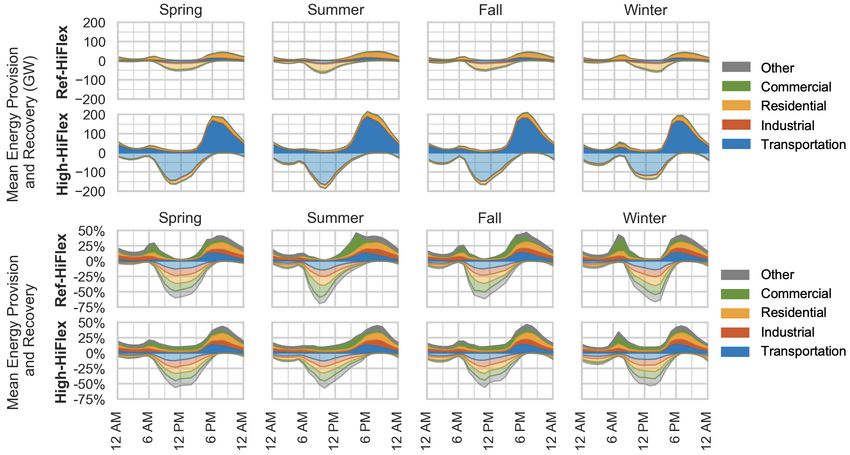
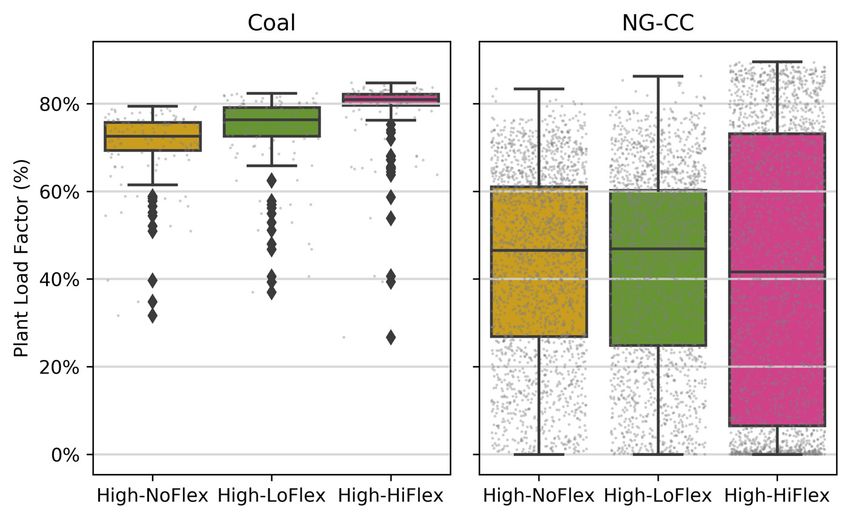
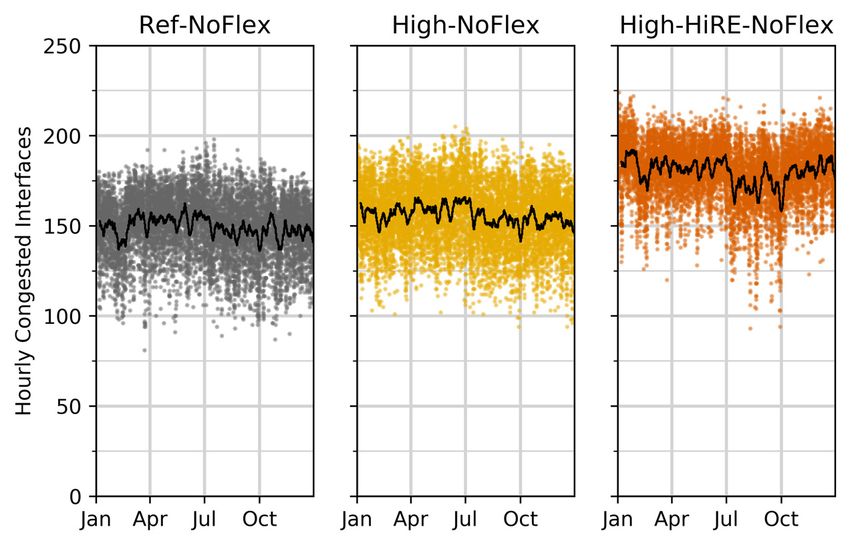
List of Figures
 Figure ES-1. Simulated generation (top) and flexible load (bottom) dispatch during a high-renewable
 period in spring under a high electrification scenario with greater VRE penetration and high
 amounts of flexible load........................................................................................................... x
 Figure 1. Electrification Futures Study structure and scenario analysis ....................................................... 2
 Figure 2. End-use electricity consumption under reference and high electrification scenarios .................... 3
 Figure 3. Month-hour electricity demand profiles for 2050 in the EFS reference and high electrification
 scenarios without demand-side flexibility and 2018 demand profile....................................... 4
 Figure 4. Illustration of ReEDS-to-PLEXOS workflow ............................................................................. 10
 Figure 5. Flexible and inflexible load in 2050 under high electrification with high DSF .......................... 13
 Figure 6. Installed generation capacity in the core scenarios...................................................................... 18
 Figure 7. Simulated 2050 annual generation for NoFlex scenarios ............................................................ 22
 Figure 8. Annual penetration by region under High-NoFlex VRE scenario (top) and High-HiRE-NoFlex
 VRE scenario (bottom) .......................................................................................................... 22
 Figure 9. Ref-NoFlex, High-NoFlex, High-HiRE-NoFlex system dispatch during potential high system
 stress days .............................................................................................................................. 24
 Figure 10. Reserve provision by technology type under the NoFlex scenarios .......................................... 25
 Figure 11. Total export and import by region in Ref-NoFlex, High-NoFlex, and High-HiRE-
 NoFlex scenarios .................................................................................................................... 26
 Figure 12. Average interface transfer capability utilization rate distribution in the NoFlex scenarios....... 27
 Figure 13. Number of congested interfaces at each hour throughout the year in the NoFlex scenarios ..... 28
 Figure 14. DSF dispatch by sector during each hour of the day in absolute (top) mean daily provision
 and as a percentage (bottom) of daily provision by sector in Ref-HiFlex and High-HiFlex
 scenarios ................................................................................................................................. 31
 Figure 15. System net load ramp duration curve ........................................................................................ 33
 Figure 16. System net load ramp of High-NoFlex, High-HiFlex, and their difference (HiFlex minus
 NoFlex) by day of the year and time of day........................................................................... 33
 Figure 17. Regional DSF operation and peak load seasonality. ................................................................. 35
 Figure 18. Total reserve provision by technology type in High-NoFlex, High-LoFlex, and High-HiFlex
 scenarios ................................................................................................................................. 36
 Figure 19. Total DSF hourly mean provisioned capacity by service type by month (top) and by hour of the
 day (bottom) in the High-HiFlex scenario. ............................................................................ 37
 Figure 20. Committed capacity versus generation from coal and natural gas combined cycle units in a
 sample week in January ......................................................................................................... 38
 Figure 21. Generation duration curve of coal units and natural gas combined cycle units in High-NoFlex,
 High-LoFlex, and High-HiFlex scenarios. ............................................................................. 39
 Figure 22. Plant load factor distribution of coal and natural gas combined cycle plants under High-
 NoFlex, High-LoFlex, and High-HiFlex scenarios ................................................................ 40
 Figure 23. Number of starts per unit per day in High-NoFlex, High-LoFlex, and High-HiFlex scenarios 41
 Figure 24. Total curtailment (bars) and curtailment rates (dots) in the Ref-NoFlex, Ref-HiFlex, High-
 NoFlex, High-LoFlex, and High-HiFlex scenarios ................................................................ 41
 Figure 25. Dispatch stack of High-NoFlex, High-LoFlex, High-HiFlex systems during high potential
 stress days. ............................................................................................................................. 43
 Figure 26. Duration curve for national average of the hourly marginal price from each balancing area,
 weighted by load .................................................................................................................... 46
 Figure 27. Dispatch stack of High-HiRE-NoFlex, High-HiRE-LoFlex, High-HiRE-HiFlex during
 potential high stress days. ...................................................................................................... 48
 Figure 28. Total monthly VRE curtailment in High-No/Lo/HiFlex scenarios (top) and High-HiRE-
 No/Lo/HiFlex scenarios (bottom) .......................................................................................... 50

 xiii
This report is available at no cost from the National Renewable Energy Laboratory (NREL) at www.nrel.gov/publications.
Figure 29. Mean hourly renewable curtailment in High-No/Lo/HiFlex scenarios (left) and High-HiRE-
 No/Lo/HiFlex scenarios (right) .............................................................................................. 51
 Figure 30. Number of hours with price higher than $100/MWh in High-HiRE-NoFlex (left) and High-
 HiRE-HiFlex (right) scenarios by balancing area .................................................................. 53
 Figure 31. Number of hours with price lower than $1/MWh in High-HiRE-NoFlex (left) and High-HiRE-
 HiFlex (right) scenarios by balancing area ............................................................................ 53
 Figure 32. Annual power system CO2 emissions (million tonnes) and difference from Ref-NoFlex
 emissions ................................................................................................................................ 54

 List of Tables
 Table 1. Ancillary Service Assumptions..................................................................................................... 12
 Table 2. Balancing Frequency and Duration Assumptions for Flexible Loads .......................................... 15
 Table 3. Core Scenarios .............................................................................................................................. 17
 Table 4. Flexible Load in 2050 ................................................................................................................... 18
 Table 5. Post-Curtailment Renewable Penetration Rates and Curtailment Data ........................................ 29
 Table 6. Total Operation Cost by Type (Billion $) ..................................................................................... 44
 Table 7. Annual Average Value of DSF ..................................................................................................... 45
 Table 8. VRE Curtailment in High and High-HiRE Scenarios ................................................................... 49
 Table 9. Gross Cost Savings in High Electrification Scenarios .................................................................. 52
 Table A-1. Ancillary Service Products Representation in PLEXOS .......................................................... 66
 Table A-2. Assumed Additional Operating Costs for Regulation Service Provision ................................. 66

 List of Text Boxes
 Text Box 1. Regional Variance in DSF Energy Shifting ............................................................................ 34

 xiv
This report is available at no cost from the National Renewable Energy Laboratory (NREL) at www.nrel.gov/publications.
1 Introduction
 Electrification, accompanied by power sector decarbonization, is seen in the scientific
 community as a critical component of climate change mitigation strategies (Loftus et al. 2015;
 Khanna et al. 2019; Guminski, Fiedler, et al. 2019; Mahone et al. 2018; Capros et al. 2019).
 By shifting energy consumption away from non-electric sources and toward electricity at the
 final point of consumption, widespread electrification could lead to profound changes in
 electricity demand in several ways. First, fuel-switching from direct combustion of fossil or
 biomass fuels to electricity could increase the total amount of annual electricity consumption.
 Second, electrification could alter electricity demand profiles; for example, adoption of electric
 technologies could yield more pronounced daily demand peaks. Finally, electrification has the
 potential to dramatically lower primary energy demand due to the higher efficiency of end-use
 devices, especially if power is supplied by renewable energy (RE).

 Alongside changes in electricity demand—driven in part by electrification—the supply side
 generation mix is also evolving. In particular, the recent and expected growth of variable wind
 and solar generation could impact electric system planning and operations, including impacts on
 transmission expansion and flows. At the same time, continued deployment of natural gas-fired
 and storage technologies and a reduction of coal-fired and nuclear capacity could increase the
 power system flexibility—the ability of a system to respond to changes to demand, variable
 renewable energy (VRE) generation, or outages and other unexpected imbalances.

 The Electrification Futures Study (EFS) is a multiyear research effort that examines the
 implications of increasing electrification in the U.S. energy system in the context of other future
 supply and demand issues. 4 The study relies on a scenario analysis approach, including scenarios
 that envision changes to both the demand-side (Mai et al. 2018) and the supply-side (Murphy et
 al. 2021) of electricity. This report—the sixth in the series of EFS publications—presents an
 operational analysis of a set of these scenarios using detailed hourly grid simulations for the year
 2050. The analysis presented in this report is designed to address the following questions:

 • How do future power systems operate to serve electricity demand that includes new
 and changing loads from widespread electrification?
 • How might flexible loads, including those from electrified end uses, be dispatched
 and what is the operational value of their flexibility?
 • How do flexible loads operate in concert with high penetration of variable renewable
 energy in the highly electrified future?
 In Section 2, we provide additional background context for these research questions by
 describing the scenarios from the prior EFS reports and findings from other relevant literature.
 Section 3 presents the modeling methods, key assumptions, scenarios modeled, and limitations.
 The analysis results are presented in Sections 4–6, with the three sections respectively focusing
 on the three research questions above. We conclude with a discussion of future research needs in
 Section 7.

 4
 For more information, see “Electrification Futures Study,” NREL, https://www.nrel.gov/analysis/electrification-
 futures.html.

 1
This report is available at no cost from the National Renewable Energy Laboratory (NREL) at www.nrel.gov/publications.
2 Overview of the Electrification Futures Study
 Scenarios
 The EFS applies a scenario analysis approach that includes a combination of demand-side
 scenarios (Mai et al. 2018) and supply-side scenarios (Murphy et al. 2021) to isolate and evaluate
 the impacts of electrification. The scenarios are for the conterminous United States energy
 system and encompass the time frame of 2018 through 2050. For the demand-side scenarios, the
 speed and extent of consumer adoption of end-use electric technologies across all major demand
 sectors—including commercial and residential buildings, transportation, and industry—are
 varied to develop multiple possible electrification levels. The supply-side scenarios represent
 different evolutionary pathways for the U.S. power system in response to the changes from
 electrification as well as an array of other possible changes in generation and storage technology,
 market, and policy conditions. Figure 1 summarizes how these two sets of scenarios are
 developed and how the current study of grid operations fits with these prior EFS studies.
 We provide additional detail, including context from relevant literature, in the remainder of
 this section.

 Figure 1. Electrification Futures Study structure and scenario analysis

 2.1 Electrification Level: Demand-Side Scenarios
 Mai et al. (2018) describe the results from the EFS demand-side analysis. The scenarios
 developed in that analysis include multiple levels of electrification that range from “reference” to
 “high” electrification to serve the same underlying demand for services. High electrification
 represents transformational electrification in multiple demand sectors. More specifically, it
 includes accelerated adoption of electric vehicles for all major on-road transportation needs,
 including those in the light-, medium-, and heavy-duty subsectors and for transit buses, such that
 electricity powers 76% of total vehicle miles traveled in 2050. High electrification also includes
 expanded adoption of electric heat pumps for space and water heating needs in all climate zones
 and electrification in other buildings subsectors. Industrial electrification is also considered in the
 high electrification scenarios, primarily for low temperature processes particularly where
 industrial electro-technologies may also offer product- and process-quality improvements.

 2
This report is available at no cost from the National Renewable Energy Laboratory (NREL) at www.nrel.gov/publications.
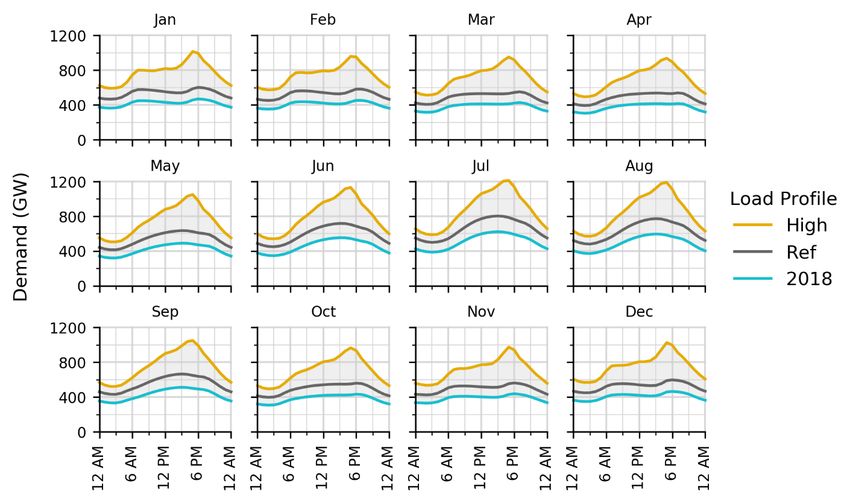
In total, electricity is estimated to provide 36% of final energy consumption by 2050 under the
 high electrification scenarios, compared with 17% estimated for 2018. 5 The reference
 electrification scenario, which serves as a baseline for comparison, includes more-limited
 adoption of end-use electric technologies with adoption rates that are closely aligned with
 historical trends. In these scenarios, electricity’s share of final energy reaches 20% in 2050. 6

 Changes in electricity demand, in terms of magnitude and timing, across electrification levels are
 of most relevance for the present analysis. Figure 2 shows 2050 electricity demand by sector for
 the reference and high electrification scenarios along with modeled estimates for 2018. 7 In the
 reference electrification scenarios, annual electricity demand in 2050 is about 29% higher than
 2018 levels mostly due to economic and population growth with only a modest increase in
 electrification. In contrast, under the high electrification scenarios, 2050 electricity consumption
 reaches 6,700 TWh, which is 1,900 TWh (40%) greater than in the reference in 2050 and nearly
 3,000 TWh (81%) greater than in 2018.

 8,000
 Annual Electricity Consumption (TWh)

 7,000 +40% +81%

 6,000

 5,000 +29%
 Commercial
 4,000 Residential
 Industrial
 3,000
 Transportation
 2,000

 1,000

 0
 2018 2050 Reference 2050 High

 Figure 2. End-use electricity consumption under reference and high electrification scenarios
 Estimates, including for 2018, are directly from the Base Case scenarios from Murphy et al. (2021), which include
 minor adjustments to electricity demand estimates from Mai et al. (2018).

 Load growth over time under high electrification occurs in all demand sectors, but the change in
 annual electricity demand for transportation is greatest relative to both 2018 and the reference in

 5
 This share is based on revised estimates from Murphy et al. (2021), which are slightly lower than values from Mai
 et al. (2018) due to differences in sectoral scope used to estimate these shares.
 6
 A Medium electrification scenario, intermediate between the Reference and High (28% of final energy) scenarios,
 is also modeled for the earlier EFS reports but is not a focus of the present one.
 7
 Scenarios with different assumptions for the efficiencies of end-use electric technology technologies (Jadun et al.
 2017) result in a range of total electricity consumption for each of the Reference, Medium, and High electrification
 levels as presented in the prior EFS reports (Mai et al. 2018; Murphy et al. 2021). However, in the present analysis
 we only consider the ‘Moderate’ technology advancement projections.

 3
This report is available at no cost from the National Renewable Energy Laboratory (NREL) at www.nrel.gov/publications.
2050. In fact, 79% of the difference in 2050 electricity demand between the high and reference
 electrification scenarios is from incremental electrified transportation demand. Despite the
 substantially greater adoption of electric heat pumps in commercial and residential buildings in
 the high electrification scenarios (relative to the reference scenarios), a more modest amount of
 incremental electricity demand is found in these sectors because of the high efficiency of heat
 pumps and the assumption that, in addition to replacing fossil fuel-based heaters, they also
 replace less-efficient electric resistance heaters (Mai et al. 2018). In these scenarios, incremental
 electrification in industry is assumed to be more limited than in other sectors, reflecting likely
 greater technical and economic challenges and the greater data limitations for this sector (Deason
 et al. 2018; Mai et al. 2018; Steinberg et al. 2017).

 Electrification also changes the shape of electricity demand, which can impact power systems
 operations. In particular, buildings electrification is found to impact the timing and magnitude of
 peak loads particularly for regions with cold climates (Mai et al. 2018). Electric vehicle charging
 can also alter overall load profiles in all seasons. Hourly load shapes for the EFS scenarios,
 estimated using the EnergyPATHWAYS model (Mai et al. 2018) and adjusted for the ReEDS
 model (Sun et al. 2020), are used in the present analysis (Figure 3).

 Figure 3. Month-hour electricity demand profiles for 2050 in the EFS reference and high
 electrification scenarios without demand-side flexibility and 2018 demand profile
 Values shown represent coincident demand for the conterminous United States with hourly demand averaged for all
 days in each month. The values shown are for scenarios without flexibility (see Section 3).

 4
This report is available at no cost from the National Renewable Energy Laboratory (NREL) at www.nrel.gov/publications.
The EFS demand-side scenarios are generated using stock and energy accounting modeling
 informed by consumer choice modeling, expert judgment, and data analysis. 8 These scenarios
 are meant to reflect “what-if” futures with different levels for electrification in the United States,
 where the high electrification scenarios are designed to capture transformational electrification.
 To provide additional context for these scenarios, we refer the reader to other projections of
 future electricity demand, including technical potential estimates (Deason et al. 2018; Steinberg
 et al. 2017; Weiss et al. 2017) that can result in much greater electrification than is estimated in
 the EFS high electrification scenarios.

 Economic potential estimates for electrification also exist for select sectors and regions
 (Wilson et al. 2017; Nadel 2016). Economic potential refers to the total fuel-powered end uses
 for which electric alternatives have reached approximate lifecycle cost parity with fuel-powered
 technologies providing the same services. A variety of stock turnover models, bottom-up end-use
 models, and integrated systems models have been used to develop demand-side scenarios of
 electrification (Leighty, Ogden, and Yang 2012; Khanna et al. 2019; Brand, Cluzel, and Anable
 2017). Results from economic potential or adoption scenario estimates depend on the
 assumptions used, which differ from those in the EFS and therefore are not directly comparable.
 However, the extent of electrification estimated in these studies is similar to that from the EFS
 scenarios. For example, the EPRI National Electrification Assessment study (EPRI 2017)
 employs an end-use adoption model with a range of assumptions. It finds electricity’s share of
 2050 final energy to range between 32% and 52% load growth between 2018 and 2050 in its
 highest electrification scenario. As with the EFS, load growth in EPRI (2017) is dominated by
 electrified transport, and it finds a similar impact of higher winter peaks from buildings
 electrification.

 Studies of energy system decarbonization also include several scenarios with increased
 electrification (Williams et al. 2014; Ebrahimi, Mac Kinnon, and Brouwer 2018; Boßmann and
 Staffell 2015). 9 These studies generally find electrification levels that are comparable or exceed
 those from the EFS scenarios. In other words, these studies identify electrification as one of the
 primary means to reduce economy-wide greenhouse gas emissions.

 2.2 Power Sector Evolution: Supply-Side Scenarios
 Murphy et al. (2021) introduce the EFS supply-side scenarios, which include 29 scenarios
 representing changes in the U.S. power sector through 2050. These supply-side scenarios span
 variations in multiple dimensions including, most prominently, the electrification level, end-use
 electric technology advancement, renewable technology costs and performance, natural gas
 prices, and a variety of system constraints. The modeling analysis by Murphy et al. (2021) covers
 capacity and generation mix changes to the U.S. electricity system and several broader energy
 sector-wide impacts, including system costs, air emission, and energy consumption.

 One of the trends from the EFS supply-side scenarios is that nearly all future increases in
 electricity demand, including those from new electrification-driven loads, are met by a

 8
 The Reference scenario is largely based on the AEO2017 Reference case. For all scenarios, the
 EnergyPATHWAYS energy accounting and stock rollover model is used to generate these estimates.
 See Mai et al. (2018) for details.
 9
 The highest electrification scenarios from EPRI (2017) considers an increase in carbon price.

 5
This report is available at no cost from the National Renewable Energy Laboratory (NREL) at www.nrel.gov/publications.
combination of natural gas-fired and renewable energy technologies (Murphy et al. 2021). For
 example, across all scenarios with high electrification, the combined share of total generation
 from natural gas and renewable energy ranges from 82% to 90% in 2050, compared with 56% in
 2019. This comparison understates the absolute amount of generation from these sources, given
 the much greater overall electricity generation and consumption estimated for 2050 with
 increasing levels of electrification (see Figure 3, page 4).

 While growth in the combined share and amount of natural gas and renewable energy generation
 is found in all the EFS supply-side scenarios, Murphy et al. (2021) also found considerable trade-
 offs and competition between natural gas-fired and renewable energy sources. For example,
 scenarios with the largest growth in gas generation had more limited amounts of renewable
 energy deployment and vice versa. Another trend identified from prior EFS analysis is that most
 of the growth in renewable energy is from variable wind and solar technologies: across all high
 electrification scenarios, annual penetration of VRE generation ranged from 24% to 79% in
 2050, compared with about 9.8% in 2019. 10

 Section 3 presents the capacity mixes, based on the EFS supply-side scenarios, used for the
 present analysis. These changes to electricity supply, along with changes in the magnitude and
 timing of electricity demand envisioned, raise questions about the operational feasibility of such
 scenarios and the possible technical and economic challenges—such as VRE curtailment,
 provision of operating reserves, and transmission congestion—of serving demand and other grid
 services for all hours. 11 Furthermore, the EFS scenarios were developed using a long-term
 capacity expansion model, the Regional Energy Deployment System (ReEDS) model (Cohen et
 al. 2019; Sun et al. 2020), and its associated simplifications, including a reduced-form
 representation of generation dispatch. The present analysis, which uses hourly unit commitment
 and economic dispatch modeling, is designed in part to verify whether the lower-fidelity
 modeling from the prior EFS analysis sufficiently captured the grid operations of the scenarios.
 Section 3 describes the model linkages in detail.

 As with the EFS demand-side scenarios, an examination of the literature can help provide
 additional context for the supply-side scenarios. Scenarios with increased electrification in EPRI
 (2017), for instance, also find that increases in natural gas generation to meet electrification-
 driven load growth. The growth in generation from renewable energy technologies, especially
 VRE technologies, is another commonality of the EFS scenarios and those in recent studies
 (Luderer et al. 2014; Hansen, Mathiesen, and Skov 2019; Dennis, Colburn, and Lazar 2016;
 Berrill et al. 2016). The estimated growth in renewable energy is most pronounced in scenarios
 with an explicit or implicit price on carbon emissions.

 The EFS scenarios, as well as other recent scenario studies (Dupont et al. 2014; Baruah et al.
 2014; Quiggin and Buswell 2016; Richardson and Harvey 2015) envision increasing power
 system flexibility, including through the expansion of flexible loads. Given the complexities with

 10
 Unless otherwise noted, penetration is presented on a post-curtailment annual energy basis and as a fraction of
 total generation.
 11
 Many of the scenarios also include substantial retirements of coal and nuclear capacity, transmission expansion,
 and increases in energy storage capacity.

 6
This report is available at no cost from the National Renewable Energy Laboratory (NREL) at www.nrel.gov/publications.
demand-side flexibility and its model implementation, we provide an overview in the next
 section of how it was considered in prior EFS reports and in the broader literature.

 2.3 Demand-Side Flexibility
 Demand-side flexibility (DSF) refers broadly to any programs or capabilities in the electricity
 demand sectors (buildings, transportation, and industry) that enable or encourage end-users to
 alter their consumption with the aim of improving the efficiency and/or reliability of the power
 system. DSF is varied and complex in terms of the type of programs and the different grid
 services that it may provide. Existing DSF programs adopted in the United States include
 (1) time-based pricing programs (e.g., time-of-use pricing, real-time pricing, critical peak pricing
 programs); (2) incentive-based programs (e.g., direct load control, interruptible/curtailable
 service, demand bidding/buy back, and emergency demand response programs); and (3) direct
 participation in restructured power markets, including capacity and ancillary service markets
 (Aalami, Moghaddam, and Yousefi 2010; FERC 2018). A variety of names and terms, such as
 demand response and demand-side management, are used to refer to these programs. Overall,
 there is growing interest and potentially adoption of DSF and distributed energy resources
 especially in light of recent regulatory changes pertaining to electricity markets. Specifically, in
 September 2020, the Federal Energy Regulatory Commission (FERC) issued Order No. 2222
 (FERC 2020), which opens up the U.S. organized whole power markets to distributed energy
 resources through aggregators.

 DSF can also be categorized by the behavior of the end-use equipment owners (Alstone et al.
 2017). One category is load shifting, which occurs when energy consumption moves from
 periods of high demand (and prices) to periods of low demand. Load shedding (also referred to
 as peak shaving) is when consumption is curtailed during times of system stress, but that
 curtailed energy is not necessarily made up during other periods. DSF can also include short-
 term dynamic adjustments, possibly including power injections from the customer side, to
 manage disturbances in the seconds-to-hour timescale (Alstone et al. 2017). On longer
 timescales, power-to-heat and power-to-hydrogen are also seen as a type of flexible load to
 provide energy system flexibility and facilitate renewable energy integration (Qadrdan et al.
 2017; Lewandowska-Bernat and Desideri 2018; Lund et al. 2015; D. Wang et al. 2018).

 In addition to the complexities associated with the multiple types of DSF, analyzing the
 future extent and impact of DSF is challenging because of the interplay of electricity demand,
 regulatory and market design, pricing and business models, consumer behavior, and grid and
 communications infrastructure (Jones et al. 2018; Patteeuw, Henze, and Helsen 2016). The EFS
 does not comprehensively model all these factors, and it considers the total flexible load
 potential as exogenous in its scenarios. In the remainder of this section, we summarize the
 treatment of DSF in prior EFS analysis and review other recent studies.

 DSF was considered in the EFS supply-side scenarios (Murphy et al. 2021) as aggregated
 flexible load that could be optimally dispatched (from a system perspective), but constrained by
 amount, timing, direction, and duration for each demand subsector (e.g., water heating, vehicle
 charging). 12 As modeled, this flexible load can shift energy between dispatch periods, which can
 reduce operating costs, help avoid peaking capacity needs, and lower operating reserve

 12
 See Sun et al. (2020) for assumptions and modeling details.

 7
This report is available at no cost from the National Renewable Energy Laboratory (NREL) at www.nrel.gov/publications.
requirements. Other types of DSF, such as load shedding, were not modeled. Three different
 levels of DSF, based on exogenously assumed participation rates, were considered: Current,
 Base, and Enhanced. Current DSF holds customer participation constant from 2018 to 2050.
 Base flexibility assumes 20% customer participation rates in 2050 for all sectors, which is based
 on successful programs surveyed in the 2016 EIA 861 data (EIA 2018). Enhanced DSF
 represents an expansion of light-duty vehicle participation to over 90% of demand response
 events. 13 Murphy et al. (2021) and Sun et al. (2020) provide details for these assumptions. Our
 present analysis is based on many of the same assumptions from Sun et al. (2020) but applied at
 higher sectoral resolution. Our method, inputs, and assumptions are described in Section 3.

 The EFS analysis—both prior reports and the present analysis—do not attempt to predict the
 amount of future DSF; instead, they are designed to assess how DSF might affect the evolution
 and operation of the future power system. The analysis does not consider the cost of DSF; that is,
 we assume the implementation and operational costs of DSF to be zero – same as that of battery
 storage and VRE. In doing so, our analysis estimates the gross benefits of DSF to the grid only
 rather than providing a full cost-benefit analysis. For example, the prior EFS analysis finds that
 the total (operational and long-run) value of flexible load is $16 MWh–$19/MWh under high
 electrification but does not assess whether the costs to implement the flexibility is lower than
 these estimated system benefits.

 DSF can offer a range of benefits to the system. The prior EFS analysis (Murphy et al. 2021)
 finds that the primary benefit of DSF is to avoid or defer the need for capacity investments,
 particularly for peaking needs, but also for other generation and transmission investments. For
 example, with high electrification, Murphy et al. (2021) find that having enhanced flexibility
 would avoid 100 gigawatts (GW) of installed capacity by 2050 compared to having base-level
 flexibility. Other studies have also found that avoiding capacity is a major benefit of flexible load
 (Hale, Stoll, and Mai 2016; Nolan, Neu, and O’Malley 2017; Gils 2016; Smith and Brown 2015).

 In addition to avoiding capacity, there is also operational value from DSF. Multiple studies
 conclude that DSF, such as load shifting of heat pumps and smart electric vehicle charging, can
 reduce renewable curtailment (Gottwalt et al. 2017; Mileva et al. 2016; Teng, Aunedi, and Strbac
 2016). For example, modeling of the 2025 Belgian power system operation shows that by
 shifting 2% of total demand, the system can avoid up to 41% of renewable curtailment (Dupont
 et al. 2014). More generally, studies have found multiple sources of potential value from DSF,
 including providing operating reserves (Stoll, Buechler, and Hale 2017; Roos and Bolkesjø 2018;
 Ma and Cheung 2016; Katz, Balyk, and Hevia-Koch 2016), lowering production costs and
 electricity prices (Tveten, Bolkesjø, and Ilieva 2016; Märkle-Huß, Feuerriegel, and Neumann
 2018), and reducing the need for storage (Li and Pye 2018). While flexibility can be sourced
 from a range of demand-side sources, some studies have focused on the values from new
 electrified loads, particularly flexible electric vehicle charging (Pavic et al. 2014; Pavić,
 Capuder, and Kuzle 2015; Schuller, Flath, and Gottwalt 2015).

 13
 Typically, the system operator’s request to the flexible demand to reduce demand for a specific time period on a
 specific day is referred to as a demand response event. This assumption is based on a PG&E and BMW study
 (Kaluza, Almeida, and Mullen 2017).

 8
This report is available at no cost from the National Renewable Energy Laboratory (NREL) at www.nrel.gov/publications.
You can also read