Knowledge Synthesis and Re-Establishment Plan for Coquitlam Reservoir Sockeye Salmon - Government of B.C.
←
→
Page content transcription
If your browser does not render page correctly, please read the page content below
Knowledge Synthesis and Re-Establishment Plan for
          Coquitlam Reservoir Sockeye Salmon

                                           Prepared for
                     The Kwikwetlem Salmon Restoration Program
                                             Prepared by
                         E.M. Plate1, J. Bruce2, P. Ward3 and R.C. Bocking1

       This Project was financially supported by the Fish and Wildlife
                  Compensation Program Project #: 14.COQ.02

1
LGL Limited
environmental research associates
9768 Second Street
Sidney, BC, V8L 3Y8
2
Creekside Aquatics
2754 Hwy 101
Roberts Creek, BC, V0N 2W3
3
Ward Peter & Associates Limited
Suite 307-997 Mainland Street
Vancouver, BC, V6B 1T2
                                         15 October 2014
Knowledge Synthesis and Re-Establishment Plan for Coquitlam Reservoir Sockeye Salmon

EXECUTIVE SUMMARY
 Sockeye Salmon were extirpated from Coquitlam Lake and the whole Coquitlam Watershed in 1914
with the completion of the Coquitlam Dam at its current height. The Kwikwetlem Salmon Restoration
Program (KSRP) has led the efforts to re-introduce and re-establish a sustainable Sockeye Salmon
population into Coquitlam Reservoir for the last 12 years. Through these efforts, a knowledge base
about current conditions and future directions for the Coquitlam Reservoir Sockeye Salmon re-
introduction and population establishment has been built. This report summarizes current conditions
and future direction and gives recommendations for decision points to initiate the next steps in
establishing a self-sustaining Sockeye Salmon population.

The main obstacle to Sockeye re-establishment is the inability to allow significant numbers of Kokanee
smolts to survive leaving the reservoir. The probable reasons for this are: 1) injury or mortality when
passing through the Low Level Outlets (LLOs) into the tunnel and the Lower Coquitlam River, 2) lack of
surface current to attract Kokanee smolts into the dam forebay and Sluice Tower area, and 3) inability of
smolts to find the LLOs in the dam Sluice Tower.

Smolt outmigration numbers could be boosted using two approaches, as follows:

    1. Reservoir elevation and discharge volume through the LLO could be optimized for the month of
       May by creating smolt attracting surface current by increasing LLO discharge to >6 m3/s and by
       lowering the reservoir elevation to  0.5m3/s increase) pulse discharges from Coquitlam Reservoir to increase flows and thus

                                                                                              i|Page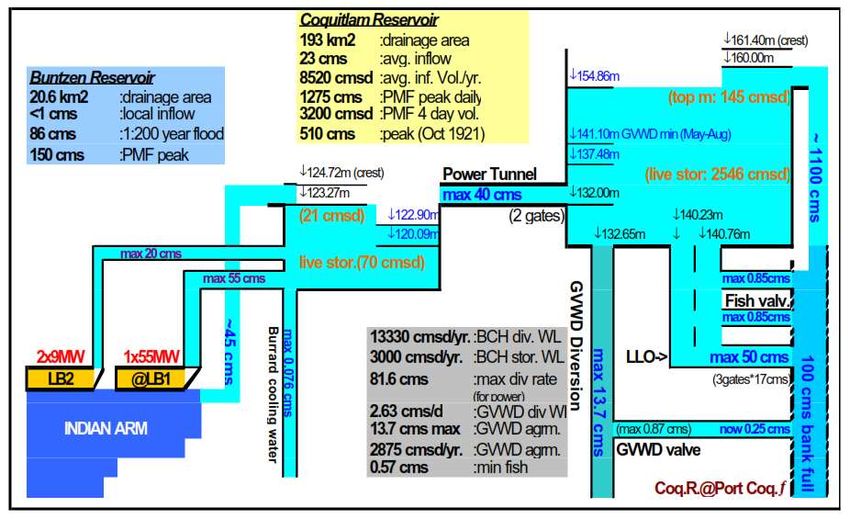
Knowledge Synthesis and Re-Establishment Plan for Coquitlam Reservoir Sockeye Salmon

encourage salmon to move out of otter exposed holding areas into the “otter-proof” fish trap.
Environmental, public safety concerns and the effectiveness of such pulse flows should be reviewed.

If smolt to adult survival is found to be in line with, or higher than, other Lower Fraser Sockeye stocks
(>1%) and Sockeye Salmon returns increases to more than 500 fish, consideration can be given to
replacing the surface smolt collection system with a surface fish passage facility. Once a larger number
of Sockeye Salmon is regularly transported above the dam, their offspring should have a higher
propensity to leave the reservoir and the need for further hatchery enhancement is hoped to be
eliminated. To facilitate large numbers of smolts to leave the reservoir and to accommodate larger
(>1,000) Sockeye Salmon escapements, a complete fish ladder should be added to the Coquitlam Dam
structure. The optimization of discharge to accommodate smolt outmigration will be directly negotiated
with BC Hydro within the operational framework for Coquitlam Reservoir. Funding for the investigation
of smolt movement in the spring and the hatchery program will be applied for through Fish and Wildlife
Compensation Program (FWCP) on an annual basis. The more costly construction and operation of a
surface fish passage way for smolts and/or a fish ladder for adults will need to be supported directly by
BC Hydro.

The fish ladder and the increasing numbers of Sockeye returning to the reservoir will hopefully increase
the escapement to the dam to >1,000 fish and allow for unassisted migration into and out of Coquitlam
Reservoir. In addition, a fish ladder would also likely lead to the establishment of populations of Coho
Salmon and Steelhead Trout above the dam.

If implemented sequentially as proposed, these measures will address the primary difficulties to be
resolved to restore a Sockeye Salmon population above the dam.

                                                                                              ii | P a g e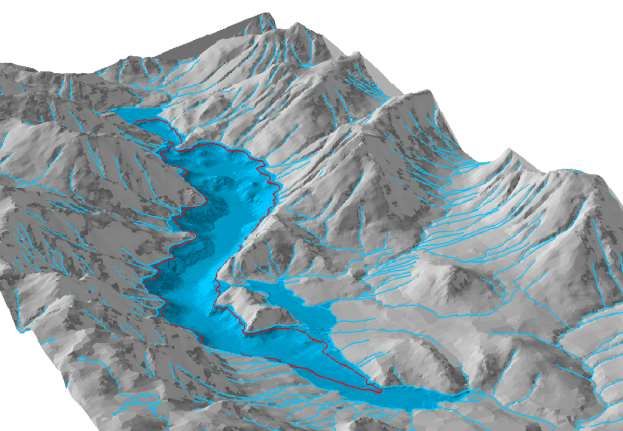
Knowledge Synthesis and Re-Establishment Plan for Coquitlam Reservoir Sockeye Salmon

TABLE OF CONTENTS
EXECUTIVE SUMMARY ............................................................................................................................................ I

ACKNOWLEDGEMENTS .......................................................................................................................................VIII

INTRODUCTION ..................................................................................................................................................... 1

   REPORT BACKGROUND AND OBJECTIVES .............................................................................................................................1
   PHYSICAL SETTING AND EXISTING HYDRO FACILITIES .............................................................................................................3
   COQUITLAM RESERVOIR HYDRO OPERATIONS ......................................................................................................................9
   KWIKWETLEM SALMON RESTORATION PROGRAM (KSRP) ...................................................................................................14
   THE PAST OF COQUITLAM RESERVOIR SALMONIDS FROM ORAL HISTORY, WRITTEN HISTORY AND GENETIC RESULTS ......................14

STUDIES ON COQUITLAM SALMON SPECIES HISTORY AND CURRENT ESCAPEMENT ............................................ 15

   SOCKEYE SALMON ........................................................................................................................................................15
   COHO SALMON ............................................................................................................................................................17
   STEELHEAD .................................................................................................................................................................19
   CHUM AND PINK SALMON .............................................................................................................................................20
   CHINOOK SALMON .......................................................................................................................................................22

LOWER COQUITLAM RIVER HABITAT ENHANCEMENT ......................................................................................... 22

COQUITLAM RESERVOIR STUDIES ........................................................................................................................ 24

   COQUITLAM RESERVOIR PRODUCTIVITY, PLANKTON AND WATER CHEMISTRY ..........................................................................24
   COQUITLAM RESERVOIR DRINKING WATER AND SALMON RE-ESTABLISHMENT.........................................................................26
   COQUITLAM RESERVOIR FISHERIES PRODUCTIVITY ..............................................................................................................28
   COQUITLAM RESERVOIR SPAWNING HABITAT AVAILABILITY ..................................................................................................31
   NON-KOKANEE RESIDENT SPECIES ...................................................................................................................................32
   INTRODUCTION OF DISEASES INTO COQUITLAM RESERVOIR ..................................................................................................33

COQUITLAM SOCKEYE RE-INTRODUCTION STUDIES ............................................................................................. 33

   SMOLT OUTMIGRATION STUDIES.....................................................................................................................................33
   ADULT SOCKEYE ESCAPEMENT STUDIES ............................................................................................................................40
   GENETIC STUDIES .........................................................................................................................................................42

SUMMARY OF FACTORS THAT AFFECT SOCKEYE RE-INTRODUCTION ................................................................... 43

ENHANCEMENT CONSIDERATIONS ...................................................................................................................... 48

   EXISTING COQUITLAM RIVER HATCHERY FACILITIES .............................................................................................................48
   A CAPTIVE BROODSTOCK PROGRAM ................................................................................................................................49
   WILD KOKANEE BROODSTOCK COLLECTION WITH HATCHERY REARING TO SMOLT STAGE ...........................................................49

FISH PASSAGE ALTERNATIVES OVER COQUITLAM DAM ....................................................................................... 51

   CURRENT SMOLT OUTMIGRATION ...................................................................................................................................51
   A FLOATING SURFACE SMOLT COLLECTOR AS AN INTERMEDIATE WAY TO TRANSPORT SMOLTS OVER COQUITLAM DAM ..................51
   MODIFICATIONS TO COQUITLAM DAM TO ALLOW FOR SMOLT FISH PASSAGE ..........................................................................51
   ADULT TRAPPING AND TRUCKING OPERATIONS ..................................................................................................................53

                                                                                                                                                            iii | P a g e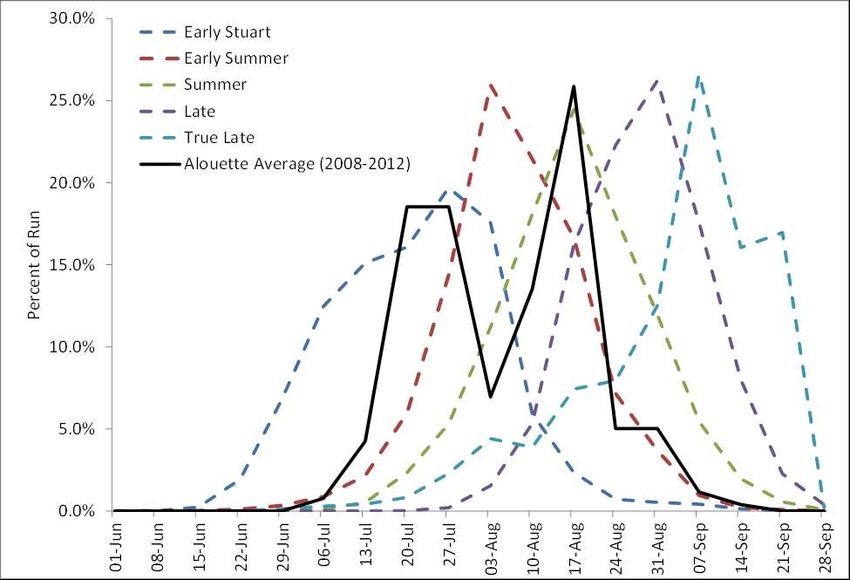
Knowledge Synthesis and Re-Establishment Plan for Coquitlam Reservoir Sockeye Salmon

FISHERIES MANAGEMENT CONSIDERATIONS....................................................................................................... 54

   FRASER MANAGEMENT OBJECTIVES .................................................................................................................................54
   WILD SALMON POLICY ..................................................................................................................................................54
   MANAGEMENT GOALS FOR THE EARLY SUMMER STOCK GROUPING .......................................................................................55
   EXPLOITATION RATES ON THE EARLY SUMMERS .................................................................................................................56
   FRASER SOCKEYE PRODUCTIVITY AND SURVIVAL RATES ........................................................................................................57
   IMPLICATIONS FOR COQUITLAM SOCKEYE..........................................................................................................................60
   MANAGEMENT GOALS FOR COQUITLAM SOCKEYE ..............................................................................................................60
   CURRENT AND FUTURE FIRST NATION FISHERIES FOR COQUITLAM SALMON ............................................................................60
   CURRENT AND FUTURE COMMERCIAL FISHERIES FOR COQUITLAM SALMON .............................................................................61
   CURRENT AND FUTURE RECREATIONAL FISHERIES FOR COQUITLAM SALMON ...........................................................................61

GOALS AND METRICS FOR SOCKEYE RE-INTRODUCTION INTO COQUITLAM RESERVOIR ...................................... 62

STEPWISE SUMMARY OF SOCKEYE AND OTHER SALMON SPECIES RE-ESTABLISHMENT OPTIONS ....................... 62

NEXT STEPS, DECISION POINTS FOR FUNDING APPLICATIONS ............................................................................. 65

   REFERRAL OF PLAN TO FWCP AND BC HYDRO ..................................................................................................................65

LITERATURE CITED ............................................................................................................................................... 66

                                                                                                                                                       iv | P a g e
Knowledge Synthesis and Re-Establishment Plan for Coquitlam Reservoir Sockeye Salmon

LIST OF TABLES
TABLE 1    MONTHLY TARGETED FLOW RELEASES FROM COQUITLAM RESERVOIR TO THE COQUITLAM RIVER AS DESCRIBED IN THE
           SYSTEM’S COQUITLAM BUNTZEN PROJECT WATER USE PLAN (BC HYDRO 2005). .................................................. 10
TABLE 2    SUMMARY OF COQUITLAM RIVER AND TRIBUTARIES HABITAT IMPROVEMENT PROJECTS (FROM: COQUITLAM RIVER
           WATERSHED 2013). ...................................................................................................................................23
TABLE 3    COMPARISON OF THREE MODEL ESTIMATES OF SOCKEYE SMOLT BIOMASS, SMOLT NUMBERS AND REQUIRED SPAWNERS
           COMPARED TO 2005, 2010 AND 2011 KOKANEE FALL FRY (AGE 0+ AND 1+) STANDING CROP ESTIMATES FROM
           HYDROACOUSTIC SURVEYS IN COQUITLAM RESERVOIR. ....................................................................................... 30
TABLE 4    SUMMARY OF ROTARY SCREW TRAP (RST) DATA COLLECTED ON THE LOWER COQUITLAM RIVER FROM 2005 TO
           2013. LLO RELEASE REFERS TO THE DURATION THAT A LOW LEVEL OUTLET WAS IN USE DELIVERING A FLOW PULSE
                3
           >3 M /S. CAPTURE EFFICIENCIES WERE THOSE REPORTED FOR COHO SMOLTS CAUGHT IN RST 3. SMOLT ABUNDANCE
           ESTIMATES WERE BASED ON RST 3 CATCH DATA AS WELL. ................................................................................... 34
TABLE 5    ANNUAL RST TRAP MORTALITY FOR OUT MIGRATING KOKANEE SMOLTS, WATER RELEASE CONFIGURATIONS AND
           COQUITLAM RESERVOIR ELEVATIONS (2005–2013). ........................................................................................36
TABLE 6    SUMMARY TABLE FOR ALL FACTORS THAT AFFECT THE SOCKEYE RE-INTRODUCTION INTO COQUITLAM RESERVOIR AND
           MITIGATIVE MEASURES TO RESPOND TO THESE FACTORS...................................................................................... 44
TABLE 7    SUMMARY OF INFORMATION FOR LOWER COQUITLAM RIVER HATCHERIES (SOURCE: COQUITLAM RIVER WATERSHED
           2012). .....................................................................................................................................................48
TABLE 8    MONTHLY MEAN FLOW TARGETS THROUGH THE COQUITLAM RESERVOIR LLO SET BY THE COQUITLAM BUNTZEN
           PROJECT WATER USE PLAN (2005). ..............................................................................................................52
TABLE 9    SMOLT TO ADULT RETURN SURVIVAL RATES FOR ALOUETTE SOCKEYE BY YEAR OF SMOLTING AND YEAR OF BROOD
           (BOCKING, UNPUBLISHED DATA). ...................................................................................................................59
TABLE 11   ESTIMATES OF FRASER SOCKEYE HARVESTED IN CANADIAN RECREATIONAL FISHERIES BY YEAR AND BY REGION,
           1986−2009 (SOURCE: ENGLISH ET AL. 2011A). .............................................................................................61

                                                                                                                                                      v|Page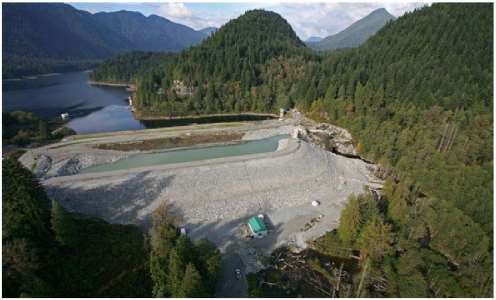
Knowledge Synthesis and Re-Establishment Plan for Coquitlam Reservoir Sockeye Salmon
LIST OF FIGURES
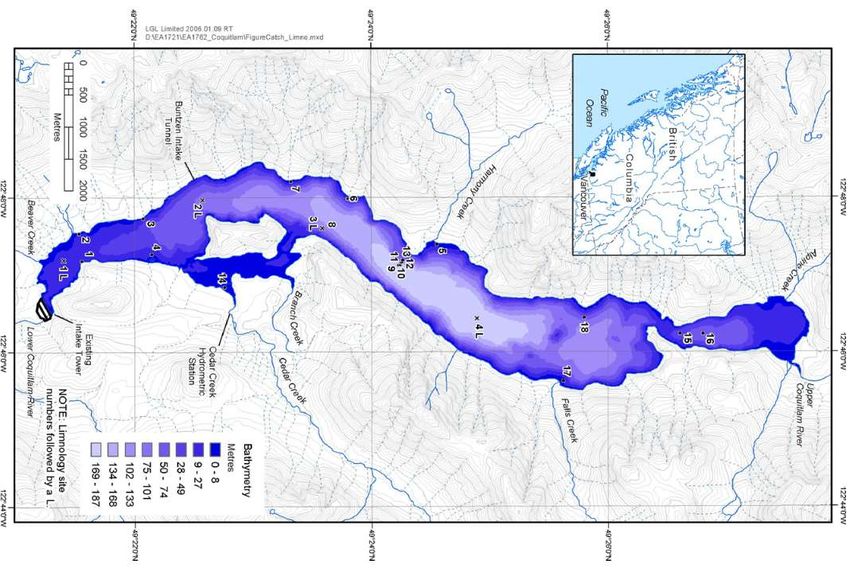
FIGURE 1 DECISION PROCESS FOR “PHASED” APPROACH TO DESIGNING AND IMPLEMENTING A FISH PASSAGE PLAN FOR THE
COQUITLAM WATERSHED. ..............................................................................................................................2
FIGURE 2 PICTURE OF COQUITLAM DAM (STUART 2010). .................................................................................................4
FIGURE 3 COQUITLAM-BUNTZEN HYDRO GENERATING COMPLEX (KSRP COMMITTEE). ............................................................4
FIGURE 4 COQUITLAM-BUNTZEN SYSTEM DIAGRAM (BOCKING AND GABOURY 2003). ............................................................5
FIGURE 5 BATHYMETRY OF COQUITLAM RESERVOIR WITH WATER SAMPLING STATION NUMBERS (BUSSANICH ET AL. 2006A). ........6
FIGURE 6 TWO-DIMENSIONAL MAP OF COQUITLAM LAKE SHOWING THE SHORE OF COQUITLAM LAKE BEFORE INUNDATION AS A
RED LINE AND THE CURRENT LAKE SHORE AT THE EDGES OF THE BLUE AREA (METRO VANCOUVER). ............................... 7
FIGURE 7 KNIFE GATE VALVE INSTALLED IN 2008 AT ONE OF THE LLOS IN THE COQUITLAM DAM GATEHOUSE (BC HYDRO
ENGINEERING 2009). ....................................................................................................................................8
3
FIGURE 8 PLOT OF COQUITLAM DAM RELEASES (M /S) TO THE LOWER COQUITLAM RIVER FROM 2003 TO 2013. DURING PRE-
WUP RELEASES (UP TO OCTOBER 2008, GREEN LINES), FVS WERE FULLY OPEN YEAR ROUND TO DELIVER
DOWNSTREAM FLOWS BASED ON PREVAILING RESERVOIR ELEVATION. POST WUP IMPLEMENTATION DISCHARGES
(2008 ONWARD, BURGUNDY LINES) THROUGH THE NEW LLO MOSTLY FOLLOWED A SPECIFIED MONTHLY WUP
TARGET (RED LINE). ..................................................................................................................................... 11
FIGURE 9 SLUICE GATE DISCHARGES FROM 2003 TO 2008. OF PARTICULAR NOTE ARE PULSE FLOW TRIALS OF 2005, 2006 AND
2008, AND THE NATURAL SPILL OF 2007, ALL OF WHICH OCCURRED EITHER JUST BEFORE OR DURING THE SMOLT
OUTMIGRATION MONITORING PERIOD OF APRIL 1–MAY 31. ............................................................................... 11
FIGURE 10 PLOT OF COQUITLAM LAKE RESERVOIR DAILY AVERAGE WATER SURFACE ELEVATIONS FROM 2003 TO 2013. ...............12
FIGURE 11 DISCHARGES FROM THE COQUITLAM LAKE RESERVOIR, 2003–2013, ILLUSTRATING THE RELATIVE CONSTANCY AND
SMALL VOLUME OF GVWD EXTRACTIONS (RED LINE, AVERAGE VALUES OVER THE 2003–2013 PERIOD). .................... 14
FIGURE 12 RELATIVE ARRIVAL TIMING OF ALOUETTE SOCKEYE AT THE ALLCO FISH FENCE IN COMPARISON TO TIMING THROUGH
THE LOWER FRASER RIVER FOR THE MAIN FRASER RIVER RUN TIMING GROUPS (02-09 AVERAGE) (NOBLE 2011;
PLATE AND BOCKING 2013). ........................................................................................................................16
FIGURE 13 TIMING OF COHO, STEELHEAD, CHINOOK, CHUM AND PINK SALMON SPAWNING, INCUBATION AND SMOLTING IN THE
LOWER COQUITLAM RIVER BASED ON COQMON-7 AND ASSUMED TIMING FOR THE SAME STAGES FOR SOCKEYE
(DATA: BOCKING AND GABOURY 2003; SCHICK ET AL. 2013).............................................................................18
FIGURE 14 COHO ESCAPEMENT INTO COQUITLAM RIVER BELOW COQUITLAM DAM FROM 2002 TO 2011 BASED ON AUCS AND
MARK RECAPTURE EXPERIMENTS (DATA: SCHICK ET AL. 2013 COQMON-7). ........................................................ 18
FIGURE 15 STEELHEAD ESCAPEMENT INTO COQUITLAM RIVER BELOW COQUITLAM DAM FROM 2002 TO 2011 (DATA: SCHICK ET
AL. 2013). ................................................................................................................................................ 20
FIGURE 16 CHUM ESCAPEMENT INTO COQUITLAM RIVER BELOW COQUITLAM DAM FROM 2002 TO 2011 (DATA FROM: SCHICK
ET AL. 2013). ............................................................................................................................................ 21
FIGURE 17 PINK ESCAPEMENT INTO COQUITLAM RIVER BELOW COQUITLAM DAM FROM 2002 TO 2011 (DATA FROM: SCHICK ET
AL. 2013). ................................................................................................................................................ 21
FIGURE 18 CHINOOK ESCAPEMENT INTO COQUITLAM RIVER BELOW COQUITLAM DAM FROM 2002 TO 2011 (DATA FROM:
SCHICK ET AL. 2013). ..................................................................................................................................22
FIGURE 19 ZOOPLANKTON DENSITIES IN FERTILIZED BC RESERVOIRS IN COMPARISON TO THE UNFERTILIZED COQUITLAM
RESERVOIR (PRESENTATION DR. JOHN STOCKNER 2014, ECO LOGIC). ..................................................................25
FIGURE 20 THE PROPORTION OF AVERAGE CELL DENSITY (CELLS/ML) FOR MERISMOPEDIA AND NON-MERISMOPEDIA ORGANISMS
IN COQUITLAM RESERVOIR (STOCKNER AND VIDMANIC 2014). ........................................................................... 26
FIGURE 21 PERCENT OF TOTAL CATCH IN COQUITLAM RESERVOIR BY SPECIES (PLATE ET AL. 2012). ...........................................32
FIGURE 22 DAILY SMOLT COUNT FOR YEARS 2009 TO 2013 WHERE LLO GATE OPERATIONS WERE NOT TIME CONSTRAINED
DURING THE OUTMIGRATION MONITORING PERIOD (APRIL 1 TO MAY 31).............................................................. 35
vi | P a g e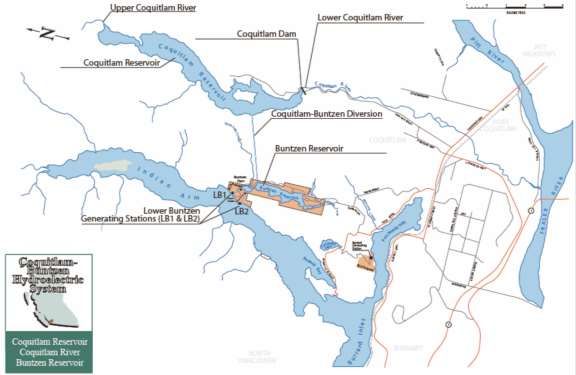
Knowledge Synthesis and Re-Establishment Plan for Coquitlam Reservoir Sockeye Salmon

FIGURE 23   PLOT OF ESTIMATED SMOLT NUMBERS BASED ON RST CATCH DATA AS A FUNCTION OF AVERAGE TOTAL SLUICE TOWER
            LLO3 DISCHARGE. “LLO” REFERS TO LOW LEVEL OUTLET (NO. 3), “FV” REFERS TO FISH FLOW VALVES, OF WHICH
                                                                                                                          3
            THERE ARE 2, “PULSE” REFERS TO THE ADDITION OF SHORT TERM FLOW PULSES OF 6 M /S LASTING 7 DAYS, “NEW”
            REFERS TO OPERATIONS WITH THE NEW LLO3 VALVE, AND “PARTIAL” OR “FULL” REFERS TO GATE OPERATIONS WITH
            THE OLD SLUICE VALVES IN PLACE.................................................................................................................... 38
                                                                                                              3
FIGURE 24   PLOT OF LLO DISCHARGE AND RST SMOLT COUNT SHOWING THE 7-DAY, 6 M /S PULSE FLOW TRIALS OF 2010 (TOP
            CHART) AND 2011 (BOTTOM CHART).............................................................................................................. 39
FIGURE 25   PLOT OF SMOLT ABUNDANCE ESTIMATE BASED ON RST CATCH DATA AS A FUNCTION OF RESERVOIR ELEVATION RANGE
            (DENOTED BY HORIZONTAL LINE). ...................................................................................................................39
FIGURE 26   KOKANEE SMOLT ABUNDANCE (FROM RST CATCH) VERSUS NUMBER OF DAYS THE BUNTZEN DIVERSION TUNNEL WAS
            IN USE DURING THE MONTH OF MAY FROM 2008 TO 2013. ............................................................................... 40
FIGURE 27   COUNT OF CAPTURED ADULT SOCKEYE SALMON IN THE COQUITLAM RIVER. LIVE FISH WERE TRUCKED AND RELEASED
            INTO THE COQUITLAM RESERVOIR. THE MAJORITY OF DEAD FISH IN THE TRAPS WERE THE RESULT OF RIVER OTTER
            PREDATION. ............................................................................................................................................... 42
FIGURE 28   COQUITLAM DAM SURFACE SMOLT PASSAGE CONCEPT. ......................................................................................53
FIGURE 29   PRODUCTIVITY TIME SERIES FOR PITT RIVER SOCKEYE AND RETURNS PER SPAWNER (GRANT AND PESTAL 2012)............55
FIGURE 30   ESCAPEMENT AND OPERATIONAL REFERENCE POINTS FOR EARLY SUMMER SOCKEYE (ENGLISH ET AL. 2011A)...............56
FIGURE 31   ESTIMATES OF TOTAL CATCH, ESCAPEMENT AND EN-ROUTE LOSS FOR EARLY SUMMER FRASER SOCKEYE, 1980–2009.
            EN-ROUTE LOSSES WERE NOT ESTIMATED PRIOR TO 1992 (ENGLISH ET AL. 2011A). ................................................57
FIGURE 32   ESTIMATES OF TOTAL ANNUAL ABUNDANCE AND EXPLOITATION RATES FOR FRASER SOCKEYE BY RUN-TIMING GROUP
            FOR THE PERIOD 1980–2009 (ENGLISH ET AL. 2011A). .................................................................................... 57
FIGURE 33   COMPARISON OF TIME TRENDS IN SCALED KALMAN FILTER SERIES FOR THE EARLY SUMMER TIMING GROUP, BY BROOD
            YEAR. TO ALLOW COMPARISONS ACROSS STOCKS, EACH SERIES IS SCALED TO ITS OWN MEAN AND IS SHOWN IN
            STANDARD DEVIATION UNITS FROM THAT MEAN (PETERMAN AND DORNER 2011). ................................................. 58
FIGURE 34   RECENT SMOLT-RECRUIT SURVIVAL FOR CULTUS LAKE SOCKEYE SALMON, FOR WILD SMOLTS, SMOLTS RESULTING FROM
            SUMMER AND FALL FRY RELEASES TO THE LAKE, AND FROM YEARLING SMOLT RELEASES MADE IN SWELTZER CREEK, THE
            OUTLET OF CULTUS LAKE. ALSO SHOWN ARE SURVIVAL RATES FOR CHILKO LAKE SOCKEYE SALMON, LOCATED IN UPPER
            FRASER RIVER BASIN (CSAS 2010). ...............................................................................................................59
FIGURE 35   FLOW CHART FOR ALL STEPS OF SOCKEYE RE-ESTABLISHMENT INTO COQUITLAM RESERVOIR. .....................................64

                                                                                                                                                    vii | P a g e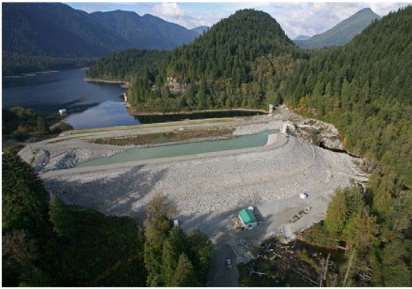
Knowledge Synthesis and Re-Establishment Plan for Coquitlam Reservoir Sockeye Salmon

ACKNOWLEDGEMENTS
The KSRP members have spent many hours to fulfill the dream of Sockeye, Coho and Steelhead re-
introduction into Coquitlam Reservoir and worked together with the Kwikwetlem First Nation and the
Watershed Watch Salmon Society to commission the writing of this report. Craig Orr helped to write the
proposal for this report. Norm Fletcher gave valuable advice with regards to the Coquitlam Dam History
and construction detail and provided a summary of the Al Grist Memorial Hatchery operations.

Alexis Hall and Alf Leake and Brent Wilson (BC Hydro) provided all operational data for the Coquitlam-
Buntzen Project and gave feedback on the initial report design.

Metro Vancouver under the lead of Dave Dunkley and Heidi Walsh gave valued feedback throughout the
report writing. Matt Foy and Maurice Coulter-Boisvert of the Department of Fisheries and Oceans (DFO)
Canada provided the DFO perspective on the report and all aspects of this salmon re-introduction
initiative.

Other KSRP members that shaped this initiative over time are Tony Matahlija, Diane Ramage as well as
Margaret Birch (City of Coquitlam) and Steve Brown (City of Port Coquitlam).

Many others that are not named in this report contributed to the KSRP initiative over time and the
authors apologize for the omission of their names and contributions.

The writing of this report was funded by a Fish and Wildlife Compensation Program grant to the
Watershed Watch Salmon Society and the Kwikwetlem First Nation. The Fish and Wildlife Compensation
Program is a partnership between BC Hydro, the Province of B.C., Fisheries and Oceans Canada, First
Nations and public stakeholders.

                                                                                            viii | P a g e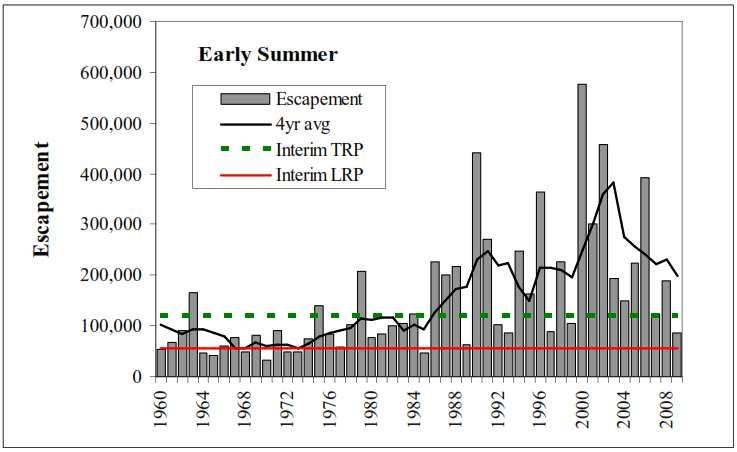
Knowledge Synthesis and Re-Establishment Plan for Coquitlam Reservoir Sockeye Salmon

INTRODUCTION
Report Background and Objectives
All salmon and other anadromous species were wiped out from upstream areas, as access to spawning
and rearing habitat was blocked when Coquitlam Dam was completed in 1914, as part of the Coquitlam
Hydroelectric Project. At the same time, a population of Kokanee (landlocked Sockeye) survived in
Coquitlam Reservoir, which is much larger than natural Coquitlam Lake (Figure 6). Small numbers
(generally
Knowledge Synthesis and Re-Establishment Plan for Coquitlam Reservoir Sockeye Salmon

    3. To define and develop plans for Sockeye smolt production and outmigration that will increase
       returns of adult Sockeye to the reservoir;
    4. To identify monitoring requirements and adaptive management opportunities including decision
       points for achieving plan goals; and
    5. To present this plan to KSRP members, the Fish and Wildlife Compensation Program (FWCP) and
       to BC Hydro for approval.

Restoring anadromous fish access to Coquitlam Reservoir is a complex matter. Bocking and Gaboury
(2002) established a framework for the evaluation of restoring fish passage for anadromous species
upstream of hydroelectric dams. The framework addresses key biological, physical, operational and
structural issues related to restoring fish passage.

The writing of this report aligns with the “Design Establishment Phase of Fish Passage” step in BC
Hydro's Fish Passage Decision Framework (Figure 1) and is a necessary step toward the successful
restoration of Coquitlam Lake salmon stocks.

Figure 1        Decision process for “phased” approach to designing and implementing a fish passage
                plan for the Coquitlam watershed.

                                                                                              2|Page
Knowledge Synthesis and Re-Establishment Plan for Coquitlam Reservoir Sockeye Salmon
Coho and Steelhead salmonid stocks will also benefit from the facilities developed to restore Sockeye
Salmon when access is provided to suitable spawning habitats above the dam. In addition, Chinook,
Chum and Pink Salmon may also benefit but these species typically spawn in river areas downstream
from lakes. Migratory Cutthroat Trout and Bulltrout may also take advantage of the reservoir and its
tributaries for rearing and spawning should a fish ladder be built. To account for outstanding
uncertainties and the transition to more targeted actions, an adaptive management approach is
recommended. By incorporating this approach, future information, gained as part of the KSRP process,
can be incorporated in stride to reduce uncertainties and guide decisions going forward. The benefits of
this report are anticipated to be:
1. Development of a Stock Establishment Plan;
2. Identification of future actions required; and
3. Continuation of the collaborative framework for investigating and implementing fish passage
facilities at Coquitlam Dam.
Physical Setting and Existing Hydro Facilities
The Coquitlam Watershed is located in the lower mainland of British Columbia, about 30 km northeast
of Vancouver, in the southernmost extension of the Pacific Ranges of the Coast Mountains. It is 253 km2
in area (193 km2 or 76% above the dam and 60 km2 or 24% below) and ground elevations range from
153 m to over 2000 m. All of the Sockeye Salmon spawning and rearing habitat in the watershed exists
above the dam. The Coquitlam River flows from the Coastal Mountains through the cities of Coquitlam
and Port Coquitlam and from there into the Fraser River. Coquitlam Dam which was built in 1904–1905
was upgraded to its current 30 m height in 1914. Coquitlam Reservoir was created by and is located
above the Coquitlam Dam (Figure 2) and is part of the BC Hydro Coquitlam-Buntzen hydro- generating
system (Figure 3, Figure 4) and the Metro Vancouver drinking water system.
Water for generating power flows from the reservoir via a 3.9 km tunnel to Buntzen Reservoir where
530 m and 170 m penstocks lead to powerhouses located on the Indian Arm of Burrard Inlet (BCRP
2000) (Figure 3).
The Coquitlam basin is open to south-westerly flows of warm, moist air, which bring heavy rainfall.
Approximately 50% of annual precipitation normally falls between October and January. Average
precipitation in November is 600 mm; however, it can reach levels of 1,000 mm or more (FWCP 2011).
The high precipitation of the area results in a high flushing rate typical of coastal lakes. The lake has a
volume of 1,044,000 m3, a mean depth of 87 m and a surface area 12 km2. The annual inflow of
725,000 m3 results in a water exchange rate of 0.69 times per year or a complete exchange time of
1.4 years using full pool volume (Nordin and Mazumder 2005).
3|PageKnowledge Synthesis and Re-Establishment Plan for Coquitlam Reservoir Sockeye Salmon
Figure 2 Picture of Coquitlam Dam (Stuart 2010).
Figure 3 Coquitlam-Buntzen hydro generating complex (KSRP Committee).
4|PageKnowledge Synthesis and Re-Establishment Plan for Coquitlam Reservoir Sockeye Salmon
Figure 4 Coquitlam-Buntzen system diagram (Bocking and Gaboury 2003).
Coquitlam Reservoir has a maximum depth of approximately 187 m (Stockner 2003). It has steep rocky
shores on the east shores of the central main basin and on the shallower secondary basin at the north
end. Coquitlam Dam is located at the south end of the main basin (Figure 2). The tunnel to Buntzen
Reservoir is located on the south west shore of the main basin. The main tributaries to Coquitlam
Reservoir are the Upper Coquitlam River and Alpine Creek at the north end, Harmony Creek entering the
central basin from the west, Falls Creek and Cedar Creek entering the central basin from the east and
Beaver Creek entering the reservoir from the southwest.
Before inundation, Coquitlam Lake was shorter on the shallow north and south ends and did not
inundate the area east of the main island and the mouth of Cedar Creek (Figure 6).
5|PageKnowledge Synthesis and Re-Establishment Plan for Coquitlam Reservoir Sockeye Salmon
Figure 5 Bathymetry of Coquitlam Reservoir with water sampling station numbers (Bussanich et
al. 2006a).
6|PageKnowledge Synthesis and Re-Establishment Plan for Coquitlam Reservoir Sockeye Salmon
Figure 6 Two-dimensional map of Coquitlam Lake showing the shore of Coquitlam Lake before
inundation as a red line and the current lake shore at the edges of the blue area (Metro
Vancouver).
In total, Coquitlam Reservoir has four outlet structures. The largest of these in terms of release
magnitude is a free crest weir located on the east side of the dam, which is capable of releasing roughly
1100 m3/s at probable maximum flood. The spillway is carved into the bedrock to the left of Coquitlam
Dam when looking downstream and is positioned above a tunnel that delivers the discharge from a
Sluice Tower adjacent to the dam. The Sluice Tower is the second largest outlet and it can deliver a
maximum of 52 m3/s to the Coquitlam River. The Sluice Tower has 5 outlets (two fish flow valves (FV),
each capable of delivering a maximum of 0.85 m3/s, and three Low Level Outlets (LLOs) capable of
delivering 17 m3/s each at maximum flow). In 2008, one of the LLOs (LLO3) was retrofitted with a new
“knife gate valve” style gate to allow for finer flow adjustments and deliver larger volumes of water with
less wear to the gate infrastructure (Figure 7).
7|PageKnowledge Synthesis and Re-Establishment Plan for Coquitlam Reservoir Sockeye Salmon
Figure 7 Knife gate valve installed in 2008 at one of the LLOs in the Coquitlam Dam gatehouse
(BC Hydro Engineering 2009).
Since 2008, the LLO3 with newly installed knife valve has been the principal structure delivering
downstream flow releases to the Coquitlam River (Figure 7). The FVs are now rarely used.
The third outlet is a tunnel located roughly 3.4 km upstream of the dam (about a quarter of the way up
the reservoir) that is capable of delivering a combined maximum discharge of 40 m3/s through two
separate gates into the neighboring Buntzen Reservoir. The Buntzen Reservoir diversion intake is located
at elevation 130 m, which is 20 m below the full-inundation level of 150 m and 10.2 m below the LLO at
the Coquitlam Dam gatehouse. Once in Buntzen Reservoir, these inflows are used to supply the Buntzen
generating stations situated on the shores of Indian Arm. On rare occasions, the water can also be used
to supply cooling waters for the Burrard Thermal Generating Station located on the shores of Burrard
inlet or up to 45 m3/s can be spilled directly into Indian Arm.
The last of the four outlet structures is an intake tower that supplies domestic drinking water to Metro
Vancouver. The structure has three rotating screened (screen size 1 cm2) intakes located at different
elevations. Combined, these three intakes are capable of delivering a total of 13.7 m3/s to Metro
Vancouver’s drinking water system (Lewis et al. 1996). The Metro Vancouver intake structure is also
equipped with a diversion pipe and valve system capable of diverting up to 0.87 m3/s to the Coquitlam
River downstream of the dam. However, the diversion pipe is no longer in use but remains functional.
The Metro Vancouver diversion pipe may represent a suitable water supply structure to deliver ample
gravity fed water to a potential fish hatchery below Coquitlam Dam. Coquitlam Reservoir has been used
for domestic water supply for Metro Vancouver since the early 1900s and is a dedicated drinking water
reservoir with restricted public access since the early 1980s.
8|PageKnowledge Synthesis and Re-Establishment Plan for Coquitlam Reservoir Sockeye Salmon
The maximum possible annual draw down through the four outlet structures is about 13 m (low of
137 m, high of 150 m) and represents about half of the reservoir’s maximum storage volume.
Another structure of note is a gravity fed adult salmon trapping facility located immediately downstream
of the dam. Outflows from the trap serve as the headwaters for the Grant’s Tomb side channel and
rearing pond.
Coquitlam Reservoir Hydro Operations
Coquitlam Lake Reservoir operations can be described as having two phases during the Sockeye data
collection period (2005 to present). During the pre-Water Use Plan (WUP) phase, water releases from
the Sluice Tower to the Lower Coquitlam River were delivered through two smaller “Fish Flow Valves”
(FVs) that were kept fully open year round. Starting with the WUP phase and the installation of the new
LLO3, Sluice Tower discharges followed monthly flow release targets set by the WUP. If water was in
short supply, only a minimum discharge of 1.1 m3/s was maintained into the Lower Coquitlam River
(Table 1). The initial FVs, as well as the later modified LLO3 outlet, are located in three sluiceways, all of
which can be opened to allow for larger releases of water.
Discharge through the FVs to the Coquitlam River during the pre-WUP phase averaged 1.0 m3/s, and
typically ranged from 0.4 to 1.5 m3/s during non-outage periods depending on reservoir elevation. In
addition to these releases, the Greater Vancouver (later Metro Vancouver) Water District (GVWD)
provided a minimum of 0.25 m3/s of water to supply the Grant’s Tomb channel network on the lower
river. These pre-WUP releases ended on October 21, 2008, when flows to the Coquitlam River were
switched over to the new LLO structure and began to follow the WUP release schedule (Figure 8).
9|PageKnowledge Synthesis and Re-Establishment Plan for Coquitlam Reservoir Sockeye Salmon
Table 1 Monthly targeted flow releases from Coquitlam Reservoir to the Coquitlam River as
described in the system’s Coquitlam Buntzen Project Water Use Plan (BC Hydro 2005).
LLO Release (m 3/s) LLO Release (m 3/s)
Month Month
Target Minimum Target Minimum
Jan 1 - 15 5.90 3.60 Jul 1.20 1.10
Jan 16 - 31 2.92 2.92 Aug 2.70 1.10
Feb 2.92 2.92 Sep 2.22 1.10
Mar 4.25 1.77 Oct 6.07 3.59
Apr 3.50 1.10 Nov 3.96 1.49
May 2.91 1.10 Dec 5.00 2.51
Jun 1.10 1.10
Of particular note in Figure 8 for the FV and LLO releases are two years where short-term flow pulses
were delivered downstream during the April 1–June 15 Sockeye smolt monitoring period. In 2010, a
single 7-day, 6 m3/s flow pulse was delivered starting May 12, while in 2011, two such pulses were
released: one starting April 27 and the other May 13. In both years, the pulse releases were an attempt
to increase Sockeye smolt output by increasing attraction flows to the LLO3. Also of note were the high
releases in 2009, where LLO discharge averaged 5.5 m3/s throughout the migration period.
In addition to the FV and LLO controlled releases, there were a number of sluice valve spills, many of
which reached 40 to 45 m3/s in magnitude (Figure 9). The sluice valves, LLOs and FVs are inside the
Sluice Tower and only LLO3 and FVs are used on a regular basis. LLO3 is a throttleable sluice gate that
can provide flows of 0 to 9m3/s. All sluice gate releases occurred during the pre-WUP phase of facility
operations during the fall and winter months, of particular note were a series of small spills that
occurred during the Sockeye smolt outmigration period. The first was a 7-day spill in 2005 that started
April 22 and had a magnitude of approximately 5.2 m3/s. This was followed by another test spill in 2006
when sluice gate spill duration was increased to 21 days. For this release, the start date was a day earlier
as the previous year (April 21) and discharge averaged 5.0 m3/s. The last trial sluice gate spill occurred in
2008, when the duration was cut back to 7 days. The start date was moved to April 29, and the average
discharge increased to 8.4 m3/s. Also of note, no sluice gate spill occurred in 2007 during the Sockeye
out migration period; however, there was a significant sluice gate release that started several weeks
earlier on March 16. Peak discharges approached 40.5 m3/s and the spill lasted to April 2. Unlike other
spills, the 2007 event was not intended as an experimental trial to increase Kokanee smolt outmigration.
Rather it was related to flood risk management. Throughout these sluice gate spill events, the FV gates
were also fully opened and added roughly 1 m3/s to the total discharge into the Lower Coquitlam River.
10 | P a g eKnowledge Synthesis and Re-Establishment Plan for Coquitlam Reservoir Sockeye Salmon
2011
2010
2009
Figure 8 Plot of Coquitlam Dam releases (m3/s) to the Lower Coquitlam River from 2003 to 2013.
During pre-WUP releases (up to October 2008, green lines), FVs were fully open year
round to deliver downstream flows based on prevailing reservoir elevation. Post WUP
implementation discharges (2008 onward, burgundy lines) through the new LLO mostly
followed a specified monthly WUP target (red line).
Figure 9 Sluice gate discharges from 2003 to 2008. Of particular note are pulse flow trials of
2005, 2006 and 2008, and the natural spill of 2007, all of which occurred either just
before or during the smolt outmigration monitoring period of April 1–May 31.
11 | P a g eKnowledge Synthesis and Re-Establishment Plan for Coquitlam Reservoir Sockeye Salmon
The water releases through the FVs, the LLOs, and the spill sluice valves in combination with releases
through the Buntzen Tunnel, determine the elevation of Coquitlam Reservoir. Reservoir elevations were
highly variable during the 2003–2013 period (Figure 10). There are two time periods to consider. Prior
to 2008, reservoir elevation was managed to 149 m above sea level (all elevation levels are listed as
above sea level or “asl” for standardization) due to dam safety concerns. After the new dam was
constructed this constraint was removed. Overall, elevations ranged from 141.25 to 152.42 m and at no
time did they converge to a narrow band between years (signifying a constraint in operations). The only
consistent pattern was a tendency for elevations to reach their yearly lows in April and to increase as a
result of spring freshet over the course of the following two months. Reservoir elevation tended to drop
thereafter to another seasonal low by the end of September, after which it fluctuated wildly in response
to fall and winter rain storms. Spring freshet flows have made it difficult to maintain a steady low
reservoir elevation during the smolt outmigration period. From the April low, elevations typically rose
2−4 m by the end of June. An additional 4–6 m of elevation change could be attributed to between year
differences in the seasonal April low values. Overall, reservoir elevations could be expected to be
anywhere within a 5 m range (145–150 m) during the main smolt outmigration period in May and
depended largely on the timing and magnitude of yearly inflows and the releases out of all four reservoir
outlets.
Figure 10 Plot of Coquitlam Lake Reservoir daily average water surface elevations from 2003 to
2013.
It should be noted that pre-2008 fluctuations in reservoir elevation had the potential to directly impact
hydraulic conditions in the FVs because FVs were kept fully open year round and changes in elevation
determined the discharge out of these structures. Higher elevations created greater discharges and
higher velocities through the FVs and increased the distance between the water surface and the intake
structures, thus reducing the potential for fish attracting surface flows. The higher velocities in turn
likely led to higher mortalities in outmigrating smolts. This fish unfriendly scenario was typical for pre-
12 | P a g eKnowledge Synthesis and Re-Establishment Plan for Coquitlam Reservoir Sockeye Salmon
WUP operations at the Coquitlam Dam Sluice Tower. After implementation of the WUP-discharges and
the installation of the new LLO3, outlet openings were changed to accommodate the changes in water
elevation. This in turn led to changes in accompanying velocities in the LLO. For example, a given
discharge at high reservoir elevation required a smaller gate opening and hence a faster velocity through
the LLO. At low reservoir elevations, a wider LLO opening was required to deliver the targeted discharge,
hence lowering velocity through the LLO. The acceleration and turbulence created by changing velocity
conditions through the LLO was likely a factor determining the condition and/or extent of mortality in
out-migrating smolts. During high velocities through the LLO the plume of water entering the tunnel to
the Coquitlam River hits the far wall before cascading to the tunnel floor and then downstream out into
the river. This scenario is a source of smolt injury and/or mortality during outmigration. Nevertheless, it
appears that low reservoir levels and higher discharges through the new LLO may be the most
favourable condition for smolt out migration, especially if the survival through the LLO can be improved
through structural changes.
The effects of variable reservoir elevations are not restricted to FV and LLO hydraulics, but have
upstream implications as well. The entrance to the forebay, the narrowest spot between the reservoir
and the dam outlet, is located about 300 m upstream from the Sluice Tower. Only at low reservoir
elevations and high sluice discharges are any fish attracting surface flows possible at the forebay
entrance. During high reservoir elevations and low discharges, no surface flows are noticeable and
therefore likely no smolt attracting surface flows exist. It has been shown that Sockeye smolts use
velocity gradients and that they are negatively rheotactic (Hartman et al. 1967) as a means to detect
lake outlets. In the case of Coquitlam Reservoir, the morphology of the forebay and targeted discharges
do not create detectable currents to attract out-migrating smolts.
Of all the discharge facilities on the reservoir, water extraction for the GVWD (now Metro Vancouver)
drinking water has always been the most stable within a given year and the most consistent between
years. From 2003 to 2013, daily median discharge typically centered around 4 m3/s for much of the year,
the only exception being a near doubling of outflow during the summer months (Figure 11). The GVWD
water supply intakes are well screened to prevent debris and other organic matter form entering the
system. As a result, this outflow has generally been considered to not impact on Sockeye smolt
outmigration.
13 | P a g eKnowledge Synthesis and Re-Establishment Plan for Coquitlam Reservoir Sockeye Salmon
Figure 11 Discharges from the Coquitlam Lake Reservoir, 2003–2013, illustrating the relative
constancy and small volume of GVWD extractions (red line, average values over the
2003–2013 period).
Kwikwetlem Salmon Restoration Program (KSRP)
The initial priority of the KSRP is to commence restoration of the Sockeye Salmon run to Coquitlam
Reservoir by utilizing the BC Hydro Fish Passage Framework. The KSRP was founded in 2003 and its core
team members are representatives of the Kwikwetlem First Nation, Department of Fisheries and
Oceans, Metro Vancouver, City of Coquitlam, BC Hydro, the Watershed Watch Salmon Society and the
British Columbia Ministry of Environment. Many other organizations have contributed over the years.
The KSRP core team meets as required to plan upcoming studies and coordinate the submission of
proposals for project funding. The KSRP team partners with local volunteer organizations and consulting
companies to build the knowledge base for re-introduction of Sockeye and other salmon species into
the reservoir. In addition, the KSRP seeks advice through other subject experts and is supported by
many hours of voluntary contribution.
The Past of Coquitlam Reservoir Salmonids from Oral History, Written History
and Genetic Results
Archeological evidence suggests the deep-rooted connection of the Kwikwetlem First Nation to the
Coquitlam Watershed dates back thousands of years (Koop 2001) and the literal translation of the word
“Kwikwetlem” is “red fish up the river”. Therefore, although never scientifically enumerated, the
historical Sockeye Salmon runs to the Coquitlam Lake were likely substantial.
Coquitlam Lake, before the construction of the Coquitlam Dam, was also the home to at least three
other anadromous salmon species. While Sockeye migrated into the system early from April to July,
Coho Salmon entered in October and Chum Salmon and Steelhead Trout were also found in the lake and
its tributaries but their migration timing is unknown (Koop 2001). In addition to Kwikwetlem First Nation
oral history, the same four species were mentioned by federal and provincial governments in the late
1800s and the early 1900s in context with Coquitlam Lake (Koop 2001).
Although Sockeye Salmon were extirpated from the Coquitlam River watershed following construction
of the Coquitlam Dam, a Kokanee population persists to this day in the reservoir. This Kokanee
14 | P a g eKnowledge Synthesis and Re-Establishment Plan for Coquitlam Reservoir Sockeye Salmon
population is likely the offspring of the now extinct anadromous form of Sockeye Salmon and not a
“true” or sympatric Kokanee population that co-existed with the anadromous Sockeye. Evidence for this
theory is based on genetics and fish morphology. Given the easy access into Coquitlam Lake prior to the
construction of the dam coupled with the low productivity of Coquitlam Lake, and the dull coloration at
maturity, it is likely that the current Kokanee are direct descendants of the original anadromous Sockeye
form. In addition, the genetic fingerprint and morphometric traits (gill raker length and number) of
Coquitlam Kokanee are very similar to the ones found in the Sockeye-Kokanee hybrid stock of Alouette
Reservoir (Bussanich et al. 2006b; Nelson and Wood 2007). Godbout et al. (2011) also found that re-
anadromized Coquitlam Sockeye had low genetic diversity, a typical sign of a population that had
survived a genetic bottleneck or originated from very few individuals.
STUDIES ON COQUITLAM SALMON SPECIES HISTORY AND CURRENT
ESCAPEMENT
Sockeye Salmon
The primary species of interest for re-establishment into Coquitlam Reservoir is Sockeye Salmon.
Sockeye Salmon were (and continue to be) highly valued by the Kwikwetlem First Nation members as a
significant portion of their diet (G. Joe, Kwikwetlem First Nation. pers. comm.). Sockeye Salmon also
have the greatest biomass production potential as evidenced by the existing Kokanee biomass in the
reservoir (Bussanich et al. 2006a; Plate et al. 2011; Plate et al. 2012). Re-establishment of a self-
sustaining population of Sockeye Salmon would be considered as part of a corrective action to offset
damage done by the construction of the dam, described as a critical footprint impact on the Coquitlam
River system (FWCP 2011).
Sockeye Salmon can occur as three distinct ecotypes:
1. An anadromous lake type which rears in lakes as a juvenile before emigrating to the ocean to
grow and mature then return to freshwater to spawn and die;
2. An anadromous sea or river type which rears in rivers as a juvenile before emigrating to the
ocean to grow and mature then return to freshwater to spawn and die; and
3. A non-anadromous type called Kokanee which spends its entire life cycle in fresh water
(Godbout et al. 2011).
The Coquitlam watershed originally supported a run of Sockeye Salmon (Bengeyfield at al. 2001; Koop
2001; Godbout et al. 2011) that returned to the lake in late spring (from April to July). Therefore
Gaboury and Bocking (2004) proposed that the probable run timing of Coquitlam Sockeye would be a
return of adults from April through July with subsequent spawning from September through November.
This timing would lead to egg incubation and in-gravel rearing of alevins from September to March.
Smolt migration would likely occur from April to mid-June. It is now known that Coquitlam Sockeye
return to the Coquitlam River from July through August, which is later than the historically reported run
timing. Migration timing for the re-introduced Coquitlam Sockeye is therefore expected to be similar to
the timing for Alouette Reservoir and Pitt Lake Sockeye stocks, which is in line with other Early Fraser
River Sockeye stocks (Figure 12).
15 | P a g eKnowledge Synthesis and Re-Establishment Plan for Coquitlam Reservoir Sockeye Salmon
Figure 12 Relative arrival timing of Alouette Sockeye at the ALLCO fish fence in comparison to
timing through the lower Fraser River for the main Fraser River run timing groups (02-09
average) (Noble 2011; Plate and Bocking 2013).
Since the return of adult Sockeye to the Coquitlam Reservoir has been monitored starting in 2007,
annual return totals have ranged from 11 fish in 2008 to 1 fish in 2009 (Figure 27). While Sockeye
movement has not been tracked in the reservoir, it is known that Coquitlam Reservoir Kokanee spawn in
October (Plate et al. 2011, 2012) and it is assumed that their direct anadromous descendants would
spawn at the same time. Alouette Sockeye descendants from Kokanee showed this behavioural pattern
(Plate and Bocking 2010, 2011, 2013).
While Sockeye smolt outmigration from Coquitlam Reservoir since 2005 has been highly variable and at
lower levels than have been experienced at Alouette Reservoir the migration timing appears to be
similar. Typically, Alouette Sockeye smolts migrate from mid-April until late May or early June (Baxter
and Bocking 2006; Humble et al. 2006; Mathews and Bocking 2007, 2009, 2010, 2011; Mathews et al.
2012, 2013, and 2014 In Press). Coquitlam smolt estimates at the Rotary Screw Trap (RST) site 3,
approximately 1.6 km downstream of Coquitlam Dam, have ranged from a minimum of 19 smolts in
2008 to a maximum of 1,531 smolts in 2005 (Table 5).
Prior to the construction of Coquitlam Dam, anadromous Sockeye Salmon likely spawned along the
shores of Coquitlam Lake and in its adjoining tributaries. Current studies have been researching the
genetic linkage between the recent observations of Kokanee Salmon (Sockeye Salmon) smolts migrating
16 | P a g eKnowledge Synthesis and Re-Establishment Plan for Coquitlam Reservoir Sockeye Salmon
from the Coquitlam Reservoir and the returning Sockeye Salmon adults. These studies have determined
that the outmigrating smolts were the progeny of the Coquitlam Reservoir Kokanee Salmon population
(Nelson and Wood 2007; Godbout et al. 2011). These genetic investigations also suggest that the
Coquitlam Kokanee Salmon population originated from relatively few anadromous individuals that
residualized after their downstream migration was blocked (Nelson and Wood 2007; Godbout et al.
2011).
Coho Salmon
Coho Salmon likely used several Coquitlam Lake tributaries for spawning prior to dam construction and
entered the system annually in October (Koop 2001). The lower reaches of Cedar Creek, Beaver Creek,
and the lower reaches of the Upper Coquitlam River, all now inundated, appeared to have been used by
Coho Salmon for spawning (Koop 2001; Bocking and Gaboury 2003). The number of Coho Salmon
returning to any tributary before dam construction is undocumented but the timing of different life
stages currently found in the Lower Coquitlam River was likely the timing for the same stages in the
reservoir tributaries before the dam was built. Coho Salmon currently start to enter the river in late
October to spawn in November and December and their eggs incubate until April–May (Figure 13).
Typically, following a one year freshwater residence, Coho smolts leave the system from April to June.
Following dam construction, Chum, Coho, Steelhead and Pink Salmon continued to return the Coquitlam
River below the dam in substantial numbers until the mid-1950s after the results of a large landslide and
flood control dredging and channelling damaged much of the river bed. While some records of
escapement numbers exist for the period between dam construction and 2001, reliable escapement
numbers for all salmon species and Steelhead trout were gathered from 2002 through 2012 as part of
COQMON-7, the “Lower Coquitlam River Fish Productivity Index” (Schick et al. 2013).
Based on fish counts and subsequent Area Under the Curve (AUC) estimates in combination with mark
recapture experiments carried out by Schick et al. between 2002 and 2011, Coho escapement to the
lower Coquitlam River ranged from 878 fish in 2008 to 12,338 fish in 2010 (36–480 females/km) (Figure
14) with a decadal average of 4253 (±3,556 STDEV) (Schick et al. 2013). Within this range, the three
largest escapements were estimated for the last three years of data available from 2010 to 2012.
17 | P a g eYou can also read