2018 Waste Assessment - South Taranaki District Council
←
→
Page content transcription
If your browser does not render page correctly, please read the page content below
2018
Waste Assessment
South Taranaki District Council
SOUTH TARANAKI DISTRICT COUNCIL WASTE ASSESSMENT 2018
TABLE OF FIGURES
Figure 1 - Toolkit for Managing and Minimising Waste in Figure 20 - Annual Tonnage of Recycling from STDC Transfer
New Zealand . . . . . . . . . . . . . . . . . . . . . . . . . . . . . 5 Stations . . . . . . . . . . . . . . . . . . . . . . . . . . . . . . . . . 26
Figure 2 - Waste Hierarchy . . . . . . . . . . . . . . . . . . . . . . . . . . 6 Figure 21 - Annual Tonnage of Greenwaste from STDC
Figure 3 - Local Waste Policy Document Relationships . . . 9 Transfer Stations . . . . . . . . . . . . . . . . . . . . . . . . . . 26
Figure 4 - Mass Flow Diagram for South Taranaki 2015/16 16 Figure 22 - Waste, Greenwaste and Recycling from STDC
Transfer Stations 2011/16 . . . . . . . . . . . . . . . . . . 27
Figure 5 - Waste Disposed of to the Landfill between
1996/97 and 2015/16 . . . . . . . . . . . . . . . . . . . . . 17 Figure 23 - Annual Tonnage of Farm Plastic Recycled within
the Region by Plasback . . . . . . . . . . . . . . . . . . . . 28
Figure 6 - Tonnage of Waste Disposed at the South Taranaki
Transfer Stations 2010 - 2016 . . . . . . . . . . . . . . . 18 Figure 24 - Contamination at the MRF between June 2015
and June 2016 . . . . . . . . . . . . . . . . . . . . . . . . . . . . 30
Figure 7 - Comparison of Waste Activity Source for the
Three Main Transfer Stations in Taranaki. . . . . . 18 Figure 25 - Comparison of Presentation Rates between NPDC,
SDC and STDC . . . . . . . . . . . . . . . . . . . . . . . . . . . . 31
Figure 8 - Composition of Waste Disposed of at the Landfill
2016 . . . . . . . . . . . . . . . . . . . . . . . . . . . . . . . . . . . . 20 Figure 26 - Comparison of the Average Weight per Container
for Each Waste Stream between NPDC, SDC and
Figure 9 - Comparison of Landfill Composition by Tonnage
STDC . . . . . . . . . . . . . . . . . . . . . . . . . . . . . . . . . . . 32
between 2010 and 2016 . . . . . . . . . . . . . . . . . . . 20
Figure 27 - Presentation Rate for the Council Greenwaste
Figure 10 - Composition of Waste at the Hawera Transfer
Voluntary Kerbside Collection Service . . . . . . . . 33
Station . . . . . . . . . . . . . . . . . . . . . . . . . . . . . . . . . . 21
Figure 11 - Comparison of Waste Composition by Activity Figure 28 - Average Weight per Container for the Greenwaste
Source . . . . . . . . . . . . . . . . . . . . . . . . . . . . . . . . . . 21 Stream . . . . . . . . . . . . . . . . . . . . . . . . . . . . . . . . . . 33
Figure 12 - Composition of STDC Kerbside Bins General Waste Figure 29 - Annual Greenwaste Tonnage for South Taranaki
Contents 2016/17 . . . . . . . . . . . . . . . . . . . . . . . . . 22 Voluntary Kerbside Collection . . . . . . . . . . . . . . . 33
Figure 13 - Comparison of Kerbside Refuse between NPDC, Figure 30 - Annual Numbers of Visits to Council Transfer
SDC and STDC . . . . . . . . . . . . . . . . . . . . . . . . . . . . 22 Stations . . . . . . . . . . . . . . . . . . . . . . . . . . . . . . . . . 34
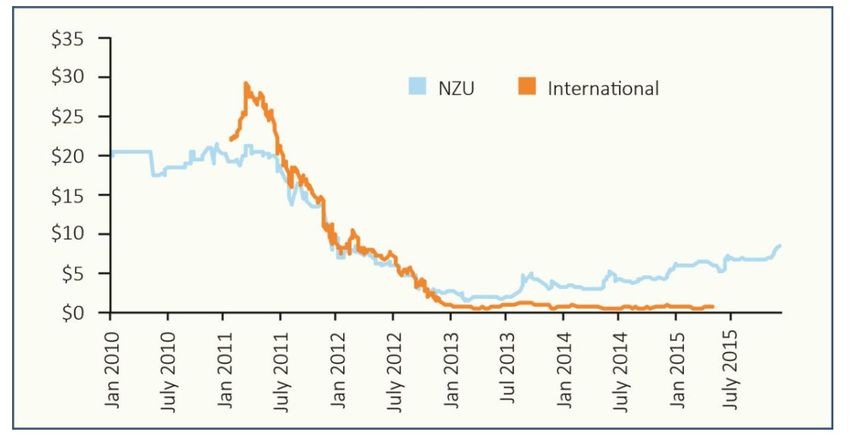
Figure 14 - Breakdown of Kerbside Organic Waste Figure 31 - Trend in Prices of Units in the NZ ETS from 2011 37
Composition per TA . . . . . . . . . . . . . . . . . . . . . . . 23 Figure 32 - Forecast Waste Generation by Waste Stream to the
Figure 15 - Quantities of Organic Waste Type per Bag/Bin Taranaki Regional Landfill . . . . . . . . . . . . . . . . . .
between Districts . . . . . . . . . . . . . . . . . . . . . . . . . 23 Figure 33 - STDC Waste to Landfill Projections . . . . . . . . . . . 39
Figure 16 - Proportion of Waste to Landfill Identified as Figure 34 - Commercial and Industrial Sector Workshop
Divertable . . . . . . . . . . . . . . . . . . . . . . . . . . . . . . . 24 Collated Response of Desired Changes . . . . . . . . 39
Figure 17 - Annual Recycling Tonnage for the South Taranaki Figure 35 - High Level Scenarios - Quantity of Waste
District Kerbside Collection Service . . . . . . . . . . 25 Landfilled (2020) . . . . . . . . . . . . . . . . . . . . . . . . . . 64
Figure 18 - Composition of Kerbside Bin Mixed Recycling Figure 36 - Scenarios - Quantity of Waste Landfilled vs
Contents . . . . . . . . . . . . . . . . . . . . . . . . . . . . . . . . 25 Total System Cost . . . . . . . . . . . . . . . . . . . . . . . . . 65
Figure 19 - Annual Greenwaste Tonnage for South Taranaki
District Voluntary Kerbside Collection . . . . . . . . 26
LIST OF TABLES
Table 1 - Summary of Waste Infrastructure and Table 9 - Quantity of Resources Diverted in the Region . . 29
Services in Taranaki . . . . . . . . . . . . . . . . . . . . . . . 11 Table 10 - Issues Associated with Contamination Found in
Table 2 - Taranaki Kerbside Collection Service . . . . . . . . . 14 the Recycling at the MRF . . . . . . . . . . . . . . . . . . . 30
Table 3 - Landfill Overall Waste by Activity Type . . . . . . . . 17 Table 11 - Visits and Tonnages Received at Each Rural
Table 4 - Source of Waste to the Landfill - 6 August - Transfer Station between 2013/14 and 2015/16 34
2 September 2016 . . . . . . . . . . . . . . . . . . . . . . . . 17 Table 12 - Summary of Progress Against 2012-17 WMMP
Table 5 - Activity Source of Hawera Transfer Station Targets . . . . . . . . . . . . . . . . . . . . . . . . . . . . . . . . . . 40
Waste - 14 - 17 September 2016 . . . . . . . . . . . . . 18 Table 13 - Options Analysis . . . . . . . . . . . . . . . . . . . . . . . . . . 45
Table 6 - STDC Kerbside Waste per Year . . . . . . . . . . . . . . 19 Table 14 - Statement of Options . . . . . . . . . . . . . . . . . . . . . . 46
Table 7 - Waste per Capita for each TA within the Region 19 Table 15 - Preferred Options . . . . . . . . . . . . . . . . . . . . . . . . . 59
Table 8 - Landfill - Potentially Divertable Materials in
Overall Waste Stream by Activity Source . . . . . . 24
SOUTH TARANAKI DISTRICT COUNCIL WASTE ASSESSMENT 2018

Contents
1 Introduction  .  .  .  .  .  .  .  .  .  .  .  .  .  .  .  .  .                                      4     		 2.7.1 Council-Provided Services  .  .  .  .  .  .  .  .  .  .  .  .                                           25
      1.1     Purpose of this Waste Assessment  . . . . . . . . .                                       5    		 2.7.2 Commercial and Informal Services  .  .  .  .  .                                                         27
      1.2     Legislative Framework . . . . . . . . . . . . . . . . . . .                               5      2.8 Assessment of South Taranaki Services . . . . . .                                                          30
      1.3     Structure of this Document . . . . . . . . . . . . . . .                                  6    		 2.8.1 Materials Recovery Facility .  .  .  .  .  .  .  .  .  .  .  .                                          30
      1.4     The Waste Hierarchy . . . . . . . . . . . . . . . . . . . . .                             6    		 2.8.2 Kerbside Service .  .  .  .  .  .  .  .  .  .  .  .  .  .  .  .  .  .  .  .                             31
      1.5     Completeness and Accuracy . . . . . . . . . . . . . . .                                   7    		 2.8.3 Transfer Stations .  .  .  .  .  .  .  .  .  .  .  .  .  .  .  .  .  .  .  .                            34
                                                                                                             		 2.8.4 Landfill Service  .  .  .  .  .  .  .  .  .  .  .  .  .  .  .  .  .  .  .  .  .                         35
2 The Waste Situation .  .  .  .  .  .  .  .  .  .  .  .                                               8       2.9 Future Demand  . . . . . . . . . . . . . . . . . . . . . . . . .                                           36
  2.1 Solid Waste Framework . . . . . . . . . . . . . . . . . .                                         8    		 2.9.1 Demographic and Economic Trends  .  .  .  .                                                             36
		 2.1.1 Waste Minimisation Act 2008 .  .  .  .  .  .  .  .  .                                          8    		 2.9.2 Market Forces .  .  .  .  .  .  .  .  .  .  .  .  .  .  .  .  .  .  .  .  .  .                          36
		 2.1.2 NZ Waste Strategy 2010 .  .  .  .  .  .  .  .  .  .  .  .  .  .                                9    		 2.9.3 National Direction .  .  .  .  .  .  .  .  .  .  .  .  .  .  .  .  .  .  .                              37
		 2.1.3 Health Act 1956 .  .  .  .  .  .  .  .  .  .  .  .  .  .  .  .  .  .  .  .  .                  9    		 2.9.4 Future Projection Waste Quantities  .  .  .  .                                                          38
		 2.1.4 Local Government Act 1974 and 2002  .  .                                                       9
		 2.1.5 Other Legislation .  .  .  .  .  .  .  .  .  .  .  .  .  .  .  .  .  .  .  .                   9    3 Where Do We Want to Be? .  .  .  .  .  .  .                                                                    40
  2.2 Regional and Local Strategic Context . . . . . . . .                                              9      3.1       Review of the existing WMMP targets  . . . . . .                                                     40
		 2.2.1 Regional Waste Strategy .  .  .  .  .  .  .  .  .  .  .  .  .  .                              10      3.2       Stakeholders’ Feedback . . . . . . . . . . . . . . . . . .                                           41
		 2.2.2 Taranaki Regional Waste Minimisation                                                                  3.3       Strategic Direction . . . . . . . . . . . . . . . . . . . . . . .                                    42
			         Education Strategy .  .  .  .  .  .  .  .  .  .  .  .  .  .  .  .  .  .                    10      3.4       Targets . . . . . . . . . . . . . . . . . . . . . . . . . . . . . . . .                              43
		 2.2.3 Long Term Plan (and Annual Plan) .  .  .  .  .  .                                             10      3.5       Gap Analysis  . . . . . . . . . . . . . . . . . . . . . . . . . . .                                  44
		 2.2.4 Bylaw .  .  .  .  .  .  .  .  .  .  .  .  .  .  .  .  .  .  .  .  .  .  .  .  .  .  .  .  .   10    		          3.5.1 Infrastructure  .  .  .  .  .  .  .  .  .  .  .  .  .  .  .  .  .  .  .  .  .  .               44
		 2.2.5 Policies .  .  .  .  .  .  .  .  .  .  .  .  .  .  .  .  .  .  .  .  .  .  .  .  .  .  .  .   10    		          3.5.2 Education .  .  .  .  .  .  .  .  .  .  .  .  .  .  .  .  .  .  .  .  .  .  .  .  .  .         44
  2.3 Existing Waste Infrastructure and Services . . .                                                 11    		          3.5.3 Policy .  .  .  .  .  .  .  .  .  .  .  .  .  .  .  .  .  .  .  .  .  .  .  .  .  .  .  .  .   44
		 2.3.1 Council-Provided Services and
			         Infrastructure  .  .  .  .  .  .  .  .  .  .  .  .  .  .  .  .  .  .  .  .  .  .           14    4 How Are we Going to Get There?  .                                                                              45
		 2.3.2 Commercial and Not-For-Profit Services .                                                      15      4.1 Statement of Options . . . . . . . . . . . . . . . . . . . . 45
  2.4 Current Waste Quantities . . . . . . . . . . . . . . . . .                                       16      4.2 Statement of Proposals  . . . . . . . . . . . . . . . . . . 59
		 2.4.1 Landfill Waste .  .  .  .  .  .  .  .  .  .  .  .  .  .  .  .  .  .  .  .  .  .               17      4.3 Theoretical Impact of Options on Forecast . . . 64
		 2.4.2 Transfer Station Waste .  .  .  .  .  .  .  .  .  .  .  .  .  .  .                            18      4.4 Council’s Intended Role in Meeting the Forecast
		 2.4.3 Kerbside Waste Quantities .  .  .  .  .  .  .  .  .  .  .  .                                  19    		 Demands . . . . . . . . . . . . . . . . . . . . . . . . . . . . . . 65
  2.5 Waste Generation per Capita . . . . . . . . . . . . . .                                          19    		 4.4.1 Statutory Obligations .  .  .  .  .  .  .  .  .  .  .  .  .  .  .  . 65
  2.6 Composition of Waste . . . . . . . . . . . . . . . . . . . .                                     20    		 4.4.2 Overall Strategic Direction and Role .  .  .  . 65
		 2.6.1 SWAP Results .  .  .  .  .  .  .  .  .  .  .  .  .  .  .  .  .  .  .  .  .  .  .              20      4.5 Medical Officer of Health Statement . . . . . . . . 66
		 2.6.2 Diversion Potential .  .  .  .  .  .  .  .  .  .  .  .  .  .  .  .  .  .                      23      4.6 Definitions . . . . . . . . . . . . . . . . . . . . . . . . . . . . . 67
  2.7 Diverted Materials  . . . . . . . . . . . . . . . . . . . . . .                                  25      4.7 Initials and Acronyms . . . . . . . . . . . . . . . . . . . . 69

                                                                                                                                                                                                                                   |3
SOUTH TARANAKI DISTRICT COUNCIL WASTE ASSESSMENT 2018 1 Introduction The Waste Minimisation Act 2008 (WMA) requires territorial authorities (TAs) to review and implement Waste Management and Minimisation Plans (WMMPs). The WMMPs are intended to be the guiding documents for TAs to promote and achieve effective and efficient waste management and minimisation within their District. The Waste Assessment (this document) establishes the planning foundation for the WMMP by providing background information. The TAs in the Taranaki region (the South Taranaki, New Plymouth and Stratford District Councils) are committed to collaborating regionally to achieve efficiencies and effectiveness in waste management. The Taranaki Regional Council (TRC) hosts the Taranaki Solid Waste Management Committee (TSWMC), on which each TA has a sitting member. The three TAs, New Plymouth (NPDC), South Taranaki (STDC) and Stratford (SDC) district councils and the TRC, contribute to funding a Waste Minimisation Officer (WMO) who serves the Committee and is central in implementing the Regional Waste Strategy and the WMMPs. The region has a single landfill and the TAs have awarded a single contract for the residential kerbside waste and recycling collection for the region. In continuing with this regional approach to waste management and minimisation, this Waste Assessment has been developed with input by the three TAs. A regional Waste Assessment template has been developed and regional waste data and regional options are considered where applicable. 4|
SOUTH TARANAKI DISTRICT COUNCIL WASTE ASSESSMENT 2018

1.1 Purpose of this Waste Assessment
As per Section 51 (1) of the WMA, a Waste Assessment must                                  (i) ensure that public health is adequately protected;
contain:                                                                                   (ii) promote effective and efficient waste management
a) a description of the collection, recycling, recovery,                                   and minimisation.
     treatment, and disposal services provided within the
     territorial authority’s district (whether by the territorial                    The Waste Assessment provides background information
     authority or otherwise); and                                                    to develop the WMMP. The Council’s objectives in developing
b) a forecast of future demands for collection, recycling,                           this WMMP are to:
     recovery, treatment, and disposal services within the                           • fulfil the statutory requirement to review the plan within
     District; and                                                                        six years;
c) a statement of options available to meet the forecast                             • provide transparency on how the Council will deliver on
     demands of the District with an assessment of the                                    objectives, policies and targets for waste management and
     suitability of each option; and                                                      minimisation;
d) a statement of the territorial authority’s intended role in                       • produce a document that is action oriented and provides
     meeting the forecast demands; and                                                    a guide for decision making and community collaboration;
e) a statement of the territorial authority’s proposals for                               and
     meeting the forecast demands, including proposals for                           • raise awareness of waste management and minimisation
     new or replacement infrastructure; and                                               within the community.
f) a statement about the extent to which the proposals
     will -

1.2. Legislative Framework
Waste in New Zealand is legislated by a number of Acts (Figure 1). Of primary importance is the Waste Minimisation Act 2008.

                                                         New Zealand Waste Strategy
                                                 LEGISLATIVE FRAMEWORK
           Waste              Local Government      Hazardous Substances and      Climate Change             Resource                OTHER TOOLS
    Minimisation Act 2008         Act 2002           New Organisms Act 1996      Response Act 2002      Management Act 1991
    Waste Management &                                Regulations and group                             National environmental          International
                                    Bylaws                                         Disposal facility
     Minimisation Plans                             standards related to water                                standards                  conventions
                                                                                                              District and       Ministry guideline codes of
     Waste Disposal Levy       Long Term Plans                                                             regional plans and           practice and
                                                                                                           resource consents       voluntary intitiatives
           Waste
      Minimisation Fund
     Product Stewardship

       Other regulations
FIGURE 1: Toolkit for managing and minimising waste in New Zealand1
1
    Source: Ministry for the Environment. 2010. The New Zealand Waste Strategy. Ministry for the Environment. Wellington.
                                                                                                                                                               |5
SOUTH TARANAKI DISTRICT COUNCIL WASTE ASSESSMENT 2018
1.3 Structure of this document
This Waste Assessment has been prepared in accordance with Section 2
section 51 of the WMA and follows the guidelines provided by
Where Do we Want to Be?
the Ministry for Environment2 (MfE).
This section documents our vision, goals, objectives and targets.
A gap analysis between this and our waste situation is provided.
Section 1
The Waste Situation Section 3
This section details the current situation of waste in Taranaki. It How Are We Going to Get There?
includes current waste infrastructure and services, current and This section includes a statement of options and the Council’s
projected quantities and composition of waste and diverted proposed role in delivering these options.
materials, demographic and market analysis, and a forecast for
future demand.
1.4 The Waste Hierarchy
MOST
preferred Avoid
behaviour
Reduce
Reuse
Recycle
Recover
Throughout this document, waste services
and facilities are generally categorised with
Treat reference to the Waste Hierarchy (Figure 2).
The WMA requires the waste hierarchy to be
considered when formulating WMMPs and
LEAST Dispose refers to the preferred order of waste minimisation and
preferred
management methods.
behaviour FIGURE 2: Waste hierarchy
2
Ministry for the Environment. 2015. Waste Assessments and Waste Management and Minimisation Planning - A guide for territorial authorities. Wellington :
Ministry for the Environment.
6|SOUTH TARANAKI DISTRICT COUNCIL WASTE ASSESSMENT 2018
1.5 Completeness and
Accuracy
The Council has a responsibility to plan for all waste
generated within the District when considering waste
infrastructure and services. It has detailed information
on the collection and facilities operated by it or on its
behalf. This includes Council-provided kerbside collection
services, transfer stations and the landfill.
However there is a range of private companies involved in
the collection, diversion of waste and alternative disposal
(e.g. cleanfills) within the District and wider region, from
which information is more difficult to capture. Surveys
have been undertaken to gain a wider understanding of
waste quantities and their destination, and this data is
used where applicable. However it must be noted that
the response rate from the surveys is generally low (less
than 15% response rate) and the data is therefore only
an estimate.
Initial consultation with the community and commercial
sector was held during the development of the
waste assessment to gain a broader understanding of
behaviour and perceptions with regard to waste. This,
in combination with the surveys and Council data is
sufficient to identify the areas that should be prioritised,
and to outline the role that the Council could potentially
play in resolving the issues relating to both Council and
non-Council controlled waste. Targeted consultation to
confirm the appropriateness of the proposed options
is prudent and will be sought through the Special
Consultative Procedure, which is required as part of the
development of the WMMP.
|7SOUTH TARANAKI DISTRICT COUNCIL WASTE ASSESSMENT 2018
2 The Waste Situation
This section contains information about waste and diverted material in the Taranaki region and in the South Taranaki District that
is generated, recycled, recovered, treated or disposed of to landfill. The information includes waste infrastructure and services,
and data about quantities, trends, composition, source and destination of waste and diverted materials. This information provides
the basis for projecting future demand for waste management and minimisation services, as presented at the end of this section.
Data has been collected from the following sources:
• landfill and transfer station weighbridge quantities;
• the findings from a landfill and transfer station solid waste analysis protocol (SWAP) conducted in September 2016;
• a kerbside SWAP conducted in November 2016, December 2016 and January 2017; and
• surveys of industries.
2.1 Solid Waste Framework
2.1.1. WASTE MINIMISATION ACT 2008 • Controlling disposal of material to landfills;
The WMA was developed with the purpose of encouraging • Providing a mechanism to report disposal tonnages back
waste minimisation and a decrease in waste disposal in order to the MfE to improve information on waste minimisation;
to: • Establishing a “waste advisory board” to advise the
• protect the environment from harm; and Minister on best practice; and
• provide environmental, social, economic and cultural • Collecting a levy on all solid waste tonnes deposited into
benefits. landfills to generate funding to help local government,
This is to be achieved by promoting waste minimisation communities and businesses reduce the amount of waste.
through reduction, re-use, recycling and recovery using the The WMA also aims to benefit the economy by encouraging
following measures: better use of materials throughout the product life cycle,
• Regulating product stewardship schemes focussing initially promoting domestic reprocessing of recovered materials and
on ‘priority’ products. This will help and, when necessary, providing more employment.
make producers, brand owners, importers, retailers, The WMA requires TAs to develop and adopt a WMMP, and
consumers and other parties take responsibility for the in doing so take into consideration the goals of the NZ Waste
environmental effects from their products at end-of-life – Strategy.
from ‘cradle-to-grave’;
8|SOUTH TARANAKI DISTRICT COUNCIL WASTE ASSESSMENT 2018
2.1.2. NZ WASTE STRATEGY 2010 2.1.5. OTHER LEGISLATION
The NZ Waste Strategy 2010 has two high level goals: Other legislation relevant to waste management and
• Reducing the harmful effects of waste, and minimisation includes:
• Improving the efficiency of resource use.
The Hazardous Substances and New Organisms Act 1996,
2.1.3. HEALTH ACT 1956 which addresses the management of substances that pose a
The Health Act 1956 places obligations on TAs (if required by significant risk to the environment and/or human health, from
the Minister of Health) to provide sanitary works. Under section manufacture to disposal; and relates to waste primarily through
25(1)(c) of this act, the definition of sanitary works includes controls on the handling and disposal of hazardous substances.
works for the collection and disposal of refuse.
The Resource Management Act 1991, which addresses
2.1.4. LOCAL GOVERNMENT ACT 1974 AND 2002 waste management and minimisation through controls on
The provisions of the LGA 1974, part 31 and the sanitary the environmental effects of waste activities. The National
assessment provisions for refuse contained in part 7 of the Environmental Standard for Air Quality requires certain landfills
LGA 2002 have been repealed and are now largely embodied in (greater than one million tonnes capacity) to collect landfill gases
the WMA. However, the LGA 2002 contains various provisions and either flare them or use them as fuel for generating electricity.
that may apply to TAs when they are preparing their WMMPs,
including consultation and bylaw provisions. For example, The Health and Safety at Work Act 2015, which is recognised as
it details the process for undertaking a Special Consultative a key priority for the waste industry. A health and safety industry
Procedure when adopting, amending or revoking a Waste sector group was formed and has developed guidelines for the
Management Plan (or WMMP as referred to in the WMA). solid waste industry to ensure best practice in health and safety.
2.2 Regional and Local Strategic Context
Some relationship exists between the WMMP and local strategies and policy documents (Figure 3).
NEW ZEALAND WASTE STRATEGY
REGIONAL WASTE MANAGEMENT AND MINIMISATION STRATEGY
COUNCILS WMMP
SOLID WASTE ASSET
MISSION STATEMENT COMMUNITY OUTCOMES
MANAGEMENT PLAN
FIGURE 3: Local Waste Policy Document Relationships
|9SOUTH TARANAKI DISTRICT COUNCIL WASTE ASSESSMENT 2018
2.2.1. REGIONAL WASTE STRATEGY Together South Taranaki: a District that leads with care, works
The purpose of the Regional Waste Strategy is to set out a together, advocates for its people and enables people to have a
strategic framework by which the TRC and the three TAs in the strong and distinctive sense of identity.
region will help to reduce and better manage waste in Taranaki Prosperous South Taranaki: a District that boasts a sustainable,
for a ten year period (2011-2021). resilient and innovative economy, has accessible and integrated
Strategy objectives, methods and targets address the two goals infrastructure, community services and open space that
set out in the New Zealand Waste Strategy. The Regional Waste prosper within the natural and social environment.
Strategy was reviewed in 2016 and new targets were agreed on Sustainable South Taranaki: a District that appreciates its
for the period 2016-21. The TRC and the three TAs collectively natural environment and its physical and human resources in
meet the targets through their respective WMMPs and work planning, delivery and protection.
programmes. Progress towards these targets is reported to the
Alongside these planning documents, the Solid Waste Asset
TSWMC.
Management Plan outlines specifically how the solid waste
assets and services will be managed.
2.2.2. TARANAKI REGIONAL WASTE MINIMISATION
EDUCATION STRATEGY
2.2.4. BYLAW
The purpose of the Taranaki Regional Waste Minimisation
The South Taranaki District Council Solid Waste Bylaw 2013
Education Strategy is to set out the strategic framework
aims to ensure that refuse collection and disposal does not
for STDC, NPDC, SDC and TRC to undertake education and
have significant environmental or health impacts, by regulating
communication programmes that help to achieve the regional
recycling, ownership of the waste stream, refuse storage, waste
waste minimisation goals outlined in the Waste Management
management, and waste collection.
and Minimisation Strategy for Taranaki. An annual programme
is developed every year to give effect to the Strategy.
2.2.5. POLICIES
The Kerbside Collection Policy was adopted in 2016 to
2.2.3. LONG TERM PLAN (AND ANNUAL PLAN)
encourage waste minimisation. The kerbside collection service
The Council stated in the 2015-25 Long Term Plan that its
is now restricted to dwellings located in an urban area or along
mission statement is to:
the kerbside collection route. Under this policy, each of these
Lead with fairness and integrity, and work to inspire a vibrant dwellings is allowed one set of bins. An additional set can
and caring spirit of community, while remaining an efficient and be allocated to a dwelling if special conditions apply and are
sensitive provider of services and facilities. approved by the Council.
The Litter Infringement Policy 2015 provides the Council with
To give effect to this statement, four community outcomes have
power to monitor illegal dumping, act on complaints and issue
been identified:
infringement notices for breaches of the Litter Act 1979.
Vibrant South Taranaki: a District that provides a high
quality and diverse cultural and recreational experience and
encourages independence and creativity.
10|SOUTH TARANAKI DISTRICT COUNCIL WASTE ASSESSMENT 2018
2.3 Existing Waste Services and Infrastructure
A variety of stakeholders is involved in waste management and minimisation services within the region and the District. The three
TAs in the region have a joint regional contract for the collection of urban residential kerbside refuse, recycling, and greenwaste;
and the operation of key transfer stations. A number of private service providers offer waste services to the rural community, the
commercial sector, and residential customers paying for a collection service. A growing number of community sector organisations
are also involved in waste services
TABLE 1 - SUMMARY OF WASTE INFRASTRUTURE AND SERVICES IN TARANAKI
Infrastructure/Service Council Provided Other Providers
REDUCE Education/ Regional education strategy and campaigns* Taranaki Environmental Education Trust
behaviour TRC Education Officer available for waste Enviroschools
change lessons Taranaki Conservationists
(across waste Regional Waste Minimisation Officer. Curious Minds programme3
hierarchy) Love Food Hate Waste national campaign Reusable bags for sale at most supermarkets. Some retailers
Distribution of waste levy grants charge for plastic bags or provide discount for bringing your
Tours of waste facilities own bag
Stalls and events Impact (funded by Ministry for Youth Development –
Social media working with youth aged 12-24)
We Can website / recycling directory Community fruit harvesting
Sustainable Living Education Trust licence Para Kore (Council waste levy funds part)
(NPDC only) Waste free parenting workshops (NPDC only)
REUSE Second hand Reuse shop at New Plymouth Transfer Charity stores – including Hospice Taranaki, Red Cross,
trading and Station Salvation Army, SPCA, Oxfam, and Church stores
upcycling Community Reuse and Recycling Centre Demolition and building trade stores.
(NPDC only, under development) Second hand traders, including second hand clothing stores
Online trading sites including TradeMe, Buy and Sell New
Plymouth, Freecycle New Plymouth, Neighbourly
Markets including Kids’ Market (monthly), The Seaside
Market (monthly), SPCA flea market (weekly) – (NPDC only)
Garage sales
Council / NZTA contractors reuse roading Gas bottles –‘Swap a bottle’ and refilling
wastes for bedding and sub-base material Retread tyres (processed outside of region)
Informal arrangements with farmers for tyres: used in silage
pits and retaining walls
Bounce Bags – making and distributing reusable shopping
bags
RECYCLE Collection Weekly kerbside collection mixed recycling Residential kerbside collection is provided by at least 2
and glass (STDC - 8,305 households and 27 commercial providers
schools) Commercial cardboard collections by four providers
Public place recycling bins (7) – (NPDC only) Commercial mixed recycling collections by two providers
Some events recycling on Council premises Farm sector: Plasback contractor collects farm plastics from site
Hospitality sector: Two collectors of waste cooking oil
Automotive industry: Some divert oil filters, car batteries,
antifreeze for recycling. All premises surveyed recycle waste oil
from site
Tyre industry: Small quantity of tyres recycled
Some recycling processed within the district and region and
some outside of the region
|11SOUTH TARANAKI DISTRICT COUNCIL WASTE ASSESSMENT 2018
Infrastructure/Service Council Provided Other Providers
RECYCLE Refuse Three main transfer stations in the region Baler for commercial plastics and cardboard located in New
transfer (Hawera, New Plymouth and Stratford) with Plymouth
stations free drop off of household recyclables and Plasback: regional farm plastics baler, located in South
user pays services for whiteware and waste Taranaki
oil. E-waste accepted at New Plymouth and One private transfer station in Hawera
Stratford transfer stations.
In the South Taranaki District: Hawera
Transfer Station (open 7 days) and six rural
transfer stations (limited opening hours)
offer free drop off of recyclables
Resource New Plymouth RRF (under development) Four scrap metal dealers (one located in the District)
recovery with Material Recovery Facility (MRF) Two providers for commercial skip processing
facilities sorting and baling Council-owned recycling
RECOVER Organic STDC opt-in user pays kerbside greenwaste Three providers for kerbside greenwaste collection
waste collection Many commercial businesses (e.g. landscaping) drop
collection greenwaste to processing facilities
Piggeries and coordinating organisations have informal and
formal arrangements with supermarkets and hospitality sector
for collection of food scraps
Food banks have arrangements with some supermarkets for
near end of date food
Coffee grounds from some cafes and service stations bagged
and made available for gardens
Community Fruit Harvesting Taranaki
Refuse Greenwaste is accepted for a lower fee than
transfer general waste at transfer stations
stations
Organic waste Patea greenwaste site no longer accepts Meat and poultry wastes such as offal, blood, feathers and
processing free public greenwaste disposal. fallen stock are processed by commercial operators in the
Greenwaste can still be beneficially placed region (predominantly in the South Taranaki District)
on the Patea Beach sand dunes for their One site in the region processes poultry litter.
stabilisation. However, quantities placed One operator (located at three sites) operates one composting
on site are limited to those needed for that and vermiculture site and two vermiculture only sites. The sites
purpose process paunch grass, poultry waste, poultry mortalities, fish
carcasses, greenwaste and drilling muds
Agricultural slurry and poultry shed litter are spread to land
Dairy waste products (such as buttermilk) are generated and
processed into stock food in the region.
Timber waste from one processing site is used on site for fuel.
Chip, bark, sawdust and wood are on-sold. Some untreated
timber waste is cleanfilled.
Biosolids / Wastewater biosolids from New Plymouth Drilling muds applied to land (landfarming).
drilling muds / wastewater treatment plant thermal dried
sludges and sold as a fertiliser (NPDC only).
Trade Waste One private waste dewatering facility; approximately six private
(solid portion or collectors of trade waste that may use the landfill for non-liquid
liquid if disposed wastes disposal.
at landfill)
12|SOUTH TARANAKI DISTRICT COUNCIL WASTE ASSESSMENT 2018
Infrastructure/Service Council Provided Other Providers
RECOVER Hazardous Domestic quantities of hazardous waste Commercial hazardous wastes are collected and transported
Waste accepted at three main transfer stations to either Auckland or Wellington for treatment / disposal. Two
in region, including the Hawera Transfer main providers of this service in the district.
Station.
Agrecovery provide agrichemical collection
(18 monthly) – funded by 3 TAs and TRC.
TREAT Clean fills Colson Road Landfill accepts cleanfill as 23 consented cleanfills in Taranaki. Some of these are only
cover. available for owner use.
Okato and Inglewood Transfer Stations South Taranaki District has 3 consented cleanfills that are only
accept and dispose of cleanfill onsite (NPDC available for owner use
only).
No cleanfill for public disposal in South
Taranaki
Collection Weekly kerbside waste collection of: Six commercial waste collectors in region, Four working in
• 120L bins STDC - 8,300 households; South Taranaki district.
SDC - 2,500 households. One commercial road sweeping provider.
• bags: NPDC - 27,600 households.; Many organisations involved in cleans-up of litter in beach,
Illegal dumping clean up on Council land: river and urban environments including but not restricted to
as required for the Council. Fortnightly for schools, Taranaki Conservationists, Project Hotspot.
NPDC. Residential kerbside collection is provided by at least 2
Public place litter bins. commercial providers
DISPOSE Transfer Waste disposal at all transfer stations (fees
Stations apply).
Tyres (user pays).
Landfills One regional landfill (Colson Road); [new
Central Landfill planned in 2019]
15 closed landfills in Taranaki. Seven closed
landfill sites in South Taranaki, two of which
are emergency landfill sites (Hawera and
Patea) Eight closed landfill sites (NPDC),
two of which are emergency landfill sites
(Inglewood and Okato).
TABLE 1: Bold text shows a change or new service since the last waste assessment in 2011.
3
May include a waste component. Study in 2016 on organic waste in schools. Another citizen science programme had marine waste component.
|13SOUTH TARANAKI DISTRICT COUNCIL WASTE ASSESSMENT 2018
2.3.1. COUNCIL-PROVIDED SERVICES AND Kerbside Collection Service
INFRASTRUCTURE All three TAs provide a similar mixed recycling and glass
In Taranaki, waste minimisation and management planning is collection service, with the same branding on education
integrated as far as is practicable through the TSWMC. This is a material, trucks and bins. The following items are accepted at
joint committee comprising the TRC and the three TAs charged the kerbside for recycling:
with considering and addressing waste management issues • aluminium cans
across the region. The Medical Officer of Health and Health • cardboard
Protection Officer are invited to participate on the Committee • glass bottles and jars
in a non-voting role. At an operational level, a regional WMO is • paper
appointed to assist the four councils to implement the Regional • plastic containers 1-7 (excludes soft plastics and
Waste Strategy and achieve its targets. polystyrene)
• tin cans
Services The Council-provided kerbside collection service is funded
Education through a targeted rate. A regional solid waste services contract
Giving effect to the Taranaki Regional Waste Minimisation that started on 1 October 2015 is operated by EnviroWaste
Education Strategy, an annual education plan lists the Services Limited, and encompasses both transfer station
education and communication activities the TRC and the three operations and kerbside collections for the three districts. As
TAs will undertake during the year. The programme identifies part of this new contract a change to the level of service was
school, community and business engagement activities. These implemented. All three districts now provide a separate glass
activities are predominantly driven by the WMO. recycling collection (colour separated at kerbside). The Council
Note: Social media has developed since the last waste and SDC still provide bins for mixed recycling, whereas NPDC
assessment and has impacted on the way we connect with our changed from collecting recycling in supermarket bags to
residents. provision of bins for recycling. The kerbside service level differs
between the Council, NPDC and SDC (Table 2).
Waste Minimisation Officer
The TRC and the three TAs jointly fund a regional part-time TABLE 2 - TARANAKI KERBSIDE COLLECTION
WMO to facilitate the implementation of the regional waste SERVICE
management strategy with a particular focus on advocacy, Council and Receptacle and frequency of collection of
advisory and educational activities. The WMO is employed by number of each kerbside service
and located at the TRC. households Mixed Glass Waste Green-
Recycling waste
Waste Levy STDC 140L bin 60L crate 120L bin 240L bin4
8,300 weekly weekly weekly fortnightly
Under the WMA, a levy of $10 per tonne (excl. GST) is charged
(voluntary
on all waste disposed of at landfill. Half of this levy goes to TAs service)
to spend on promoting or achieving the waste minimisation NPDC 240L bin 60L crate 60L bag5 nil
activities set out in their WMMPs. The three TAs utilise their 27,300 fortnightly fortnightly weekly
waste levy to fund the regional WMO (with an additional SDC 240L bin 60L crate 120L bin nil
contribution by the TRC) and to part-fund community initiatives. 2,300 fortnightly fortnightly weekly
Funded projects by the Council have included beneficial
Waste from the kerbside collection goes to the regional landfill.
greenwaste placement for sand dune stabilisation and research
Mixed recycling and glass collected on behalf of all three TAs is
on organic waste diversion. All three TAs have supported Para
taken to the New Plymouth MRF to be sorted and baled before
Kore and their work in reducing waste from Marae and tikanga
being transported to a final destination for recycling.
Māori events.
4
Voluntary user pays service
5
52 bags provided annually; additional can be purchased
14|SOUTH TARANAKI DISTRICT COUNCIL WASTE ASSESSMENT 2018
Infrastructure Tyres are accepted at the Council’s sites for a fee, as they are
Material Recovery Facility derimmed prior to their landfilling.
As part of a regional approach, NPDC has invested in the Hazardous waste is also accepted in domestic quantities free of
development of a Material Recovery Facility (MRF) located at charge at the Hawera transfer station only for South Taranaki. It
the Colson Road site. The function of the MRF is to sort and is then disposed of out of the region.
bale domestic recyclables, specifically cardboard, paper, tin and
steel cans and hard plastics 1-7. Currently the MRF processes Landfill
Taranaki council-provided recycling. The MRF includes an The region has a single functioning landfill, where all waste
education room with a viewing window to the facility. From from the council-provided services is disposed of. Access is also
January through to December 2016 over 50 groups toured available for commercial waste service providers, and all users
the facility. Showing the impact of recycling mistakes to our are charged a gate fee. The landfill is expected to reach capacity
community is intended to improve the recycling rate and in 2019 and is scheduled to close at the end of June 20196. A
reduce contamination of recycling. new regional landfill, located near Eltham in South Taranaki, is
consented and scheduled to open in 2019.
Patea Greenwaste Site
The Council also has seven consented closed landfills. The
The Patea Beach area has been informally used for greenwaste
Matangara (also called the Hawera) Closed Landfill and the
disposal for many years. By the early 2000s, the site had become
Patea Closed Landfill are both consented for emergency
a regional greenwaste dump. The Council started monitoring
landfilling, if required.
the site, and as a result the TRC issued a resource consent only
allowing for disposal of the amount of greenwaste necessary
2.3.2. COMMERCIAL AND NOT-FOR-PROFIT SERVICES
for sand stabilisation. Over the years, the Council has struggled
Commercial providers in the region provide a range of
with the amount of greenwaste disposed of on site and with
specialised services including residential solid waste collection,
illegal dumping of waste. Since February 2017, the site no longer
organic waste collection and processing, commercial solid
accepts free public greenwaste disposal. Greenwaste can still
waste and recycling collections, cardboard cages, recycling
be imported by the Council and beneficially placed on the Patea
drop-off points (residential, soft plastics, scrap metal), textile
Beach sand dunes on the condition that the quantities placed
reuse drop-off (charity shops/bins) and cleanfill sites. It is worth
on site are limited to those needed for sand dune stabilisation.
noting that since the Council’s previous WMMP was produced,
there is no longer a cleanfill available for public disposal in the
Transfer Stations
District.
In the region, STDC has seven transfer stations, NPDC five
It is believed, through the data collected for this waste
transfer stations, and SDC a single transfer station. All provide
assessment that commercially collected waste from Taranaki
free drop off for both residential and commercial recyclables
is being disposed of outside of the region, in the Whanganui
via mobile recycling containers. The transfer stations also have
District. However, confirmation of this, or quantities, has not
bins for disposal of general waste (whether from commercial or
been made available.
domestic source).
The Taranaki region does not have the facility for disposing of
Scrap metal and whiteware items are accepted at all Council-
some commercial hazardous and liquid wastes, and these are
owned transfer stations for recycling (note that a disposal
transported out of the region, to either Auckland or Wellington.
charge applies for whiteware).
The not-for-profit sector is increasingly involved in waste
Greenwaste is accepted at a lower charge than general waste
management and minimisation across the region and groups
to encourage users to divert it into compost. Non-compostable
have become stakeholders the TAs are working with (Table 1).
greenwaste (such as noxious weeds, flax, cabbage trees, and
Areas of involvement include education on waste minimisation
agapanthus) is accepted as general waste and goes to landfill.
and behaviour change, assistance with setting up processes to
further waste diversion and litter clean-ups.
6
The existing landfill will continue to accept special wastes until the new landfill has sufficient volumes of waste to protect the liner.
|15SOUTH TARANAKI DISTRICT COUNCIL WASTE ASSESSMENT 2018
2.4 Current Waste Quantities
In the South Taranaki District, as in the rest of the region, waste streams are diverse. These loads are carted to different locations
to reflect their treatment or disposal (Figure 4).
Council’s Kerbside Collection
(Residential Collections) Transfer Station Drop-off
General Mixed General Mixed
waste Recyling Greenwaste waste Recyling Greenwaste
3,297 t 1,539 t 1,432 t Council’s 5,094 t 379 t 794 t
Transfer Station
Landfill MRF Composting Facility
8682 t 1627 t 2226 t
Market
FIGURE 4: Mass flow diagram for South Taranaki 2015/16
The data in this section refers to ‘general waste’ and ‘overall
waste’. Unclassified mixed waste is referred to in this document
as ‘general waste’ and comprises construction and demolition
(C&D) waste, commercial and industrial (C&I) waste, landscaping
waste, and residential waste. When the general waste stream is
combined with the kerbside waste collections, transfer station
waste, and special wastes, the waste stream is referred to as the
’overall’ waste stream.
16|SOUTH TARANAKI DISTRICT COUNCIL WASTE ASSESSMENT 2018
2.4.1. LANDFILL WASTE
Quantities Source
The Colson Road Landfill (the Landfill) is the only operational Waste from the New Plymouth Transfer Station is the single
municipal landfill accepting general waste in the Taranaki largest source of waste to the Landfill (as identified during the
region. The Landfill receives wastes from South Taranaki, New SWAP analysis), comprising 30% of the total. General waste
Plymouth and Stratford districts. was the second largest component, representing 23% of the
Total waste to landfill quantities are derived from weighbridge total (Table 3 and Table 4). Loads classified as originating from
records at the Landfill gate. The weighbridge records the transfer stations, both council and privately-owned, comprised
quantity and type of waste entering the Landfill. This is 53.5% of all waste disposed of at the Landfill. Kerbside
considered to be an accurate account of waste being disposed collections, both council and private, comprised 18.8% of the
of to landfill in the Taranaki region. overall waste stream and special wastes comprised 4.5%.
Tonnages to the Landfill have remained around 60,000 tonnes
since 2007, when waste was consolidated to a single landfill
TABLE 3 - LANDFILL OVERALL WASTE BY
in the region (Figure 5). In the 2015/16 year, this reduced to ACTIVITY TYPE8
54,000 tonnes. Two factors might explain this decline. Firstly, Activity Type % of Tonnes/
weight week
the introduction of a new regional waste contract in October
General Waste 23.2% 196
2015 has seen an increase in recycling in the region. Secondly,
Kerbside Collection (councils and private) 18.8% 159
commercial waste is known to be transported outside of the
region for disposal7. The 2017 data will provide greater clarity Special Waste 4.5% 38
for the reason and impact of this reduction. Transfer Stations (councils and private) 53.5% 452
TOTAL 100% 845
The split between the three TAs is an indication only as it does
not take into account cross-boundary movement of waste
(Figure 5). STDC and SDC data, in this figure, primarily records TABLE 4 - SOURCE OF WASTE TO THE LANDFILL
kerbside and transfer station waste. Waste within the NPDC 6 AUGUST - 2 SEPTEMBER 20169
category includes kerbside and transfer station waste, as well Source % of total
as waste sourced from the region and disposed of at the Landfill STDC Kerbside Collections 0.6%
through commercial waste collectors. Hawera Transfer Station 16.4%
STDC Other Transfer Stations 0.6%
WASTE DISPOSED TO COLSON ROAD LANDFILL General Waste 23.2%
1997 - 2016 New Plymouth Transfer Station 31.9%
Stratford Transfer Station 0.5%
NPDC Kerbside Collections 12.3%
SDC Kerbside Collections 2.9%
Tonnes per year
Stratford Private Kerbside Collections 1.1%
Private Kerbside Collections 2.0%
Special Waste 4.5%
Private transfer stations 4.1%
TOTAL LEVIED WASTE 100.0%
The estimated amount of landfilled waste from STDC kerbside
collections is less than the amount of waste from the Hawera
FIGURE 5: Waste Disposed of to the landfill between 1996/97 Transfer Station (Table 4). This is the result of kerbside collection
and 2015/16 waste being mainly disposed of at the Hawera Transfer Station.
7
It is assumed that the quantity of waste leaving the region may be in the vicinity of 8,000 tonnes.
8
Waste Not Consulting. 2016. Composition of Solid Waste in Taranaki Region, September 2016.
9
Waste Not Consulting. 2016. Composition of Solid Waste in Taranaki Region, September 2016.
|17SOUTH TARANAKI DISTRICT COUNCIL WASTE ASSESSMENT 2018
2.4.2. TRANSFER STATION WASTE
Quantities
All waste received at the transfer stations across the region is Recent data also suggests that one commercial contractor has
disposed of at the Landfill. The geographic source of transfer drastically reduced the amount of waste it used to bring to the
station waste is unknown. It is assumed that all waste disposed Hawera transfer station. This change in waste volumes suggests
of at Stratford and Hawera transfer stations is predominantly that this waste is taken to an alternative disposal facility outside
from the relevant District. However, at least one waste service of the district.
provider in South Taranaki disposes of its waste directly to the
New Plymouth Transfer Station. Source
With the current solid waste contract, general waste from The three main transfer stations in the region, Hawera, New
kerbside collections and from remote transfer stations can Plymouth and Stratford, were assessed as part of the landfill
be carted directly to the Landfill, as opposed to the previous and transfer station SWAP in September 2016 to determine the
methodology employed, where all waste ended at the Hawera source of waste generation10 and compositon of the waste.
transfer station before being carted to the landfill. Commercial and industrial activities were the primary source
Quantities of general waste received at the transfer stations of the waste disposed of at the Hawera transfer station (Table
have noticeably decreased since 2015 (Figure 6). This decrease 5). The second source of waste came from that collected via
doesn’t necessarily indicate that the district has produced less our Council kerbside collection services, representing 37% of
waste since 2015. the surveyed weight.
SOUTH TARANAKI TRANSFER STATION - REFUSE
TABLE 5 - ACTIVITY SOURCE OF HAWERA
6000
TRANSFER STATION WASTE 14 - 17 SEPTEMBER
5000 201611
4000
No. of loads
% of weight
% of loads
Tonnes
surveyed
Activity Source
Tonnes/
3000
week
2000
Construction and demolition 14 18% 6% 9.8
1000
Industrial/commercial/institutional 22 29% 42% 66.8
0 Kerbside collections - STDC 37% 58.9
13 17%
1
6
2
3
4
5
/1
/1
/1
/1
/1
/1
Kerbside collections - private 9% 14.4
10
15
11
12
13
14
20
20
20
20
20
20
Landscaping 3 4% 1% 0.8
Residential 25 32% 6% 9
FIGURE 6: Tonnage of Waste Disposed at the South Taranaki
Transfer Stations 2010 - 2016 TOTAL 77 100% 100% 15.6
COMPARISON OF ACTIVITY SOURCE TO TRANSFER STATION WASTE
60%
50%
40%
30%
20% STDC
10% NPDC
SDC
0%
on r
iti /
g
l
cti ide
tio ial /
ST ons e
tia
ati fe
ol on
in
tu rc ial
cti sid
on
on
na /
St ans
ap
lle bs
en
sti e tr
m cti
lle rb
In mm dus
l
DC
co Ker
sc
id
de stru
Tr
co Ke
s
nd
Re
te
Co In
te
n
La
iva
Co
iva
Pr
Pr
FIGURE 7: Comparison of waste activity Source for the Three Main Transfer Stations in Taranaki
10
Activity sources are defined in the key terms and acronyms section and include kerbside, residential, commercial and industrial, construction and demolition.
11
Waste Not Consulting. 2016. Composition of Solid Waste in Taranaki Region, September 2016
18|SOUTH TARANAKI DISTRICT COUNCIL WASTE ASSESSMENT 2018
Regional Comparison of Transfer Station Waste TABLE 6 - STDC KERBSIDE WASTE PER YEAR
The Stratford transfer station had a significantly higher Council provided kerbside refuse collection waste per tonnes
proportion of refuse weight from residential loads than the (includes residual waste from kerbside recycling collections)
other transfer stations while the New Plymouth Transfer Station 2010/11 3973
had a higher rate of C&D waste (Figure 7). The large proportion 2011/12 3859
of residential waste at the Hawera Transfer Station is due to 2012/13 3710
most STDC kerbside residential waste being consolidated for 2013/14 3405
transport at the transfer station before being bulk hauled to 2014/15 3680
the Landfill. 2015/16 3366
2.4.3. KERBSIDE WASTE QUANTITES
The three TAs in the region provide a kerbside refuse and
recycling collection for urban residential households. The
quantity of kerbside waste collected in the South Taranaki
District between 2010 and 2016 has remained reasonably
stable at around 3,600 tonnes per year (Table 6).
2.5 Waste Generation per Capita
Waste per capita is an indicator for waste generation that looks at the total amount of waste produced, divided by the total number
of people in a defined area. It is an indicator of average waste production on a per person basis, but is not directly equivalent to the
amount of waste an individual throws away each year, as much of the waste is produced from commercial sources.
The per capita disposal figures for kerbside refuse can be influenced by:
• Changing proportions of the population serviced by Council collections.
• Different levels of commercial and industrial activity (a greater level of commercial and industrial activity in South Taranaki
influences the per capita rate for this location).
• Missing data (private collectors may not be separately accounted for at transfer stations).
• Unknown cross-district waste movements, e.g. New Plymouth total waste per capita is higher than the other two districts
but does not necessarily comprise waste sourced only from the New Plymouth District. Many of the private waste service
providers may service the whole Taranaki region but, as they are based in New Plymouth, the waste is recorded as being
sourced from within the New Plymouth District. It is difficult to determine any cross-district waste movements.
The waste per capita for kerbside collection and for the total amount landfilled from waste collected by the Council were calculated
using 2009/10 and 2015/16 data. For South Taranaki, kerbside waste sent to landfill remained constant while the waste per capita
for total waste to landfill reduced from 0.4 to 0.32 T/capita/annum (Table 7). Once again, the lower volumes received at the
transfer station since October 2015 explain the decrease in total waste per capita.
TABLE 7 - WASTE PER CAPITA FOR EACH TA WITHIN THE REGION
2009/10 2015/16
Kerbside waste to landfill Total waste to landfill Kerbside waste to landfill Total waste to landfill
(T/capita/annum) (T/capita/annum) (T/capita/annum) (T/capita/annum)
STDC 0.12* 0.4 0.12 0.32
NPDC 0.27 0.63 0.11 0.56
SDC 0.22 0.41 0.14 0.23
*STDC Waste Assessment 2012
|19SOUTH TARANAKI DISTRICT COUNCIL WASTE ASSESSMENT 2018
2.6 Composition of Waste COMPOSITION OF OVERALL WASTE
DISPOSED AT THE LANDFILL - 2016
2.6.1. SWAP RESULTS 1%
3%
A SWAP survey was conducted in 2016 to analyse the composition of 23%
waste disposed of to landfill, at the main transfer stations and via the
5%
Councils’ kerbside collection services.
Landfill
The SWAP survey analysed the composition of waste sent to the 6%
Landfill (Figure 8). Organic material was the largest component of
the overall waste to landfill in 2016, comprising 23% of the total, by
16%
weight. Timber was the second largest component, comprising 16%
10%
of the total. Paper, plastic and rubble comprised similar proportions,
from 10% to 14%.
11%
Most waste streams reduced in weight between the 2010 and the 14%
2016 surveys, but as a proportion of the composition, organic waste
entering the landfill showed the biggest reduction between 2010 and 1% Nonferrous metals 6% Textiles
2016, declining by 7% of the overall waste (Figure 9). This reduction 3% Ferrous metals 10% Paper
could be indicative of effective awareness campaigns around organic 3% Glass 11% Rubble
waste, but could also be attributed to commercial operators taking
3% Rubber 14% Plastics
loads that have been collected through kerbside collections within the
region to a landfill out of the region. These bins have a high proportion 5% Sanitary paper 16% Timber
of organic waste13. Glass has also declined by around 5% of overall 5% Potentially hazardous 23% Organics
waste, which is most likely attributed to the introduction of glass FIGURE 8: Composition of Waste Disposed of at the
colour separation on 1 October 2015. Landfill 201612
COMPARISON OF LANDFILL COMPOSITION (BY TONNAGE) 2010 AND 2016 2010 2016
400
350
300
250
200
150
100
50
0
FIGURE 9: Comparison of Landfill Composition by Tonnage between 2010 and 2016.
12
Waste Not Consulting. 2016. Composition of Solid Waste in Taranaki Region, September 2016
13
Waste Not Consulting. 2012. Survey of Solid Waste in the New Plymouth District. Prepared for NPDC April 2012.
20|SOUTH TARANAKI DISTRICT COUNCIL WASTE ASSESSMENT 2018
HAWERA RTS - OVERALL WASTE - PRIMARY
COMPOSITION 14-17 SEPTEMBER 2016
1% 3%
4% Transfer Stations
The SWAP survey analysed the composition of
5%
29% overall waste received at the Hawera Transfer
Station (Figure 10). Organic waste was the largest
6% component of waste being disposed of at the
Transfer Station during the survey, comprising 29%
of the total. The following largest components were
9% plastics, rubble and timber, respectively constituting
14%, 14% and 13% of the waste.
A review of the compositon of the four general
14%
13% activity sources presents some expected waste
streams (Figure 11). Organic waste comprises over
14% 50% of the landscaping activity source while over
30% of C&D waste was timber. Rubble comprised
1% Nonferrous metals 6% Sanitary paper between 20 and 30% of C&D and C&I waste
1% Rubber 9% Paper composition.
1% Potentially hazardous 13% Timber
3% Glass 14% Plastics
4% Ferrous metals 14% Rubble
5% Textiles 29% Organics
FIGURE 10: Composition of Waste at the Hawera
Transfer Station
COMPARISON OF COMPOSITION OF WASTE BY ACTIVITY SOURCE AT THE HAWERA TRANSFER STATION
60%
C&D ICI Landscaping Residential
50%
40%
30%
20%
10%
0%
Paper
Plastics
Organics
Nonferrous
metals
Glass
Textiles
Sanitary
Paper
Timber
Rubber
Rubble
Potentially
hazardous
Ferrous
metals
FIGURE 11: Comparison of Waste Compostition by Activity Source
|21SOUTH TARANAKI DISTRICT COUNCIL WASTE ASSESSMENT 2018
Kerbside COMPOSITION OF STDC KERBSIDE BINS
The 2016/17 SWAP survey of South Taranaki domestic GENERAL WASTE CONTENTS 2016/17
kerbside waste collections took place between 30 November 1% 2%
3%
2016 and 2 December 2016, and between 23 to 28 January 4%
2017, when 90 Council kerbside general waste wheelie
bins were audited. Organic material was the largest single 8%
component of the general waste bins, comprising 62% of the
total by weight (Figure 12). Kitchen waste comprised 62% of
this organic material and greenwaste comprised 32%. Most of
8%
the garden waste consisted of lawn clippings, tree and shrub
prunings, and leaves. Other organics (cat tray litter, animal
faeces, vacuum cleaner dust and human hair) made up 6% of 62%
11%
the organic waste component.
Plastics, sanitary paper, and paper comprised similar
proportions of the general waste bins at 11%, 8.1%, and 8.1%
respectively. Soft plastic bags (including food packaging and
0% Potentially hazardous 3% Timber
shopping bags) made up 21% of the plastic wastes. Rigid
non-recyclable plastics comprised 16% of plastics. These 0% Rubber 4% Textiles
items included packaging that did not carry a recycling 0% Rubble 8% Sanitary paper
symbol and non-packaging items. Plastic items that could 1% Glass 8% Paper
have been recycled through the Council’s kerbside recycling 1% Nonferrous metals 11% Plastics
system comprised 25% of total plastics. Composite plastic
2% Ferrous metals 62% Organics
represented 38% of total plastics.
FIGURE 12: Composition of STDC Kerbside Bins General
Of the paper component of Council kerbside general waste
Waste Contents 2016/17
bins, 42% was recyclable. Non-recyclable paper, which
included food-contaminated packaging and paper drink cups, KERSIDE REFUSE COMPOSITION COMPARISON
comprised 58% of the paper. STDC, NPDC AND SDC
NPDC and SDC have also conducted kerbside waste audits.
70%
NPDC audited 335 Council kerbside rubbish bags and SDC NPDC SDC STDC
audited 45 bins. Similar sorting classifications to the STDC 60%
audit were used for regional consistency. Regionally, the
composition of waste from the three TAs demonstrated the 50%
slightly different waste collection services provided by each
district (Figure 13). Both STDC and SDC provide a 120L general
Proportion
40%
waste bin, whereas NPDC provides a bag service. STDC has
a higher proportion of organics in bins when compared with 30%
SDC and NPDC. However SDC has higher proportions of glass,
metal and plastics. For all three districts, organic waste made 20%
up the highest proportion of waste.
An analysis of the broken down organic waste composition 10%
for the three TAs (from Figure 13) shows the significantly high
proportion of kitchen waste in all councils’ general waste 0%
Ferrous
metals
metals
Nonferrous
Potentially
Paper
Plastics
Organics
Glass
Textiles
Rubble
Timber
Rubber
hazardous
Sanitary
paper
containers (Figure 14).
FIGURE 13: Comparison of kerbside refuse between NPDC,
SDC and STDC
22|You can also read