Mobile Telecommunications Networks for the 2014 World Cup - Emilio Tissato Nakamura Jadir Antonio da Silva José Manuel Martin Rios Luciano Maia ...
←
→
Page content transcription
If your browser does not render page correctly, please read the page content below

Mobile Telecommunications
Networks for the 2014 World Cup
                      Emilio Tissato Nakamura
                          Jadir Antonio da Silva
                      José Manuel Martin Rios
                           Luciano Maia Lemos
                       Ricardo Tavares (GSMA)
                             Sérgio Luís Ribeiro
Table of Contents

1   INTRODUCTION ....................................................................................................................... 12
2   CONTEXT ............................................................................................................................... 13
    2.1      Brazil ................................................................................................................................. 13
    2.2      The 2014 World Cup ......................................................................................................... 13
    2.3      Telecommunication networks in Brazil............................................................................. 15
    2.4      Mobile networks in Brazil ................................................................................................. 17
    2.5      Mobile services in Brazil and the world ............................................................................ 20
    2.6      Security ............................................................................................................................. 22
3   CRITICAL INFRASTRUCTURE PROTECTION ....................................................................................... 22
    3.1      Social and economic aspects ............................................................................................ 22
    3.2      Defining critical services and issues.................................................................................. 23
    3.3      Threat identification ......................................................................................................... 23
    3.4      Risk assessment ................................................................................................................ 24
    3.5      Integrating providers, government and society ............................................................... 25
4   CASE STUDY – THE 2007 PAN‐AMERICAN GAMES IN RIO DE JANEIRO ................................................ 25
    4.1      Methodology for Critical Infrastructure Identification (MI²C).......................................... 25
    4.2      Identifying services ........................................................................................................... 26
    4.3      Defining aspects................................................................................................................ 26
    4.4      Defining severity levels ..................................................................................................... 27
    4.5      Defining aspect weight ..................................................................................................... 27
    4.6      Assessing severity levels ................................................................................................... 27
    4.7      Specifying and prioritizing critical telecommunication services....................................... 27
    4.8      Identifying the network infrastructure ............................................................................. 27
    4.9      Specifying and prioritizing critical telecommunication infrastructure elements ............. 30
    4.10 Case study results ............................................................................................................. 32
5   MOBILKOM AUSTRIA – CASE STUDY ............................................................................................. 32

    5.1      Traffic variations ............................................................................................................... 32
    5.2      Roaming ............................................................................................................................ 34
    5.3      Services ............................................................................................................................. 34
    5.4      Risk management and protection of critical infrastructure ............................................. 35

3                                                                                                                           www.cpqd.com.br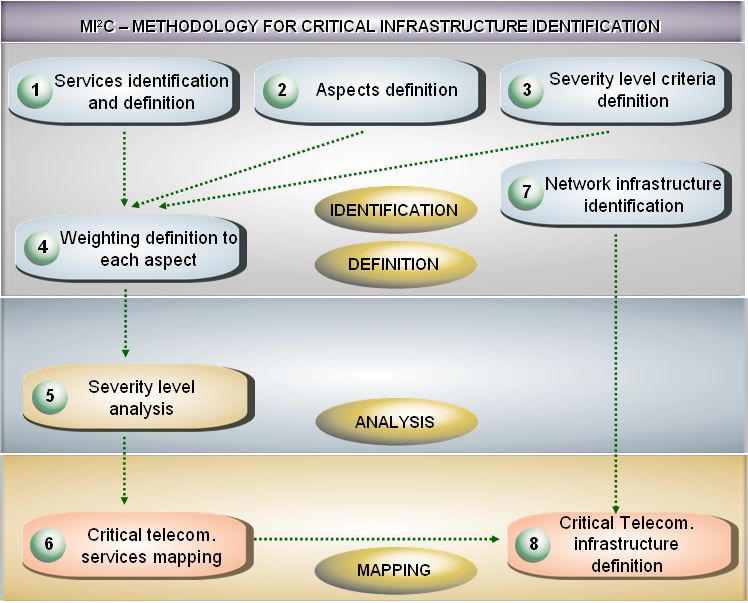
6   2014 TRENDS ......................................................................................................................... 36
    6.1      Mobile Technology in 2014............................................................................................... 36
    6.2      Services in 2014 ................................................................................................................ 40
    6.3      Demand forecast and traffic estimates ............................................................................ 42
    6.4      Frequency Spectrum......................................................................................................... 44
    6.5      New emerging threats ...................................................................................................... 45
    6.6      Critical Infrastructure protection and security ................................................................. 45
7   FINAL CONSIDERATIONS AND RECOMMENDATIONS .......................................................................... 46
8   ABOUT CPQD ......................................................................................................................... 48
    8.1      Identity.............................................................................................................................. 48
    8.2      History............................................................................................................................... 48
    8.3      Strategic Positioning ......................................................................................................... 48
    8.4      CPqD Certifications ........................................................................................................... 49

4                                                                                                                         www.cpqd.com.br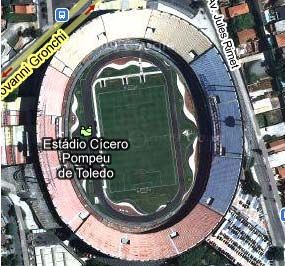
This paper was commissioned by the GSM Association (GSMA), the world trade association of
mobile operators. It analyzes the main challenges for telecommunications companies, and in
particular mobile operators, as they prepare for the 2014 World Soccer Cup and the 2016 Rio de
Janeiro Olympic Games in Brazil. Decisions can then be made based on the elements presented in
this paper, and investments channeled in the right direction.

                                     Acknowledgements
   The authors of this paper take full responsibility for the text. However, a number of key
individuals and organizations made an essential contribution to the completion of this position
paper.

  A few external advisors made some perceptive remarks on early draft deliverables. In particular,
we would like to thank Ricardo Tavares of GSMA for his valuable comments.

   Mobilkom ensured the completion of this work, and their assistance has been essential. In
particular, we would like to thank Werner Wiedermann and Manfred Kresse for their contribution
with data, analysis and comments on the Case Study section.

    Editorial and translation support from CPqD team and Sarah Thailing is gratefully acknowledged.

    The whole team is grateful to the colleagues of CPqD who provided extremely valuable help with
validating our views.

5                                                                                www.cpqd.com.br
EXECUTIVE SUMMARY                                   TELECOMMUNICATIONS NETWORKS IN BRAZIL

2014 FIFA WORLD CUP BRAZIL                              The privatization of telecommunications in
                                                    Brazil took place on July 29, 1998, and today
    Hosting the 2014 World Cup represents a         four companies control the mobile sector: Vivo,
historical point for Brazil, opening up a wide      an association of Telefonica and Portugal
range of challenges and opportunities. Large        Telecom; Claro, controlled by América Móvil;
sporting events are a major undertaking,            TIM, a subsidiary of Telecom Italia; and Oi, a
demanding initiative, investment and oversight      Brazilian‐owned telco. Mobile telephony
from the government, various segments of the        reached 176.8 million subscribers in February
economy and from society itself. Hefty              2010, of which 82.5% were pre‐paid and 17.5%
investments in infrastructure will be needed        post‐paid. Approximately 96.6% of the
and companies will face a unique opportunity,       population is serviced by at least one operator,
not only because of the millions of people from     while 64.7% can choose between at least four
all over the world who will flock to Brazil, but    alternatives. The growth of wireless penetration
because of the high level of exposure the           has largely been driven by the implementation
country will receive.                               of pre‐paid services, providing the less affluent
                                                    with access to telecommunications services.
    The scale and dimension of the
infrastructure demanded by the Fédération               In February 2010, over two years after the
Internationale de Football Association (FIFA) to    first    third‐generation    (3G)     commercial
host the 2014 World Cup games is a real             operations were launched, there were 8.1
challenge. The enormous influx of people            million terminals in use, or 4.6% of the market.
coming to the host cities vastly increases the      Anatel – the Brazilian telecommunications
need for various basic services such as             regulator – believes that in 2014 the number of
transportation, telecommunications, water           mobile accesses lines in Brazil will be over 210
distribution,     sanitation,     electric  power   million, representing a mobile teledensity of
distribution, financial services and health care.   over 100%, with more than 55 million being
These systems are interdependent, and an            mobile       broadband     subscribers.    These
incident in one area can have critical              projections to 2014 suggest a steep growth, not
consequences on the others. The concept of          only in the number of subscribers but also in the
critical infrastructure protection, used to         resulting spectrum needs and infrastructure
identify the critical telecommunications services   investment requirements.
during the 2007 Pan‐American Games in Rio de
Janeiro, will be vital for the 2014 World Cup.      MOBILE TECHNOLOGY IN 2014

   Besides the stadiums and surroundings, with          Mobile broadband forecasts indicate that in
their great crowds of people during the games,      the coming years, the most widely used
other World Cup‐related festivities and tourist     technologies in the world will be HSPA/HSPA+
attractions will present mobile phone operators     and LTE. HSPA is the first step in the WCDMA
with both opportunities and challenges. Among       evolution, claiming to offer data transmission
the most popular of these are the Fan Fests,        rates ranging from 1.8 Mbps to 14.4 Mbps, to
created by FIFA during the 2006 World Cup in        support bandwidth‐hungry applications. LTE
Germany. Fan Fests were set up in 12 different      introduces      new     radio    communications
places in Germany, with a total of 18 million       technology with even greater spectral
people watching the game on giant screens.          efficiency, offering from two to four times more
                                                    capacity than HSPA systems.

7                                                                                 www.cpqd.com.br
Several commercially tested digital TV ISDB‐T standard. Despite the adoption of ISDB‐T
technologies are currently available and will almost four years ago and the launch of the first
likely become mainstream technology fixed transmissions in the last two years, the
worldwide by 2014. After a series of risk analysis players have only now started implementing the
studies and standard adaptations for country‐ middleware platforms necessary to permit
specific characteristics, Brazil chose Integrated interactivity, consequently bringing mobile
Services Digital Broadcasting – Terrestrial (ISDB‐ operators into the value chain as a return
T) in 2006. Designed from the ground up for channel provider. Mobile TV and Mobile
mobile and portable reception, ISDB‐T transmits Services during 2014 World Cup are likely to
HDTV programming and mobile TV within in the share the same device but stay in different
same frequency channel, which is a plus ecosystems (TV and telecom).
compared to other digital TV standards that
need additional spectrum for mobile We believe that Mobile Social Networking,
transmissions. not just fixed Internet access to Social
Networks, will be the most important mobile
Brazilians' passion for TV, along with the data service by 2014. This is a mobile data
widespread adoption of cell phone technology, service definition more specific to the mobile
is a factor that boosts the country’s great ecosystem, looking at the importance of the
potential for mobile TV. In fact, research shows context on the services offered.
that the mobile handset and the TV set are the
two most important items in the average One reason to believe in the success of
Brazilian’s everyday routine (while computers Mobile Social Networking is that, unlike the
with Internet access rank only in third place). uptake of SMS, Brazilian Internet users adopted
social networks to a deeper degree than many
SERVICES IN 2014 other countries. Brazilian data point to the fact
that users spend far more time on social
From the point of view of user acceptance of networks than any other Internet application.
services, and consequently generated revenue, This behavior may have huge impact on
the vast majority of mobile users in the world, network traffic by 2014, which will demand
and in Brazil too, use their mobile phones more frequency bandwidth, network
mainly for voice communications. Next come infrastructure optimization and contingency
SMS (or Short Messaging Service) messages, planning to guarantee the availability and
and finally data services. quality of service.
A gradual increase in data service access is Last but not least, because this is a
expected through 2014. Besides traditional worldwide sporting event and performed in a
voice and SMS traffic, there will be an increase number of cities that will receive many foreign
in SMS traffic associated with applications and visitors, roaming is a service that must be
special sales during the event. Mobile considered carefully.
Advertising probably will add moderate traffic
over SMS and MMS (or Multimedia Messaging DEMAND FORECAST AND TRAFFIC ESTIMATES
Service), according to advertising business
models. Other data services likely to expand by By all indications, the Brazilian cell phone
2014 with 3G technology are Mobile TV and, system will be based on HSPA and LTE
most importantly, Mobile Social Networking. technology in 2014.
We expect the expansion of Mobile TV in It is possible to run simulations to determine
Brazil to concentrate on the free‐to‐air the approximate rate these technologies would
broadcasting as a result of the adoption of the deliver under real working conditions. In the
case of a 3G cellular phone system operating in
8 www.cpqd.com.bra 2 X 5 MHz channel in an urban area under telecommunications services will need over 1.0
different traffic conditions, it was found that the GHz of spectrum to meet market demands. The
maximum cell throughput is approximately 9 frequency bands for mobile communications in
Mbps for LTE and approximately 8 Mbps for Brazil are distributed in the following manner:
HSPA. If it would be possible to allocate 2 X 20 850 MHz; 900 MHz; 1700 MHz and 1800 MHz;
MHz of bandwidth (to do this, current spectrum and 1900 MHz and 2100 MHz (reserved
assignment practices would have to change), primarily for 3G).
maximum cell throughput would reach 36 Mbps
for LTE and 32 Mbps for HSPA. To be able to offer higher traffic rates, larger
spectrum bands would have to be allocated.
During the 2014 World Cup, the most critical Following an ITU recommendation, in 2009
situation will very likely be covering the Anatel launched a public consulting project in
stadiums and surroundings, where there will be order to assign 140 MHz in additional spectrum
a very high concentration of subscribers, most to PMS in the 2.5 GHz band (2500 MHz ‐ 2690
of whom will be heavy service users. With some MHz). Dedicated to mobile data, this additional
reasonable estimates for user density in the bandwidth will be crucial for mobile data
vicinity of the stadiums, the demand is expected transmission at both the 2014 World Cup and
to reach17 Mbps per cell area. the 2016 Olympic Games.
Even considering that changing system It’s important for Brazil to follow continue
parameters might possibly improve network analyzing the situation in order to define the
performance, it is very unlikely that HSPA or LTE proper spectrum utilization to meet the
cells, with a 2 X 5 MHz bandwidth, will be able increased demand for mobile communications
to meet this demand. However, a cell with a 2 X traffic during the 2014 World Cup. Service
20 MHz bandwidth would be able to handle this providers and other entities that represent
amount of traffic without a problem. mobile technology suppliers can help Anatel
evaluate the most viable options to comply with
An alternative way of increasing data the mobile broadband frequency needs.
transmission rates in areas of great user
concentration, such as stadium surroundings, RISK MANAGEMENT, CRITICAL INFRASTRUCTURE
would be to increase the number of cells. This PROTECTION AND INFORMATION SECURITY
would, however, increase interference among
the cells due to their proximity, causing system Large sporting events like the 2014 World
degradation and diminishing sector throughput. Cup demand painstaking procedures, involving
government, private initiative, and members of
FREQUENCY SPECTRUM society in general, since they are the main
stakeholders. It is not sufficient to simply
The implementation of a cellular estimate the volume of traffic and demand;
communications system involves a series of instead, networks must be carefully planned
stages, from planning to completion. Significant out, taking into consideration all the risks
time must be dedicated to the planning stage. involved, especially those posed by new
All definitions that are necessary for emerging threats that might affect the quality
implementation, such as the available frequency and availability of existing mobile services.
spectrum, must be made well in advance.
The 2014 World Cup will take place in a
Today, the total spectrum utilized by PMS convergent world with total mobility, and Brazil
(Personal Mobile Services)1 in Brazil is must be prepared to face a whole new set of
approximately 300 MHz. A study carried out by threats. Events of great magnitude are always
ITU (International Telecommunication Union)2 opportunities for new services, but also for new
estimates that in 2015, mobile
9 www.cpqd.com.brscams. The problem of cell phone cloning has One of the most important things needed to
been resolved; however, now hackers are using organize a major sporting event, or for the
cell phones to steal identities, and this is development of the country in general, is to
becoming an increasingly critical problem. have a solid knowledge of the priorities of
essential services such as telecommunications,
The increased importance of information risk founded on the social and economic needs of all
management is clear all along the entire the stakeholders. This knowledge is
telecommunications value chain. Not only must fundamental for developing effective Critical
the reliability and integrity of communications Infrastructure Protection. With a proper view of
be preserved, but service availability as well. In risks and opportunities, investments can be
times of new emerging threats, high‐quality prioritized and the right strategy implemented
telecommunications services are not just a to guarantee the continuity of vital services.
question of properly working equipment or
operational efficiency. To achieve this, a risk This concept is not only critical not only for a
management system that can identify, assess nation's development, but also for major
and deal with existing risks is one of the most sporting events like the 2014 Brazil World Cup
vital factors. and the 2016 Olympics in Rio de Janeiro. The
first major experience with Critical
A proper risk management system cannot be Infrastructure Protection in Brazil was during
limited to accidents or natural disasters, since the Pan‐ and Parapan‐American Games in 2007,
these are already efficiently handled by the hosted by the city of Rio de Janeiro3. MI²C,
operators. It must also include intentional provided by the PICT (Telecommunication
threats, which are proliferating rapidly thanks to Infrastructure Protection) Project, was used to
the new possibilities and opportunities (both assess the critical telecommunication
legal and illegal) made possible by new infrastructure.
technology and services. Opportunities must
also be delineated according to this risk In preparation for the Olympic Games and
assessment. A major sporting event like the Para‐Pan American Games, the International
2014 World Cup opens up a host of new threats Olympic Committee (IOC) provided a "book of
to be identified and analyzed, so operators can practices" for information security. Similarly, for
provide spectators, tourists, athletes, the 2014 World Cup and for the 2016 Olympic
committees, journalists and the Brazilian Games, as disclosed in the application file, Brazil
population as a whole with hig‐quality and should implement a CTIP project (Critical
uninterrupted telecommunications services. Telecommunications Infrastructure Protection
Project). In addition, FIFA should also provide a
Critical Infrastructure Protection is a concept "book of best practices" for the event.
that relates to the preparedness and response
to serious incidents that involve the critical RECOMMENDATIONS
infrastructure of a nation or region. It consists
of a security strategy to prevent basic services Major sporting events, such as the World
such as energy, transportation, water, health Cup and the Olympics, are tremendous
care and even mobile telecommunications from opportunities to spark economic growth, since
being disrupted. Critical infrastructure systems both the government and the private sector
can be damaged, destroyed or disrupted by invest heavily in preparation for them, leaving a
deliberate acts of terrorism, natural legacy of development for the host country.
catastrophes, negligence, accidents, acts of
When it comes to telecommunications, we
piracy, among other threats.
see a great opportunity to increase both
capacity and data speeds in Brazil’s mobile
10 www.cpqd.com.brnetworks. Guaranteeing the security and this hands‐on experience can contribute
reliability of mobile networks for these large significantly to the planning and execution of
events is also crucial. The following the 2014 World Cup and the 2016 Olympic
recommendations are designed to benefit the Games.
entire mobile services value chain:
• Planning for innovative new services:
• Planning jointly between the government Mobile carriers, broadcasters and soccer
and the private sector: To ensure the team associations can use the next state and
security and reliability of mobile networks in national championships – between 2011 and
particular and telecommunications networks 2013 – to try out new services and
more broadly, mobile operators, together applications based on broadband access and
with the association of cities representing mobile TV. Real network traffic requirements
the 12 host cities and the major event can thus be forecasted and important
sponsors, must agree on the possible aspects regarding usability, appeal, security
locations for the eventual Fan Fests. Planning and end‐user quality of experience can be
for the traffic and capacity of the networks defined.
must be aligned with the expectations of • Planning capacity and traffic demand:
security and transportation agents. Detailed planning must be carried out
• Structuring partnerships with organizers of beforehand regarding what services will be
similar events: The experience from other offered during the World Cup and their
major sporting events is essential for the respective impact on traffic demand and
Brazilian players to acquire the needed processing capacity, considering the user
expertise to plan and execute these events profile, the estimated demand for roaming,
to ensure their complete success. It is vital to and concentrated areas of high usage such
seek partnerships with bodies such as the as the stadium surroundings and Fan Fests.
organizing committees of similar upcoming The Fan Fests that will take place during the
events, such as the South Africa 2010 World 2010 World Cup (South Africa) will be an
Cup and the London 2012 Olympic Games, or excellent opportunity for Brazil to evaluate
of previous events such as the German 2006 the infrastructure needed to provide users
World Cup, the China 2008 Olympics and the with the best possible service. Event
Canadian 2010 Winter Games. planning must also include suppliers' delivery
Telecommunications service providers that and execution capacity. Another critical area
covered these events or are planning future will be media centers at the stadiums and
ones can provide valuable contributions to cities, where traffic demand from Brazilian
the 2014 World Cup in Brazil as well as the and foreign media professionals will be huge.
2016 Rio de Janeiro Olympics. These • Allocating the frequency spectrum: There is
partnerships can provide benchmarks and strong evidence that the frequency spectrum
other parameters such as case studies and currently allocated in Brazil for mobile
forecasts for planning and execution services will not be able to adequately cover
purposes. the areas of great user concentration in the
• Acquiring hands‐on experience from similar next few years. Anatel is taking actions in
upcoming events in Brazil: The Military compliance with ITU recommendations to
World Games 2011 and FIFA Confederations align Brazil's mobile service frequency
Cup 2013, both large sporting events in spectrum with that of other countries
Brazil, represent challenges to the around the world. An example is the 2.5 GHz
telecommunications players. Gaining from band. For the 2014 World Cup and the 2016
11 www.cpqd.com.brOlympics, the importance of an adequate developing an in‐depth analysis to define the
new band for mobile communications is best solution for mobile users. This analysis
underscored by the great concentrations of might reveal that more frequency bands will
users with a high demand for mobile be needed if the other factors involved (e.g.,
services. It is therefore highly recommended data compression or transmission
to continue seeking and evaluating different technology) do not evolve sufficiently to
alternatives to increase the frequency meet increased traffic demand. A common
spectrum for mobile services, such as the strategy among all players, however, is
allocation of 140 MHz spectrum band for essential to secure the necessary measures
FDD in the 2.5 GHz in a timely fashion. from federal, state and local governments.
• Adopting a model of critical infrastructure
protection: Using a critical infrastructure 1 INTRODUCTION
protection model will allow joint planning
between the government,
Hosting the 2014 World Cup represents a
telecommunications service providers and
historical point for Brazil, opening up a wide
the 2014 World Cup organizing committee to range of challenges and opportunities. Large
ensure that mobile services will work sporting events such as the World Cup and the
flawlessly during the event. This model must Olympic Games are a major undertaking,
encompass at the very least the following demanding initiative, investment and oversight
activities: identification and analysis of the from the government, the various segments of
main assets; identification and analysis of the economy and from the society itself.
the main threats and vulnerabilities of the
environment, in the context of the 2014 Hefty investments in infrastructure will be
World Cup and the 2016 Olympics; analysis needed and companies will face a unique
of the interdependency of the different opportunity, not only because of the millions of
sectors; risk analysis; and finally, the creation people from all over the world who will flock to
of an ideal scenario for critical infrastructure Brazil, but because of the high level of exposure
protection. the country will receive. In the
telecommunications sector, convergence and
• Defining contingency and business mobility are changing the way people access
continuity strategies, based on delineated information. In this scenario, new services will
threats: Once the critical infrastructure demand new technology and innovative
model has been defined, it is highly advisable business models. The 1998 World Cup in France
to delineate contingency and business was marked by wide‐scale digital transmission,
continuity strategies to improve the ability to while the 2006 World Cup in Germany was
react quickly and resolve problems. It is characterized by TV and cell phone
therefore crucial that, before risks are convergence. For the 2014 World Cup, with the
analyzed, this plan be defined, implemented trend for mobile devices such as smartphones
and, most important of all, tested. to be the most widely used means of
Furthermore, all input from the organizing communication, telephone companies should
committee and information from FIFA itself, be ready to offer new services and to generate
such as game databases, credentials and any and transmit full HD and 3D multimedia packets
other pertinent data, must be taken into in real time.
consideration.
The success of telecommunications
• Conducting in‐depth analysis among all companies in the 2014 World Cup also hinges
market players: Each player should be on the quality and availability of the services
12 www.cpqd.com.broffered to ticket holders, media personnel, current 194 million to 206 million in 2014, with
organizing committee staff and the population life expectancy increasing from 72.8 to 74.5
in general. To ensure quality and availability, years. Per capita income is expected to reach
planning must include not only traffic demand, 22,000 reals in 2014, compared to 15,500 in
bandwidth and user profiles, but also security 2009. In the telecommunications sector, there
aspects arising from new emerging threats that were 190 million fixed and mobile lines in the
come with technological evolution. country in 2008, and this number is forecast to
hit the 300 million mark in 20135.
The scale and scope of the infrastructure
demanded by FIFA to host the 2014 World Cup The legacy of a World Cup for Brazil will go
games is a real challenge. The enormous influx far beyond social, economic and political gains.
of people into the host cities increases the need Certainly, the country expects to benefit from a
for various basic services such as transportation, better distribution of income, more housing,
telecommunications, water distribution, higher‐qualified human resources in the hotel,
sanitation, electric power distribution, financial tourism and restaurant sectors, new job
services and health care. These systems are openings in several areas of the economy, new
interdependent, and an incident in one area can international opportunities for the country’s
have critical consequences on the others. For businesses, and improved highways, railways
instance, power failures can lead to the forced and subways. In addition, with real‐time
shutdown of telecommunications networks. transmission of the games to billions of TV
viewers, and tens of thousands of tourists and
The concept of critical infrastructure journalists coming to watch the games live in
protection, used to identify the critical the 12 host cities, the country will become the
telecommunication services during the 2007 center of the world's attention. Permanent
Pan‐American Games in Rio de Janeiro, will be benefits include significant progress in the
vital for the 2014 World Cup. telecommunications sector. The mobile phone
sector in particular must be prepared to meet
2 CONTEXT the increase in demand from the caused by the
millions of people that will descend upon the
country for the 30 days of the 2014 World Cup.
2.1 BRAZIL
The country of the moment is Brazil. A series 2.2 THE 2014 WORLD CUP
of events has demonstrated the country’s The World Cup is one of the greatest
capacity to progress and attract the attention of sporting events in the world. With 208
the whole world. The record highs of the members, FIFA has more member countries
Brazilian Real (R$) and stock market in 2009, the than the United Nations, which has 192
pre‐salt oil layer discoveries that put Brazil members. Together with the Olympic Games, it
among the largest reservoirs of petroleum in is the most‐watched event in the world,
the world, the World Cup of 2014, and the 2016 generating the greatest revenues. Considering
Olympics in Rio de Janeiro all demonstrate the direct revenue (such as transmission rights and
country’s enormous potential. sponsorships) and indirect revenue (such as
tourism and building projects), the Olympics
A country of continental dimensions (a little
generate revenue of $13 billion, compared to
over 8.5 million km²), Brazil today is the eighth‐
$10.5 billion generated by a typical World Cup
largest economy in the world. Its current gross
and $3.5 billion by a complete Formula 1
domestic product (GDP) of 3 trillion reals4 (the
Season. During the 2006 World Cup in Germany,
Brazilian local currency) is expected to grow to
FIFA pulled in $2.9 billion through TV rights,
4.7 trillion by 2014, the year of the World Cup.
publicity, tickets and licensed products alone1.
The Brazilian population will grow from the
13 www.cpqd.com.brThe 12 host cities for the 2014 World Cup in During the 1950 World Cup, also hosted by
Brazil are: Belo Horizonte, Brasília, Cuiabá, Brazil, the final match between Brazil and
Curitiba, Fortaleza, Manaus, Natal, Porto Alegre, Uruguay gathered almost 200 million spectators
Recife, Rio de Janeiro, Salvador and São Paulo. in the Maracanã Stadium in Rio de Janeiro. The
stadium will be renovated for the 2014 World
Germany also had 12 host cities. Moving Cup. The stadium capacity will be decreased
around from city to city was easier thanks to from 87,000 seats to a little over 82,000 seats,
Germany’s excellent transportation all numbered. In a scenario of great mobility, in
infrastructure of highways and trains. which direct access to a wide range of services
Furthermore, the German territory (357,000 will play an intrinsic part of people’s day‐to‐day
km2) is only slightly larger than the state of activities, this is the estimated potential number
Goiás, a Center‐West Brazilian state, giving one of cell phone users in the stadiums.
an idea of the contrast presented by the
continental dimensions of Brazil. By Besides the stadiums and their surroundings,
comparison, Brazil has 27 states and a territorial with their great crowds of people during the
extension almost 24 times larger than Germany. games, other World Cup‐related festivities and
tourist attractions will present mobile phone
Therefore, hosting the World Cup in Brazil operators with both opportunities and
will require considerable investments in challenges. Among the most popular of these
infrastructure. The government is currently are the Fan Fests.
planning investments in the order of 25 billion
reals in key sectors, but this number could easily Fan Fests were created by FIFA during the
reach 100 billion reals. Germany invested the 2006 World Cup in Germany, and were inspired
equivalent of approximately 60 billion reals to by the crowds of people who gathered to watch
prepare for the 2006 World Cup6. games in public places during the 2002 World
Cup games in Japan and South Korea. In the
Thirty‐two national soccer teams will 2010 World Cup in South Africa, an estimated
compete in Brazil in 2014. They will be chosen 400,000 people will watch the first match on
in qualifying matches that begin years before the streets of 16 cities in different parts of the
the great event. Matches are viewed around the world. The forecast is that over 25 million
globe; the World Cup in Germany was people will have watched the games in these
transmitted to 214 countries. An estimated 26 Fan Fests, which are open‐air stadium
billion viewers7 around the world watched the extensions that FIFA organizes to broaden
64 games of the 2006 World Cup on television. access to the games and attract young people
The final tally amounted to 71,000 hours of who are unable to go to the stadiums3.
broadcasting, with 18,850 newspaper, radio and
TV professionals covering the event3. It is estimated that in 2010 the number of
Fan Fest spectators will be six times greater
To comply with FIFA’s technology than that of those in the stadiums. In 2006, Fan
requirements for stadiums and their Fests were set up in 12 different places in
surroundings, telecommunication companies Germany, with a total of 18 million people
are expected to invest close to 3 billion reals3. watching the game on giant screens. In 2010,
With the advent of new services and the there will be Fan Fests staged outside the host
expected increase in users, mobile telephone country in London, Paris, Sydney, México City,
companies are faced with a great opportunity Berlin, Rome and Rio de Janeiro. In Rio de
that justifies the expansion of infrastructure. Janeiro, it will cost 25 million reals for the
This takes on even more importance when we organizers to gather 20,000 spectators per
take into consideration the momentum that the game on Copacabana beach3.
World Cup will bring to the Brazilian economy.
14 www.cpqd.com.brIn Brazil, popular festivals such as the 2000, practically all developed countries began
Alzirão, in the Tijuca neighborhood in Rio de experiencing a decrease in fixed‐line
Janeiro, have existed since the 1970s. telephones, and developing countries also are
Approximately 20,000 people gathered to watch starting to show signs of saturation. In Japan,
the Brazilian national team on a big screen the number of fixed telephone lines actually
during the 2006 World Cup in Germany. decreased between 1995 and 2005.
Another festival is the “Festão da Copa” (Big
World Cup Festival), which is scheduled to be The decreasing number of fixed telephone
held at the Ibirapuera Gymnasium in São Paulo lines is directly related to the rapid increase of
during the 2010 South Africa World Cup8. mobile telephone users. At first, these two
services did not compete for the same market.
2.3 TELECOMMUNICATION NETWORKS IN BRAZIL An examination of network traffic statistics
reveals that the growth of mobile network
In Brazil and in the rest of the world as well,
traffic is much greater than the decline of fixed
fixed telephony access is on the decline. Mobile
network traffic10. However, as the high mobile
networks, on the other hand, will tend to
service rates began to fall – thanks to
expand as mobile telephony access increases.
economies of scale and competition – many
Although this growth is beginning to show signs
users began to replace their fixed phones with
of saturation in developed countries, there is
mobile services.
still a lot of potential in emerging countries. As
an alternative to their declining market, fixed Figure 2 shows the evolution of mobile
telephony providers are investing in broadband phone access for the same set of countries a
Internet access, but are facing competition from Figure 1, including Brazil. Due to the fact that
subscription cable TV operators. mobile telephony was launched much later than
Simultaneously, mobile providers are also fixed telephony, the average annual growth rate
investing in infrastructure and technology to is still very high in most countries. As in the case
enter the broadband access market, in line with of fixed lines, mobile teledensity was
the trend toward convergence. significantly lower in underdeveloped countries
before 2000, compared to first‐world countries.
Telecommunications network access will
Therefore, in countries like Brazil, the average
increase in the coming years9. The main product
annual growth rate of the mobile phone market
of telecommunications companies, responsible
is up to four times higher than that of
for generating the greatest revenues, used to be
developed countries.
fixed telephony services. In 1995, developed
countries already boasted high rates of fixed In spite of very high growth rates, Brazil’s
phones per person, as can be seen in Figure 1, rate of cell phones per 100 people in 2008 was
while in developing countries like Brazil, this still lower than that of European countries;
rate was under one phone line for every ten though closer to that of Japan and the United
people. Between 1995 and 2005, there was a States, where the penetration of mobile
marked increase in the number of fixed services has systematically been lower than in
telephone lines in developing countries. The Europe.
higher growth rate in developing countries is
explained by the low penetration, meaning
there was still a lot more room for growth. In
15 www.cpqd.com.brFIXED lines/100 people
80 Brasil
70
China
60
50 Italy
40 Japan
30
United Kingdom
20
10 United States
0
1995 2000 2005 2008
Figure 1 Fixed‐line teledensity in selected countries
Mobile/100 people
Brasil
160
140 China
120
100 Italy
80
Japan
60
40 United Kingdom
20
0 United States
2000 2005 2008
Figure 2 Mobile teledensity in selected countries11
This shift in telephone access, with the in order to offer 3G services, providing fast
saturation and eventual decline of the fixed Internet access over mobile networks.
telephone segment, caused fixed‐line
companies to lose revenue to new entrants in Convergence has brought a whirlwind of
the mobile market. As a defensive strategy, they transformations to the telecommunications
began to see the emergent broadband Internet sector. Despite its widespread use, there is not
access market as an opportunity to get a bigger yet a universal definition for the term. This is
piece of the pie in telecommunications services. due to the fact that it is a multidimensional
process, of which the most important aspects
Mobile telephone carriers reacted to the are the technological, marketing, and regulatory
near‐saturation of their market by setting their facets12. Convergence can intensify competition
sights on the same broadband Internet and help reduce access bottlenecks, by allowing
segment. They began to enhance their networks telecommunications services to be delivered by
16 www.cpqd.com.bran ever‐increasing number of different of Internet subscribers is limited by the number
platforms. It can also generate new services and of homes with computers, a relatively expensive
stimulate innovation as new players appear on terminal for the average family’s standard of
the scene. Convergence is also associated with living. At this moment, mobile broadband
the vertical integration of global companies; if services yet target a different subscriber
these companies control the gateways, it will be segment in these countries than the huge
hard for newcomers to get in. market of pre‐paid services running over plain
vanilla devices, focusing on more sophisticated
Figure 3 show the evolution of broadband terminals and more expensive post‐paid plans.
Internet subscribers and teledensity in selected
countries from 2000 to 2008. The growth rates 2.4 MOBILE NETWORKS IN BRAZIL
are expressive and higher than those of mobile
The privatization of telecommunications in
telephone services.
Brazil took place on July 29, 1998 in an auction
The number of connections is the sum of all
at the Rio de Janeiro Stock Exchange. The
the different access technologies, such as
Telebrás System, assessed at R$ 13.47 billion,
Asymmetric Digital Subscriber Lines (ADSL),
was sold for R$ 22 billion and split up into 12
Cable modems, wireless and fiber optic cable.
companies, including three local fixed telephony
Fixed telephony companies use DSL technology,
operations, one long‐distance carrier and eight
while cable modems are the option offered by
regional mobile telephony operators13.
subscription TV operators. The other
technologies are used by these same players or Following the privatization, new companies
by alternative operators. were granted permission to compete with fixed
and mobile telephony license holders, more
As fixed telephone companies worked to
than doubling the number of players at that
offer broadband Internet access to mitigate
time. New mobile telephony concessions were
their losses from the substitution of fixed
more successful than the fixed ones, but the
telephony for mobile or VoIP services, they ran
segment has gone through a phase of
into unexpected competition from cable TV
consolidation, marked by mergers and
operators. In some countries like the United
acquisitions similar to what is taking place
States, the market share of cable modem access
internationally. Furthermore, several companies
technology is quite significant.
in the segment are vertically integrating
It is also important to remember that in themselves in the value chain, offering value‐
developing countries such as Brazil, the number added service bundles such as Internet access
and subscription TV, for instance.
Broadband / 100 people
Brasil
30
China
25
20 Italy
15
Japan
10
5 United Kingdom
0
United States
2000 2005 2008
Figure 3 Broadband in selected countries14
17 www.cpqd.com.brIn spite of being a dynamic area, the main countries, whereas developed countries are
segments of Brazil’s telecommunications sector beginning to show signs of saturation in the
today are concentrated in the hands of a few mobile telephony markets. Developing
players. Four companies control the mobile countries are able to reach high levels of
sector: Vivo, an association of Telefonica and teledensity thanks to innovative business
Portugal Telecom; Claro, controlled by América models such as pre‐paid services that help
Móvil; TIM, a subsidiary of Telecom Italia; and overcome barriers like modest purchasing
Oi, a Brazilian‐owned telco. power among people with lower income.
Vivo still has the largest market share, In the case of Brazil, as it can be seen in
although its share has declined in recent years. Figure 5, the growth of wireless penetration has
Figure 4 shows the market shares of the four largely been driven by the implementation of
main mobile providers in February 2010, when pre‐paid services, providing the less affluent
the country reached a total of 176,771,038 with access to telecommunications services.
accesses lines, according to Anatel. Mobile telephony reached 176.8 million
subscribers in February 2010, of which 82.5%
In terms of geographical coverage, 5,094 of are pre‐paid and 17.5% post‐paid16. Figure 5
the country’s 5,564 municipalities are serviced shows the growth of mobile accesses lines in
by mobile telephony (at least on their urban the country during the period from 2002 to
area). Since the population is concentrated in 2009. Today the number of mobile service
the large urban centers (Brazil is 80% urban), subscribers outnumbers the number of fixed
only two states in Brazil (in the Amazon forest phone subscribers. It’s important to note that in
region) have coverage rates of less than 90% of developing countries, with lower penetration
the population. Approximately 96.6% of the rates of fixed telephone networks, mobile
population is serviced by at least one operator, telephones are a replacement for fixed
while 64.7% can choose between at least four telephones, rather than just a complement.
alternatives15.
Pre‐paid mobile services help provide
In the previous section we pointed out that universal individual access to
similar to other countries, mobile networks in telecommunications services and show the
Brazil grew explosively from 1995 to 2005, and importance of a pricing mechanism for a
continued delivering high growth rates from product to evolve.
2005 to 2008. This is typical of developing
0,4%
20,6%
29,9%
Vivo
Claro
23,6%
Tim
Oi
25,5%
Others
17
Figure 4 Brazilian mobile providers market shares
18 www.cpqd.com.br175.000.000
150.000.000
125.000.000
100.000.000
Pre-paid
75.000.000
Post-paid
50.000.000
25.000.000
-
2002 2003 2004 2005 2006 2007 2008 2009
18
Figure 5 Evolution in the number of mobile cell terminals
3G mobile services were launched in Brazil in Deadline Binding commitment
late 2007. Licenses for this new technology All capitals and cities with population
2 years
were auctioned in December 2007, and as was of over 500,000.
expected, the winning bids came from current All cities with population of over
4 years
mobile telephony licensees. 200,000.
50% of the towns with population of
The auction notice created mechanisms 5 years between 30,000 and 100,000 and
making it possible to service the entire Brazilian 100% of those above this range.
territory. Anatel established deadlines for 3G 60% of the cities with population of
coverage, while linking these to goals for 8 years
less than 30,000.
making 2G the universal standard, with more
Table 1 Commitment for implementing 3G at 1.9/2.1
than 90% of subscribers using the GSM
GHz
standard. Table 1 below shows the 3G coverage
deadlines to which the bid winners committed. In compliance with their 3G commitments,
12% of the towns would be covered by
Besides fulfilling these deadlines, the December 31, 2012, representing approximately
winning bidders were bound to service 25% of 85% of the population. In Brazil, only 266 of its
the cities with no mobile coverage within two 5,564 towns (or less than 5%) have more than
years. However, they could use 2G technology 100,000 inhabitants, but these cities make up
to achieve this. 63% of the population (around 122 million
inhabitants).
Table 2 illustrates the current penetration of
mobile technologies in operation in Brazil. Technology Subscribers Share (%)
These statistics reveal that a little over a year AMPS 3.059 0
and a half after the first 3G commercial
CDMA 7.163.683 4,05
operations were launched, there were 8.1
million WCDMA terminals in use, or 4.6% of the TDMA 268.527 0,15
market – not including data terminals for GSM 156.368.294 88,46
portable computers with transmission rates WCDMA 8.100.193 4,58
higher than 256 Kbps. According to mobile
Data terminals 4.867.282 2,75
network operators, 739 cities had 3G coverage
by October 200919, and the deadline of five Total 176.771.038 100
years for cities with a population of over
Table 2 Current mobile network technology
100,000 was already anticipated in three years. penetration in Brazil
20
19 www.cpqd.com.br3G mobile telephony, with high speed convergence described previously can be clearly
internet connectivity, opens new market seen: the convergence of service providers; the
opportunities for service providers. 3G is the convergence of terminal equipment; and the
main reason Oi is entering the São Paulo convergence of delivery modes.
market, in addition to covering the entire
country’s territory. With 3G technology, mobile devices now
allow users to access several kinds of services
Furthermore, Anatel believes that in 2014 that formerly would have required different
the number of mobile accesses lines in Brazil terminals. Today, mobile service providers can
will be over 210 million, representing a mobile offer services that previously only fixed network
teledensity of over 100%, with more than 55 providers could offer. With the 3G platform,
million being mobile broadband subscribers. different technologies (such as DSL, Hybrid Fiber
The regulator’s projections, based on historical Coax, wireless) can be used for the same
data, point to an increase in the net operating service.
revenues of the mobile sector to around R$ 100
billion in 2014, up from an estimated R$ 40 It is possible to classify the mobile services in
billion in 2007. To achieve these numbers, just a few broad categories based on the
Anatel expects annual investments of R$ 10 bandwidth required. The three main categories
billion from 2008 through 2014.21 are:
As we can see in Table 2 , these projections • Voice Services
for 2014 suggest a steep growth from February • SMS Services
2010, when there were only 11.3 million 3G • Data Services
terminals in use22. This suggests growth not only
This classification points to two ecosystems
in the number of subscribers but also in the
in the process of convergence: mobile
resulting spectrum needs and infrastructure
telephony and information technology (data
investment requirements.
and Internet). Voice and SMS services are
2.5 MOBILE SERVICES IN BRAZIL AND THE WORLD typical of mobile environments, while data
services generally are more related to the world
Changes and trends that have affected the of the Internet. Today, data services can be
recent evolution of the telecommunications grouped into the following subcategories:
sector worldwide, such as globalization,
convergence, the decline of fixed telephony and • Music and games
the growth of mobile networks, can also be • Messages (e‐mails, instant messaging, MMS,
seen in Brazil. Three out of the four mobile etc)
service providers with the largest market shares • Browsing (Web pages, news, etc)
in Brazil are controlled by international business • Video services (downloads, streaming and
conglomerates. Only the fourth‐ranked broadcast)
company, Oi, with 21% of the market, is
• Corporate services and others
controlled by a national business group.
3G technology, and its evolution, is essential
The expansion of mobile network coverage,
for the development of data services in a mobile
its increasing penetration in the country, and
environment, since it offers high‐speed Internet
the evolution brought about by 3G technology
access.
are all factors that tend to intensify
convergence. When considering the services The proliferation of new applications and the
and applications that 3G networks propose to trend toward changing user profiles are still in
offer, or that have already become a reality in the very early stages, if you consider the
developed countries, three aspects of revenue of the sector as a whole. The impact of
20 www.cpqd.com.brthe evolution of telecommunications service that 16% use their cell phones strictly for voice
access on the sector’s revenue can be observed calls; 37% for voice calls and built‐in
in Figure 6. This figure shows the worldwide applications that don't need Internet
revenue evolution of fixed and mobile connectivity (such as calendars); 26% for voice
telephony, Internet access and data services (for calls and SMS; and, finally, only 19% use them
fixed networks) between 2005 and 2009 for the so‐called value‐added services (VAS).23
(forecast).
Among VAS users, 94% of all mobile Internet
The growth of the data and Internet markets access is strictly for multimedia downloads, 13%
(for fixed networks) has barely compensated for is for Web browsing and 11% is for game
the decline in fixed telephony, while the growth downloads. Surveyed users were allowed to
of the sector as a whole has been sustained by select more than one alternative. Of those who
the mobile segment. The growth of mobile access multimedia, 36% download ringtones,
services is sustained by the expansion of the 29% complete songs, 28% wallpapers and 19%
subscriber base, while average revenue per user images and photos.
has decreased. However, this growth is
beginning to show signs of saturation in For 3G subscribers in Brazil, USB data
developed countries, leading mobile providers modems provide access to the Internet. Some
to begin exploring the data and Internet access subscribers choose mobile broadband service to
markets. fit their lifestyle, while others use it to
compensate for poor coverage of fixed
From the point of view of user acceptance,
networks. Adoption rates of USB data modems
and consequently, generated revenue, one can
can be seen in Table 2. As pointed out in
say that the services were listed in decreasing
footnote 16, it is reasonable to assume that at
order. The vast majority of users in the world,
least two‐thirds of these data terminals use 3G
and in Brazil too, use their mobile phones
technology, which could represent more than
mainly for voice communications. Next come
40% of the WCDMA/HSPA subscriber base.
SMS messages, and finally data services. The
first applications offered by data services were With convergence, the sector’s value chain
music and game downloads, followed by MMS becomes even more complex, creating the need
and, with the advent of 3G, Internet browsing. for new functionality associated with producing
Corporate services are niche applications, and and programming digital content. It is not yet
video services are not only just beginning to quite clear who will execute these functions, or
take hold, but face regulatory issues in Brazil as what strategies the current players in the
well. broadcasting and telecommunications sectors
Nielsen Mobile Insights conducted a survey will implement.
of Brazilian mobile service users, which revealed
1.600.000
1.400.000
1.200.000
1.000.000 Data and Internet
800.000 Mobile Service
600.000 Fixed Telephony
400.000
200.000
0
2005 2006 2007 2008 2009*
Figure 6 Evolution of telecommunications services revenue24
21 www.cpqd.com.brYou can also read