MOBILE MARKETING
ECOSYSTEM REPORT
   2018, INDIA
←
→
Page content transcription
If your browser does not render page correctly, please read the page content below
MOBILE MARKETING ECOSYSTEM REPORT 2018, INDIA
Foreword

Since the last time we saw you there have been dramatic shifts in multiple areas.
Demonetization in India saw massive uptake on digitization of payments, and Trump took
over the presidency in the US. In the same period, Reliance Jio changed the
Telecom ecosystem in India by adding 200+ million new mobile subscribers, shaping it’s
vision of “Internet for Every Indian”.

We also saw 4G in India becoming mainstream, on both network and smartphone tech
adoption, it completely dominated the market. 4G featurephone is an innovation
that will take the India market by storm and will stay for long.

Lower data cost caused massive growth in data consumption via mobile devices.
Gaming, OTT Video and Digital Audio platforms became the flag bearers of increasing
data traffic. India saw the launch of seven big OTT platforms in the last 2 years (namely
Netflix, Amazon Prime, Hotstar, Voot, Zee5, Sony Liv and Wynk). With the growing OTT
consumption and the need of vernacular content, we think in the next 5 years’
vernacular content users will grow 12X compared to 2X growth for English content
consumers.

Gaming is another category showing growth in India, as it caters to not only to
seasoned gamers, but also casual gamers like kids on their parents phones. Also,
by introducing relevant native ad formats like reward videos, gaming has become a top
contender for marketers to spend on.

In 2017, 70% of India’s digital advertising budget was spent on mobile, wherein
traditional FMCG and BFSI brands also saw uptake in something as advanced as
programmatic spend. In this report we give all marketers a quick peak on a basic guide
on how programmatic works and its pros and cons, and its future evolution. With the
second edition of the report, we bring you up-to date on the latest trends in data growth,
content play, programmatic, device status; how India is moving towards a new era of
mobile marketing, seeing rampant growth in both usage and spends. We hope you like
our? efforts and do share your feedback on what you want in the next report.

Happy Reading!
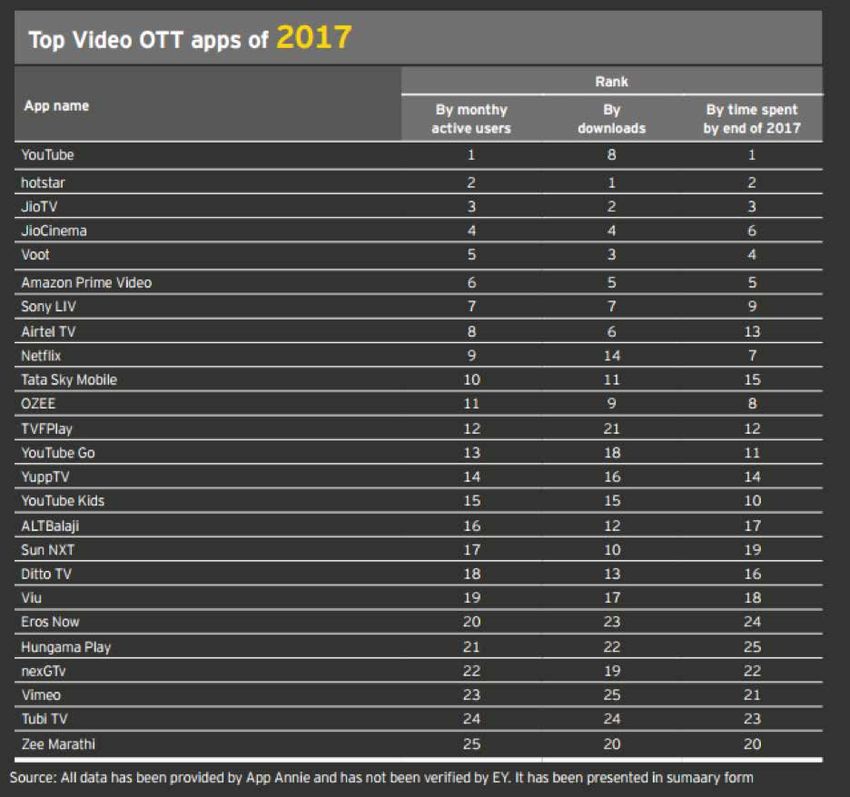
Table of Content

1: Key Trends and Insights                                 Page 01

2: Part I: Reach of Mobile among Consumers in India        Page 03

3: Part II: Mobile Handset Ecosystem in India              Page 10

4: Part III: Basics of Programmatic Advertising            Page 15

5. Part IV: Key Verticals driving the Mobile Advertising   Page 23

      a)     Gaming                                        Page 23

      b)     Vernacular                                    Page 27

      c)     OTT Video                                     Page 32

      d)     OTT Audio                                     Page 43

6: Part V: Mobile Ad Spends in India                       Page 46

7: Appendix                                                Page 48

8: MOSTT - Marketing Organization Structire Think Tank     Page 51

9: SAVE                                                    Page 53

10: How Mobile Marketing Can Boost Brand Engagement        Page 56

11: Smarties India 2018 Winners                            Page 59

12: MMA India Board                                        Page 60

13: Objective & Methodology of Research                    Page 61

Acknowledgement (About Researchers and Contributors)       Page 62
Disclaimer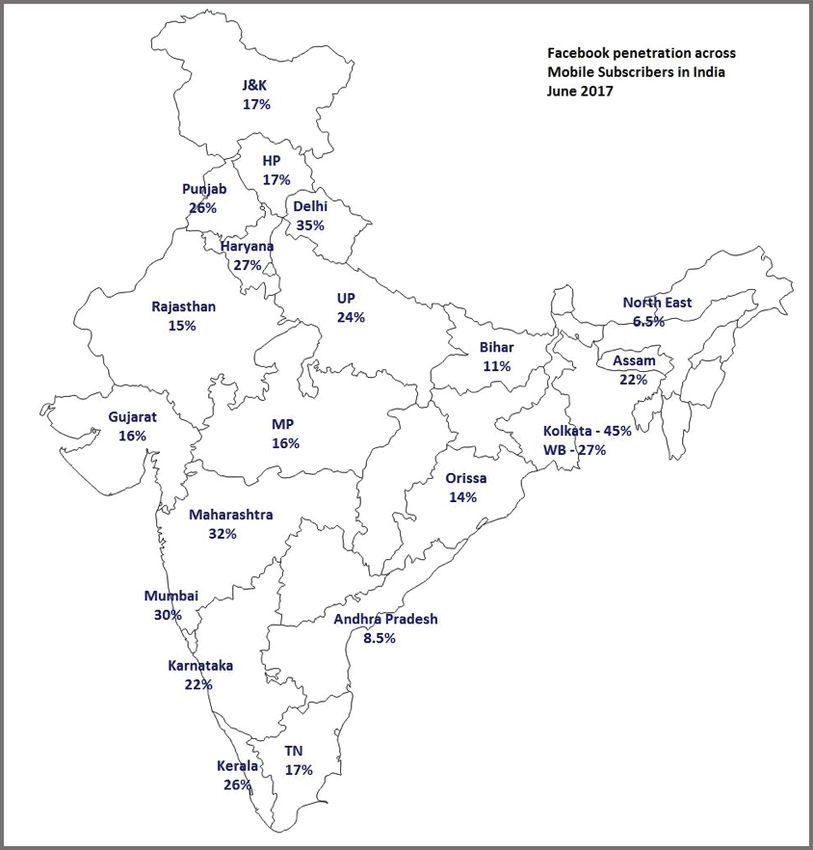
Key Trends and Insights

The Jio Brigade!
Since its launch in August 2016, Jio added 200+ million users, representing 18% of the
mobile subscribers market in India. Jio helped establish 4G in India making it affordable
for people of all financial backgrounds. Competitive telecom brands had to decrease
their data costs by 40% so that their current customers don’t opt for/get a MNP (Mobile
Number Portability) to Jio. Being the first 4G network in India, Jio now holds 40% of the
broadband traffic in India and it will keep on growing exponentially.

4G now holds approximately 82% of the data payload in the country!
As 2G users decrease with every passing month, 3G and 4G will lead the mobile internet
path till 2019 before we see the launch of 5G. Since the launch of 4G in late 2015, the total
data payload grew 7.5x and 2.4x in 2016 and 2017 respectively.

The 4G monthly data consumption is 3.8x greater than 3G data usage. 4G will lead the
growth curve, although 3G will also continue to grow in the years to come.

Compared to Urban India, Rural India is bringing three times more people online!
India added 67 million mobile internet users in 2017,out of which 44 million were from
Rural India. Rural India’s mobile internet users saw a 19% YoY growth, almost triple the 6%
YOY growth Urban India. India will cross 500 million mobile internet users by the end of
2018, we foresee that this growth will be led by the rural populace.

OTT platforms majorly engulf data traffic!
OTT audio and video combined reach more than 200 million users in India. Video takes
the largest share of the pie of content consumed on mobile internet, projecting a growth
from 49% in 2016 to 75% in 2021. OTT players are creating original content and also
including international content, which is helping them gain newer audiences and increase
view time.   Additionally, Indian YouTubers are creating great content that has also
increased video viewing in India. Growing time spent on these platforms has also led to
more advertising inventory. This also makes ads on video platforms more
receptive due to its good content value. The OTT market will keep on growing as good
content and good vernacular content is created for audiences from all regions.

                      Mobile Marketing Ecosystem Report 2018, India.                            01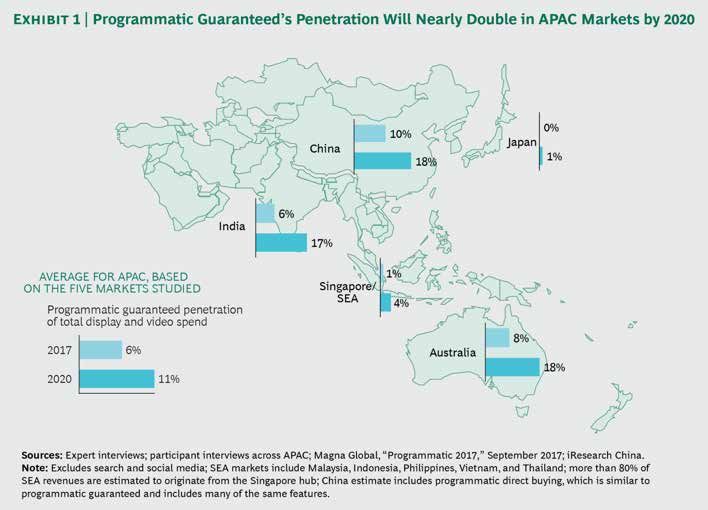
Mobile Gaming - the next big thing for Indian marketers!
Why gaming you ask? Because 84% of mobile subscribers have games on their devices.
Mobile gaming in India is high due to freemium games and free access and the segment
will continue growing at the rate of CAGR 87% till 2020. Interestingly, this boom occurred
with the help of female gamers who spent 70 mins a day playing games on their mobile
devices. 34% of Indian mobile gamers make in-app purchases, mostly paved by card and
strategy games. For marketers gaming is a platform which helps in reaching a varied
audience, that aren’t accessible anywhere else.

In the next 5 years Chat Application, Government Sites and Digital Payments will lead
to more vernacular content consumers online!
The Indian language internet users have grown from 42 million in 2011 to 234 million in
2016, a 4x growth, almost double from the 2x growth seen in the English language
internet users. This has happened due to major online platforms like e-commerce and
social media platforms launching their content in vernacular languages, reaching out to a
much bigger and diverse Indian audience. It is anticipated that vernacular language users
will increase 12 folds by 2021 and this will only be possible if OEMs create keyboards that
are available in all languages, as currently 70% of vernacular content consumers find it
tough to work with an English keyboard on their mobile device.

The average monthly mobile spends reduce!
The 4G data surge led people to use more data than voice. Furthermore, lower data
package costs helped reduce mobile spends. This led to a 21% drop in ARPU (Average
Revenue per User). We think in the coming years as more and more people use data to
make calls, voice spends will decrease as will the average mobile spends.

Featurephones are here to stay!
Contradicting all predictions, featurephone* shipments remained higher than smart-
phone shipments and they are equally an urban phenomenon as they are a rural one.
With featurephones equipped with better quality cameras, more RAM and storage space
at half the price of the smartphone, people prefer investing in them instead of a
smartphone. Soon Jio and Micromax will be launching a 4G featurephone that will cost
less than 2k. With these updates, featurephones are here to stay for the long term.

*The definition of featurephone is given in detail in the appendix

                          Mobile Marketing Ecosystem Report 2018, India.                      02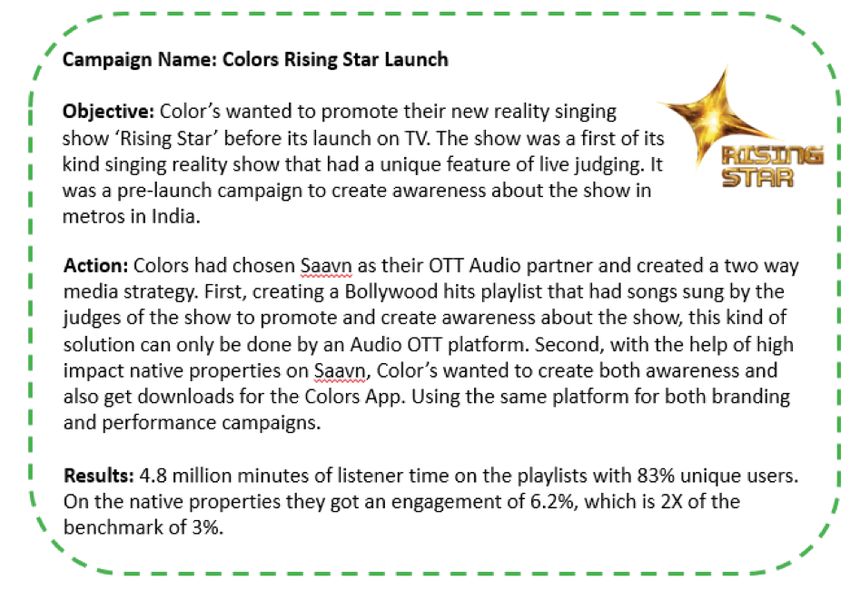
Part I: Reach of Mobile among consumers in India

India ahead of China and expected to add over 200 Mn new subscribers by 2020
20%1 of the total mobile subscribers globally now reside in India. By 2020, 27% of new
subscribers added globally will be from India - making India the largest contributor
globally to the mobile economy, placing India significantly ahead of other emerging
economies such as Indonesia and Brazil, who contribute to less than 5% of new
subscriber growth.

    Global markets by additional subcribers, 2016 -2020                                                         Mobile Subscribers in India ( in Millions)
    (Million)
                                                                                                                                                                                   1186           1167
                                           Percentage of new subscribers globally                                                                                   1127                                         1131           Rural

                                                                                                                                                     1035                                                                       Urban
                                                                                                                                        1013
      27% 21%                   5%          4%        3%           2%     2%        2%       2%            1%   944
                                                                                                                            980
                                                                                                                                                                                                                                Total

        206                                                                                                                                                            662            680            668
                                                                                                                                                                                                                    629
                                                                                                                              562          579          588
                                                                                                                   551
                    155                                                                                                                                                                     506            499            506
                                                                                                                                                                             465
                                                                                                                                               432            447
                                                                                                                                  418
                                                                                                                      392

                                 35           27       23          18      18        16          16
                                                                                                           10

        India       China       Brazil      Nigeria Indonesia      USA   Pakistan   Mexico Bangladesh Ethopia    Dec 2014   June 2015    Dec 2015    June 2016       Dec 2016      June 2017       Dec 2017       May 2018

Since the advent of Reliance Jio, India had added over 3 times2 more subscribers
compared to its subscriber growth since 2014. Subscriber growth came from both urban
and rural markets - with 53 million rural and 79 million urban new mobile
subscribers added during the period.

                Access service provider-wise market shares in term of wireless subscribers
                                                                                                                         Reliance Jio gained a whopping
                                                                                                                         18% market share within 6 months of
                                                            TATA
                                                            2.4%                                                         launch; the Top 3 telcos continued to
                                            BSNL
                                           10.0%
                                                                                                                         grow too
                                                                                           Bharti Airtel
                                                                                           30.5%                         In the last 2 years there is minimal
                 Reliance Jio
                       18.2%                                                                                             decrease in the top three Telecom
                                                                                                                         players in India. With the incoming of
                                                                                                                         Jio, the top three Telecom players
                                                                                                                         rarely saw major impact (downturn)
                                    Idea
                                  18.9%                                               Vodafone                           on their numbers. Jio took it’s share
                                                                                      19.7%
                                                                                                                         from the parent company Reliance
and also onboarded new mobile subscribers and turned many existing subscribers into
dual SIM users.
GSMA report 2017 I 2TRAI June 2018
1

                                                                Mobile Marketing Ecosystem Report 2018, India.                                                                                                                          03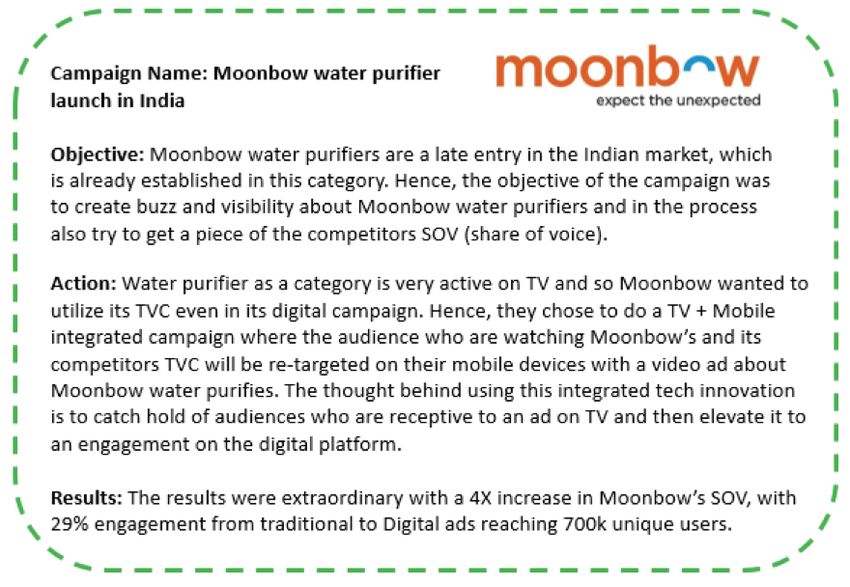
As anticipated, the Jio launch
Telco wise subscribers ( in Millions)
significantly changed the dynamics of
308
255
265
280
290
the mobile consumer in India and made
243
230
185 193 199 204 212 212 222
214
data ubiquitous, specifically proliferat-
196 196
162
172 176
190
160
205
ing the rapid adoption of 4G data
109 101 99
123
subscriptions.
72 81
33 0.18
June 2015 Dec 2015 June 2016 Dec 2016 June 2017 Dec 2017 May 2018
Since its inception in August 2016 Jio
has added almost 200 million3 mobile
subscribers and all subscribers are data users, using an average of 1GB2 data every month.
Jio users have been said to consume 100 Crore GB4 of data per month which is 50% more
than China and almost equal to the mobile data consumed by the entire US.
India continues to be the fastest growing mobile internet economy in the world
Worldwide mobile internet users grew
by 9.2%5 in 2017, while India grew at over 3059
Mobile Internet Users ( in Millions)
double the rate at 22%. The pace of 2500
2730
growth in mobile internet users puts 1740
1476
India ahead of the other two major 1348
728
economies, China and the US, which 604 637
373 456 478
210 223 232
saw a growth rate of 5.4% and 6.2% Worldwide APAC China India US
respectively. India’s growing millennial 2016 2017 (E) 2018 (E)
population and it being a developing
URBAN VS RURAL MOBILE SUBSCRIBERS (IN MILLION)
2015 2016 2017 June 2018 (E) country are the main reasons behind
478
the mobile growth. This also creates
458
373 many opportunities for Indian market-
306 291
280
219 226 ers to explore mobile as a digital
176 187
87
147
medium more extensively.
Total Urban Rural
There has been a rapid growth in the
number of mobile internet users, in the past 2 years. We have added almost 1506
million new mobile internet users (2015-2017) and expect it to increase significantly in
2018. By the mid of 2018 it is estimated that India will reach nearly half a billion mobile
internet users.
3
TRAI Jan 2016/Jan 2017 | 4http://telecom.economictimes.india-
times.com/news/thanks-to-reliance-jio-india-becomes-top-mobile-data-user/57269548 | 5eMarketer Estimates/IAMAI
& Kantar IMRB Mobile Internet Report 2016 |6IAMAI & Kantar IMRB Mobile Internet Report 2016
Mobile Marketing Ecosystem Report 2018, India. 04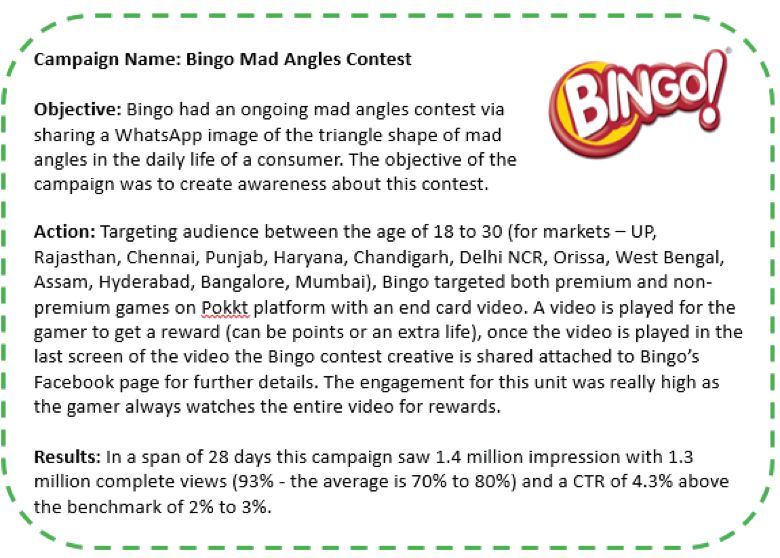
61%6 of mobile internet users in India are still from urban India, compared to 39% of users
from rural India. However, of the new users being added there has been a significant
growth from rural users, adding 100 million mobile internet users since 2015, a CAGR
(Compound Annual Growth Rate) of 29% .

Growth in mobile internet subscribers, specifically urban India, brings data usage
growth to newer areas beyond communication and social networking

          Purpose of Internet Access Urban vs Rural ( 2016 vs 2017)                                  The rise of several international and

                            85%
                                                                                                     local OTT players in the video and
                                         82%

    69% 68%                       72%                                                                music category (e.g. Netflix, Gaana,
                                                                                  60%          58%
              52%
                                                                                        49%          Wynk, Hotstar, Voot, Amazon Prime
                                                       38% 34%
                                                                      31%                            etc.) in 2016 gave an impetus for
                                                                                                     driving   data   consumption   in   the

       2016                       2017                         2016                     2017
                                                                                                     category, along with rapid drop in data
                    Urban                                               Rural                        tariffs for consumers. Urban India data
                       Communication       Social Networking      Entertainment
                                                                                                     spent on entertainment grew 58%7 YoY.
Networking and Communication continue to be a key category among mobile internet
users; Facebook user base increased by 22% YoY. Facebook in Q4 2016 saw double the
growth compared to the same period in 2015. David Wehner, CFO, Facebook in an
interview said the reason for this change was India giving free internet to their users
(by the new entrant Jio).

7
 IAMAI and Kantar IMRB Mobile Internet Report 2017 | 8Facebook Ad Manager | 9http://telecom.economictimes.
indiatimes.com/news/reliance-jios-free-data-makes-big-contribution-to-facebook-revenue-growth-in-q4/56931784 |
10
  MMA and GroupM Mobile Ecosystem Report India 2016 / Facebook Ad Manager

Comparing 2016 to 2017, 5 Telco circles showed almost double growth in Facebook user
penetration10: Delhi (2016 – 19% vs 2017 – 35%), Bihar (2016 – 5% to 2017 – 11%), Kolkata
(2016 – 25% vs 2017 – 45%), Maharashtra (2016 – 16% vs 2017 – 32%) and Assam
(2016 – 13% vs 2017 – 22%).

                                               Mobile Marketing Ecosystem Report 2018, India.                                                  05
Source: Facebook Ad Manager (data as per June 2017)

4G data usage grew 144% in 2017!

 Pan-India mobile data usage - in petabytes PB per month, December’                                      The Indian telecom market witnessed
                                                                          2.4x
                                                                                 2,360
                                                                                         Y-o-Y Growth*
                                                                                                         a paradigm shift in data consumption,
 2400           Payload 2G          Payload 4G                                              144%
 1900           Payload 3G          Total Payload
                                                              966                 1,930     135%         with 4G traffic capturing 82% share of
                                                       7.5x
 900
                                                                    823           398                    total data traffic in December 2017.
                                                                                            286%
 300                                                                                                     3G+4G contributed to 98%11 of the
 200                                            128
                                                      82       103
                                                                                                         total data payload in 20176 with a
                          85
 100    49                                                           40            32
         28          44                                                                     -20%
   0    21
                               47              46

    Dec-13            Dec-14                   Dec-15         Dec-16             Dec-17
                                                                                                         150% YOY increase. Since, the 4G
launch in end of 2015, the 4G payload has grown 7.5x and 2.4x in 2016 and 2017
respectively.

                                                    Mobile Marketing Ecosystem Report 2018, India.                                                06
Increase in 4G device penetration, aggressive 4G network rollout, lower data prices, and
development of video and locally relevant content creators have all contributed to the
rise of 4G traffic

     Data subscribers by technology in december 2017            Falling data prices, bundled data
                                                                plans, better coverage footprint, off-
                                                 182
                                                                load of 4G on to 3G, and better
                            134
                                                                device availability have contributed
          96
                                                                to growth of 3G payload.

                                                                44% of the mobile internet users in
          2G                3G                   4G
                                                                India are 4G data users, out of which
80% are Jio users.
Exponential increase in data traffic is accompanied by a significant increase in data
consumption, with 4G usage reaching approx. 11GB/month
Between 2016 and 2022, total mobile
                                                       Average data usage/month (MB)
data traffic is expected to grow CAGR
                                                                                                   11,048
40%12. By 2022, 97%12 of mobile data                          2G                                                          10,604
                                                                     3G-4G multiple
will be consumed by smartphones.                              3G       2017:3.6x
                                                              4G
Industry analysts predicted that 4G
consumption will reach 11GB/month                                                                                 2,970

in 2022, however, this statistic was
reached in 2017.
                                                                                            849
 Nokia MBIT Report 2016 | 12 Ericsson Mobility
11
                                                              680          753
Report – India, June 2017                               216          220              259                   320

                                                         2014          2015                 2016                  2017

4G growth was led by Jio, but other Telcos benefitted as well!

35% of the total 4G subscribers (approximately 1 out of 3 4G subscribers) came from
rural territory.
Jio is credited with bringing 4G to India but Jio also should be credited for the ramping
up of the 4G network for incumbents like Airtel, Vodafone, and Idea. Consequently, while
Jio, being the 4G lead operator with 160 million subscribers (by end 2017), increased
122% (88 million) subscribers in the year 2017; incumbent mobile operators grew 457%
(64 million).

                            Mobile Marketing Ecosystem Report 2018, India.                                                         07
4G subscriber addition 2016 versus 2017 4G subscriber Dec 2018: 238Mn
4.6x
Incumbents 78Mn
1.2x
Jio
160Mn
0% 10% 20% 30% 40% 50% 60% 70% 80% 90% 100%
2016 2017
Further analysis points that Jio added 26% rural subscribers using 4G, incumbents added
53% of their 4G subscribers to the rural market. By the end of 2018, its estimated that
India will have 300 million 4G subscribers, of which 58 million will be using a 4G
featurephone and the remaining 81% of subscribers will be using 4G over a Smartphone.
Urban versus Rural 4G subscriber addition 2017
Incumbents
Jio 26% 74%
0% 20% 40% 60% 80% 100% 120% 140% 160% 180%
Rural Urban
Mobile Marketing Ecosystem Report 2018, India. 08Older generation in India gets hooked to data usage, as voice ARPU decreases as
low as Rs.45 monthly!
It is quite evident that average mobile
Average Mobile bill per month ( in INR)
expenditure has been decreasing con- 439
tinuously from 2014. Previously in the 387 369 349
report we have learnt that this decrease 235 275
231 225
230
is due to increased affordability of 214
173 204 129 124
mobile data, which decreased from 2014
45
to 2016, with a marginal rise in 2017
2013 2014 2015 2016 2017
owing to higher usage of mobile data. Total Voice Data
Expenditure on Voice has been steadily
decreasing (at a CAGR of -32%) since 2013; and with the popularity of VOIP and video
chatting, the expenditure on voice services has decreased dramatically in recent times.
Since, last year we have seen a drastic
Mobile Bill: Agewise
drop in ARPU across all age groups,
552
other than the 45
377 year group , which was one of the most
358
322
314
239 235
275 277 225
256 247
298 268
268 prolific user of voice services last year
210 231 220
166 195
142
183
witnessed a significant drop. Much of
119
104
29 48
31
51 54 48 this drop can be attributed to changes
45yrs 45yrs in mobile plans offered by service pro-
2016 2017
Data Voice Total viders, which are more data centric with
very low costs for voice packages. Data
spend by the >45 year group has decreased given lower price of data packs and overall
usage saturation of the age group.
Nokia MBIT Report 2016 |13 IAMAI and Kantar IMRB Mobile Internet Report 2016
11
Mobile Marketing Ecosystem Report 2018, India. 09Part II: Mobile Handset Ecosystem in India
India sees the emergence of new category of handsets - 4G Feature phones!
The concept of the 4G feature phone is relatively new for the Indian market. It is expected
to add more users to internet services, digital content consumption and digital
transactions from their mobile phones. Data prices are at an all-time low and operators
are working on strengthening their 4G connectivity in India.
Reliance Jio is expected to introduce attractive bundling offers to proliferate rural and
lower tier customers. With the experience of minimal data on the 4G feature phones,
these users are expected to migrate to smartphones in next few years becoming the
major smartphone growth drivers in the Indian market.
Feature phones get an extended life; another year before smartphones overtake
feature phones in India
India offers a huge untapped opportuni-
Shipments growth status 2014 - 2020 (F)
(Numbers in millions) ty to the smartphone vendors, which is
185
179.3
150.3
160.1
evident from the entry of several new
136.1 136 137.2
smartphone vendors in the Indian
116.7 117.9
80.5
103.7 109.1 85.9
market in last 2 years, a key driver to the
53.8 smartphone growth. All this while, fea-
2014 2015 2015 2017 (f) 2018 (f) 2019 (f) 2020 (f) ture phones remain the dominant cate-
Feature Phone Smart Phone
gory in the overall mobile phone market
Source: IDC June 2017
accounting for 52%13 of the total mobile
phone shipments in India in Q1 2017 and constituting more than 50%14 of the overall
mobile market in 2016. 2016 saw the feature phone de-growth slowing down and it is
likely to contribute the majority of the mobile phone shipments in 2017 as well, as the
migration to smartphones is expected to further slow down due to the introduction of
low-cost 4G feature phones and its continued relevance to its sizeable target consumer.
*https://telecom.economictimes.indiatimes.com/news/one-out-of-two-feature-phone-users-wish-to-buy-4g-feature
-phone-in-next-6-months-idc/62755518
According to a study by the MMA and Kantar IMRB, contrary to popular belief,
featurephone users spend more money on their mobile plans. The ARPU for the survey
respondents was almost 20% higher compared to the national average. The survey also
revealed that feature phones are entertainment hubs - with respondents listening to
music, watching videos and playing games being key activities. Additionally, only 15%
Mobile Marketing Ecosystem Report 2018, India. 10of featurephone users said they intended to switch to a smartphone on their next
purchase.
Cashing in on this continued interest for feature phones, Reliance Jio in June 2017
declared16 to launch their 4G feature phones for as low as USD28 (INR 1800). Micromax
and Lava are also in this race and will be launching their 4G featurephones in the same
price bracket.
Smartphone market has swiftly shifted to 4G
At a time when other major smartphone markets like China, USA are seeing single digit
growth, the Indian smartphone market is expected to grow in double digits during next
five years. Thus, India provides a huge opportunity for smartphone vendors to set up and
expand their base.
The entry of Reliance Jio in the telecom services market has disrupted the incumbents
dramatically. However, it proved immensely beneficial for consumers. The smartphone
market has swiftly shifted to 4G, voice and data have become more affordable and new
use cases have been developed to drive migration to smartphones. This graph shows,
smartphone shipments have steadily
Generation wise smartphone shipments
(In millions) risen by 35% in the last 3 years and
2.5G 3G 4G
forecasted to grow by another 49% by
182.4
157.2 2020 reaching 185 million by 2020. Also,
133.8
111.3 expected that by the end of 2017, 95% of
78.3
54.3
63.9 the smartphone shipments are 4G
30.5
22.4
3.7 9.3
28.6
2.3 0.1 5.3 3.5 2.9 2.6 smartphones, drastically reducing the
2014 2015 2016 2017(F) 2018(F) 2019(F) 2020(F) 3G smartphone share.
Source: IDC May 2017
42%17 of the smartphone market lies below US$100. The premium segment market is also
bigger than some of the more mature markets like Hong Kong, Taiwan and Singapore.
This provides a wide spectrum of opportunities for vendors to pick and choose the
consumer segments and price categories to focus upon.
As per the analysis by eMarketer (August 2018), India now has 337 million smartphones,
making it the second largest user base in the world, ahead of the USA and only behind
China.
IDC June 2017 | 14IDC June 2017 |15MMA and Kantar IMRB Feature phone report India (Q4 2016) (among a sample
13
size of ~1000 consumers (feature phone users) in Metro and Non metro cities)| 16http://indianexpress.com/article/
technology/mobile-tabs/reliance-jios-4g-volte-enabled-feature-phones-to-launch-soon-report/
Mobile Marketing Ecosystem Report 2018, India. 11Xiaomi is changing the fabrication of the Indians smartphone industry
China based vendors like Xiaomi, Vivo, Oppo, Transsion now account for almost a 50%18
share of the smartphone market in India. They have been able to achieve this on the back
of their hi decibel ATL and clever BTL marketing spends, perceived better specifications
– price value, wide & deep retail level distribution and online exclusive models. India
based vendors were slow to react to the market shift to 4G Smartphones and combined
with intense competition from China based vendors, Indian brands faced challenges in
2016-17 in the smartphone market.
Handset brand manufacture’s market share in India (Q1 2018)
Q4 2017 saw many changes in-terms of
Handset shipments; it saw the maximum
5%
7% growth compared to the same time in
7%
30%
the last 3 years. Additionally, Xiaomi
25% threw Samsung from the reigning
26% smartphone in India and became the
leader in shipments in Q4 2017. The
Xiaomi Samsung Oppo Vivo Trannssion Others
sales that were led by Xiaomi were
primarily replacements and upgrades where users shunned their existing Smartphones.
In Q1 201818, Transsion made its debut in the top 5 handset manufacturers in India with
more than a three fold annual growth. The China based group has 4 brands under its
umbrella (namely - Itel, Tecno, Infinix and Spice). With its primary focus on offline chan-
nels, Itel and Tecno branded phones are doing well in the highly price sensitive India
market.
IDC May 2017 / IDC Q1 2018
18
China based smartphones are growing as Indian manufacturers struggle
to become 4G first!
China based mobile phone vendors have successfully made inroads in the market via
both online and offline channels. LOVE (Lenovo. Oppo, Vivo, Xiaomi) v/s MILK (Micromax,
Mobile Marketing Ecosystem Report 2018, India. 12Leading smartphone OEMs by price brand
Below 4K 8K- 10K 15K- 20K
Intex Technologies Vivo Mobile India Samsung India Electronics
02 04 06
01 03 05
4K - 8K 10K- 15K Above 20K
Samsung India Electronics Rising Star Mobile India Hong Fu Jin Precision Electronics
Intex, Lava, Karbonn)19 as popularly referenced for Chinese Vs Indian brands. Overall
LOVE brands have been mono-channel brands, offering great value for money with
aggressive marketing. The success in the transition to Omni-channel would be a key
factor for them to maintain their standing in the market with internal competition
intensifying. At the same time, what Oppo did a couple of years ago , has been recently
replicated by Vivo considerably and such marketing strategies have had a direct bearing
on the market standings. The biggest challenge for LOVE brands would be to sustain
such a campaign through all the quarters and at the same time, not enter each other's ’
territories resulting in internal competition. Initially affecting the Indian brands’ market
share, they now begin to enter into each other’s market share.
Quarter on quarter we are witnessing the MILK (Micromax-Intex-Lava-Karbonn) brands
not being able to leverage any of the anchors they enjoyed over the years. Be it
establishing themselves across the country or becoming the first choice for first time
mobile (Feature as well as Smart) users, the brands have not been able to support a
consumer’s journey. While they could not have matching marketing campaigns as their
Chinese counterparts and preferred to ‘wait’ till they (India) burnt their money, their grip
on the market became weak impacting their market standings. The success of itel and
Xiaomi brands, which are not aggressively marketing by spending crores, are case
studies for MILK brands to take cues from on how to manage visibility. It is high time for
MILK brands to strengthen their digital presence, not only from the selling perspective
but also from the angle of influencing youth, which directly or indirectly, are responsible
for two out of three Smartphone sales in India.
‘Make in India’ has provided the right impetus to the mobile manufacturing in the country.
Approximately, 65%19 of phones sold in India are assembled in India, in 2017, the share
would touch 90%. India is fast emerging as the new manufacturing hub for the Mobile
Phones and components with 40 brands already manufacturing in India, made possible
Mobile Marketing Ecosystem Report 2018, India. 13by relatively lower labor costs, government push and incentives for local manufacturing
coupled with high differential duties on import . In the next few years, Indian vendors are
expected to start exporting devices to South-East Asia and African countries from their
manufacturing operations.
Android continues to be the most preferred OS choice of India
Android in the last 2 years has been Smartphone OS Share
2017 01
able to maintain its kingship in the OS 97% 2.2% 0.3%
2016 04 95% 3.3% 1.5%
market in India, with average of 96%21 2016 03 97% 1.2% 1.3%
2016 02 97% 2.2% 0.5% 0.03%
market share. What is interesting is 2016 01 97% 2.5% 0.5% 0.22%
2015 04 95% 3.2% 1.2% 0.66%
that iOS sees a jump in Q4 every year 2015 03 97% 0.9% 0.6% 1.34%
2015 02
and has managed to slightly increase 94% 1.8% 1.1% 3.01%
2015 01 94% 1.7% 2.3% 4.28%
its market share in the past year. 86% 88% 90% 92% 94% 96% 98% 100%
Android iOS Tizen Windows Phone
Source: IDC June 2017
Apple, though slowly, is growing in India!
iPhone may be less than 3%21 of the smartphone market in India, but it is expected to
reach a 10mn active user base in India in 2018 (it stands at 8.9 mn active users as of
December 2017). Though, there are already many OEM brands that have surpassed this
milestone like Samsung who has 120 mn and Xiaomi who has 28 mn active users as of end
2017; Apple has done exceptionally well in a price sensitive market like India where 56%
of the Smartphones sold are still sub Rs. 10,000.
CMR Research Q1 2017/IDC June 2017 21IDC June 2017 |21http://www.cxotoday.com/story/smar-
19
phone-sales-hit-due-to-demonetization-idc/ / CMR Research
Mobile Marketing Ecosystem Report 2018, India. 14Part III: Programmatic Ecosystem in India
The advertising industry is on a march toward automation. Plenty of advertisers today are
buying digital ads without speaking to a single human at a media company, and print and
TV ads might not be far behind. Automated, or programmatic, buying is growing not only
because it makes ad transactions more efficient but because it can make them more
effective, as long as the right data is applied.
Programmatic is no longer a buzzword, many agencies, and evolved advertisers
(including e-commerce, auto and FMCG) have dabbled (read budget) on DSP platforms
and retargeting platforms. A pure programmatic buy would help a marketer to cap the
frequency of exposure of their campaign across publishers and let them transparently
manage the media buys across a list of publishers. Layer this with data and they have
created an audience buying campaign which, can also be used for retargeting to an
audience set.
India is still in nascent stages of
programmatic adoption relative to more
digitally mature Asia-Pacific markets
like Australia and Japan. According to a
Forrester Study, programmatic buying
adoption for India is at 38% compared
to the overall APAC adoption rate of 41%
. That said, adoption is poised to pick up
in the next 24 months as 52% of
marketers in India are either planning to
adopt or currently evaluating whether
to adopt programmatic buying. Also, in
India maximum programmatic spends
(92%) on mobile are done on mobile
app inventory.
Even though programmatic is still
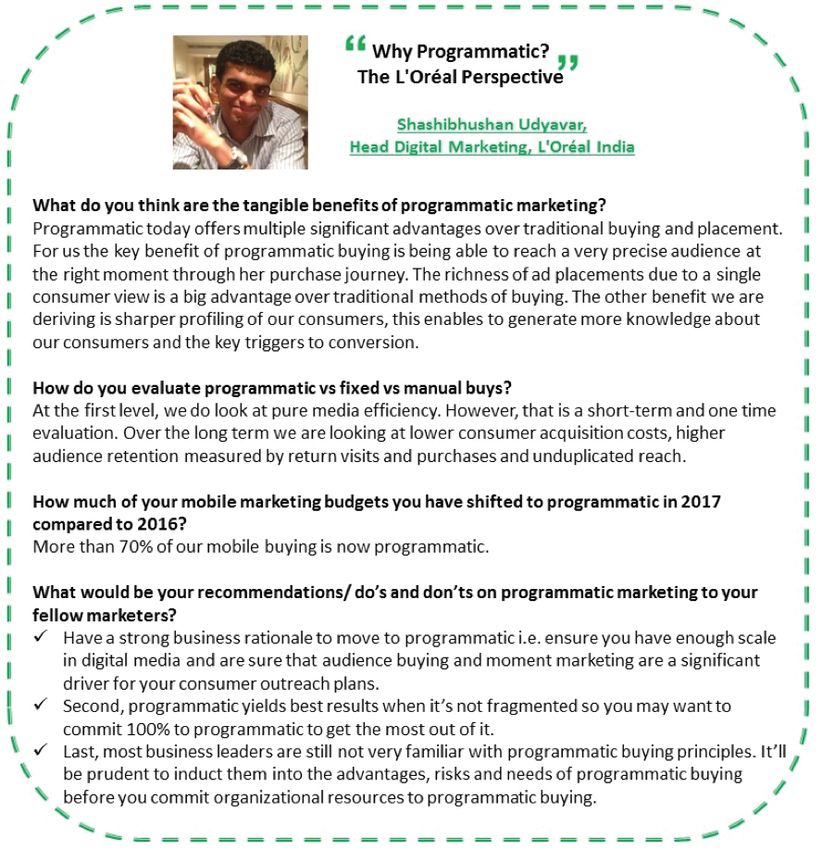
growing in India, big and traditional business players like Pepsi, Ford and L’Oréal have
shifted over 50% of their digital budgets to programmatic advertising.
In this section we talk about the basics of ad serving, at what level programmatic comes
into the picture, effectiveness of programmatic for stakeholders, the current state of
programmatic in India as well as case studies of brands on the frontline of programmatic.
Mobile Marketing Ecosystem Report 2018, India. 15India is in the state of Programmatic evolution, saw 81% growth in 2017
While India is still in the early stage of adoption compared to digitally mature Asia-Pacific
markets like Australia and Japan, it has quickly ramped up the programmatic space.
According to a recent study, India ranks near the top globally in terms of growth for
programmatic ad spending*.
2016 2017 % change 2018 % change
Switzerland $46.00 $100.80 119.00% $227.70 126.00%
India $116.20 $210.60 81.30% $371.70 76.40%
Finland $43.60 $95.20 118.30% $149.80 57.40%
Australia $508.70 $776.40 52.60% $1,213.40 56.30%
Italy $297.70 $412.00 38.40% $587.50 42.60%
China $3,854.30 $6,038.20 56.70% $8,526.70 41.20%
Sweden $168.80 $338.60 100.50% $456.20 34.70%
Spain $197.10 $263.90 33.90% $348.00 31.90%
Germany $631.90 $853.30 35.00% $1.082.8 26.90%
Japan $1,981.70 $2,703.90 36.40% $3,390.40 25.40%
Russia $119.20 $159.10 33.50% $197.90 24.40%
France $649.80 $821.30 26.40% $1,011.60 23.20%
US $24,224.00 $30,928.30 27.70% $38.035.6 23.00%
Denmark $218.80 $294.80 34.80% $360.20 22.20%
Canada $878.70 $1,094.40 24.50% $1,324.00 21.00%
UK $3,697.80 $4,436.90 20.00% $5,259.80 18.50%
Netherlands $425.80 $643.30 51.10% $717.80 11.60%
New Zealand $26.30 $30.40 15.40% $33.60 10.70%
Worldwide $40,915.30 $54,470.80 33.10% $69,513.50 27.60%
*Source: Onaudience.com, "Global Data Market Size 2016-2018," Feb 19, 2018
Mobile Marketing Ecosystem Report 2018, India. 16India at power with China in terms of Programmatic Guarantee buys
An interesting point specifically for programmatic in India is its propensity towards
guaranteed buys. It is poised to be one of the top markets for programmatic guaranteed
- with penetration projected to reach 17% in 2020 based on a Boston Consulting Group
study, on par with that of Australia or China. This may be due to prominent publishers
who are driving uptake of programmatic buys and a concern with ad fraud, which drives
spend from direct traditional buys to programmatic guaranteed. This is a promising
trend, given how India has had most of ad spends in direct budgets.
Source: Boston Consulting Group, 2018
https://www.bcg.com/publications/2018/rise-programmatic-guaranteed-advertising-asia-pacific.aspx
Mobile Marketing Ecosystem Report 2018, India. 17Currently, marketers in India tend to approach programmatic as a direct response driver,
accessing mostly remnant long-tail inventory. As marketers grow more savvy, they will
understand its value for brand campaigns with the ability to purchase premium
audiences and inventory. Likewise for publishers, while there has been encouraging
movement by publishers to offer access to more of their inventory via programmatic
(e.g. TrueCaller with roadblock inventory and Saavn with audio inventory ), there are still
legacy publishers who view programmatic primarily as a means to move cheap or unsold
inventory. The trend towards transacting more premium inventory via programmatic is
expected to accelerate programmatic adoption within the market, with prominent
advertisers such as Ford India transiting majority of direct deals to transact
programmatically* .
Why programmatic for publishers?
Programmatic allows publishers to maximize their earnings from their inventory by:
Identifying and selling each impression uniquely as compared to a block of
impressions. This allows each impression to be sold at the maximum value, in turn
maximizing the yield of overall inventory
increasing the value of the remnant inventory, as each impression is sold for the value
of the visitor as against the time slot / placement. Suddenly the impressions which
were difficult to sell start looking premium to advertisers as they are targeting
visitors
helping publishers to control the pricing for their inventory using business rules,
allowing them to offer differential and / or premium pricing based on the
requirements and niche audience
also helping publishers to gauge what is selling on a real time basis, which segment
of users is getting higher value and what content are these users consuming on their
sites. Thus allowing them to improvise and tweak their publishing strategies based on
demand
creating private marketplaces which can help a publisher create an exclusive club of
bidding advertisers and to be a part of this club, advertisers can be pushed to spend
either a minimum threshold or an over premium floor price
* https://www.thinkwithgoogle.com/intl/en-apac/tools-research/programmatic/about-time-consoli
date-ad-buys-get-more-from-teams-media/
* http://www.forbesindia.com/article/special/saavn-launches-programmatic -audio-advertising-in-
india/45717/1
* https://www.thinkwithgoogle.com/intl/en-apac/tools-research/ programmatic/about-time-
consolidate-ad-buys-get-more-from-teams-media/
Mobile Marketing Ecosystem Report 2018, India. 18Why programmatic for advertisers?
Programmatic buying is nothing but an efficient method of buying from an advertiser’s
perspective.
It reduces the need for manual operations across the board and hence helps in
reducing the related cost
Allows the advertiser to buy only the relevant inventory, by giving them an
opportunity to evaluate each impression before making a buying decision (read
audience buying) across publishers. It also helps them to cap the number of
Mobile Marketing Ecosystem Report 2018, India. 19exposures of a campaign to each user across publishers, further increasing the
reach of a campaign within the same budget
It also allows a unique window for a advertiser/publisher to look into the audience
and content profile to which their campaign is getting exposed, enabling them to
understand the segments and content which are converting, even better
With programmatic method, it is easier to optimise a campaign based on
conversion and viewable impression data. However, the auto optimizations are done
through platforms with integrated machine learning algorithms and is not available
across the DSPs
Why programmatic for agencies?
Agencies have been asked this question several times and it is hard for the agency to
differentiate its value in an open exchange buying method. However, the might of an
agency is highlighted in the programmatic direct and programmatic guaranteed models.
With programmatic guaranteed and programmatic direct, agencies can influence the
buying price towards the lower end of the spectrum (read floor price) which is
beneficial for the advertisers and at the same time can allocate a larger chunk of
spends towards deserving publishers
Agencies are also benefited by the transparency layer available within the
programmatic buying platforms and the granular level data, helping them to analyze
and optimise their buys
Programmatic / automation reduces the operational flak from the system e.g. it’s
faster to take the campaign live, real time reports etc
Types of Bidding – Waterfall model
Whenever a publisher’s ad server would receive an ad request, it would start calling a
predefined list of ad networks, SSPs for filling in the inventory. The list is prioritized by the
publisher, either manually or dynamically, based on the yield (return) being generated by
each respective network for relevant campaigns. The first network/SSP in the hierarchy
to respond with a bid (highest within that SSPs environment) which is higher than the
floor price is accepted as the winning bid. This is called as waterfall model.
Mobile Marketing Ecosystem Report 2018, India. 20The waterfall model for programmatic buy
Typical Publisher
High CPM Yield
Sponsorship
Premium Direct Direct Demand
Custom Executions
Non Standard
Context Targeting
High Volume
Standard Direct Audience Targeting
Guaranteed Delivery
ROS & RON
Prioritized Remnant
Premium Programmatic PMP
Repackaged Media
Open Programmatic SSP Undifferentiated Media
Ad Nets Demand-Supply imbalance
Technology Workflow
High Low
Direct Manual
Orders
Direct
Programmatic
Orders Programatic Direct
Price Targeting
Priority Efficiency
Predictability Accessibility
Preferred Deals Semi - Automated
Deal ID
RTB Private Auctions
Automated
Open Auctions
Low High
Types of Bidding – Header bidding (the publisher side optimization)
The limitation of the waterfall model is that there is a missed opportunity in accepting the
first acceptable bid. The networks lower in the funnel of the waterfall model end up
evaluating only impressions which have not already been bought and cannot see
impressions for which they were willing to pay higher money but being lower in the funnel
could not evaluate. Hence loss of an earning potential for the publishers.
To overcome this problem of the waterfall model, the header bidding was introduced. The
header bidding script, once integrated in the publisher inventory, contains all the relevant
information of each ad unit on the page. As soon as the page starts loading on the user's
Mobile Marketing Ecosystem Report 2018, India. 21browser, the header bidding scripts
Waterfall Auction vs. Header Auction
present in the header of the page
$ 2.00 floor $ 2.00 floor
starts an auction and fires request to
Request BID BID
Partner #1 Partner #1
all the exchanges simultaneously. This Below Floor
$1.50
Passback Below Foor
$1.50
allows a publisher to add more bidders Partner #2 BID
$2.20
Partner #2 BID
$2.20
Winning Floor Request Losing Bid
to the auction of the inventory, Partner #3 BID
Partner #3 BID
$3.00 $3.00
increasing the chances of getting Not Called Winning Bid
BID BID
Partner #4 $2.40 Partner #4 $2.40
higher fill rates and better pricing. This Not Called Losing Bid
is also important for advertisers, as it
allows networks and exchanges to have ‘first lookup’ of each impressions allowing the
opportunity to be able to bid for the relevant impressions.
Future trends and challenges for programmatic in India
There is general optimism around programmatic adoption and maturation in India,
affirmed by encouraging results from both the demand and supply side as publishers
offer more sophisticated and premium ad buys while advertisers move more spend
towards programmatic.
However, there are still obstructions to overcome for mainstream programmatic adoption
such as the prevalence of direct deals in the market and the perception of programmatic
inventory as the channel reserved for transacting low-value inventory. There is also
demand to harness richer data/audience segments by publishers to bring more value for
advertisers, something which is not yet the norm in the India market.*
https://assets.kpmg.com/content/dam/kpmg/in/pdf/2017/01/Digital-the-new-normal-marketing.pdf |
*
https://www.thedrum.com/news/2017/07/25/programmatic-moving-beyond-the-buzzword-india-buy-
*
and-sell-side-adoption-matures |
http://www.forbesindia.com/article/special/saavn-launches-programmatic-audio-advertising-in-india/
*
45717/1 |
https://www.thehindubusinessline.com/info-tech/programmatic-tech-set-to-steer-digital-advertising/
*
article10027030.ece
Mobile Marketing Ecosystem Report 2018, India. 22Part IV: Key Verticals driving the Mobile Advertising
(A) Mobile Gaming
By 2020, mobile gaming app consumer spend to reach 1 billion USD
Mobile Games Forecast - Annual App Store Consumer Spend Mobile Gaming in India is dominated by
India
$1.58 Source: App Apple freemium games. 2016 saw a 200%23
5 year CAGR: 87%
increase in gaming app revenue, which
$1.08 will grow at a CAGR of 87% till 2020,
Revenues
crossing the USD 1 billion mark. The
$0.58 Indian gaming market is booming, with
Growth
maximum growth (in both downloads
200%
$0.08
2015 2016F 2020F
and revenues) driven by Google Play, as
proliferation of low-cost Android
devices across lower-tier Indian cities continues to soar. In the last 2 years , game
downloads in India has doubled, with Google Play generating 13 times23 more downloads
compared to App Store.
In the last 2 years there has been an increase of 80%23 in app store revenue from games.
Whilst iOS constituted to less than a tenth of game downloads, iOS gamers contributed
around 70%23 of the revenue, as iOS was the more premium segment of the market. On
the contrary in 2016, Google Play revenue grew to match iOS as the majority Android
users started spending on games. This trend is expected to grow as more and more
premium users delve in high-end Android phones. Similarly, a CAGR of 48%23 growth in
mobile app download will be seen by 2020.
Games Downloads
Mobile Games Forecast - Annual Downloads iOS and Google Play Combied, India
India
400 M
68 5 year CAGR: 48%
Source: App Anne
58 2.1x
300 M
48
Downloads
Downloads
200 M Google Play
38
iOS
28
Gro
wth 100 M
116%
18
08 0M
2015 2016F 2020F Q2 2014 Q2 2015 Q2 2016
23
Nasscom and App Annie 2016
Mobile Marketing Ecosystem Report 2018, India. 23Strategy and Social Card Games Drive Monetization!
Download growth can be observed across nearly all gaming categories on Google Play in
India, as its emerging user base continues experimenting with different types of games.
However, Q2 2016 highlighted a shift in India’s gaming behavior, with a significant
increase in time spent on immersive strategy games versus casual games compared to
the same quarter in the previous year. While convincing users to spend money on games
remains a challenge in India, two categories stand out for solid improvements in
monetization: strategy and social card games. The latter has been able to ride on the
success of mobile adaptations of traditional Teen Patti card games.
Top 5 Games Categories by Time Spent Top 5 Games Categories by Revenue
India, Android Phone India, Google Play
Q2 2015 Q2 2016 Q2 2015 Q2 2016
1.7x 1.8x
Strategy Strategy
0.8x 1.9x
Social Card
Casual
2.9x 1.4x
Action Sports
1.3x 1.3x 1.1x
Sports Casual
1.2x 1.3x
Social Card Action
Source: App Anne
Source: App Anne
0 50 100 150 200 0 50 100 150 200
Indexed Revenue Indexed Revenue
For consumers the madness in gaming is just getting better - more engaged users on
mobile gaming apps
Gaming has grown to be more popular than entertainment, news, social media and
other general apps. 9 out of 10 users24 have games on their phones regardless of their
gender or the price of the phone. 59%24 mobile gamers in India are Millennials.
There are a few facts that we can start off with,
which are a clear indication of the madness that is gaming!24
84% of mobile subscribers have games on their devices
37% have more than 3 games on their phone.
Almost 9 in 10 indian smartphone owners play games weekly
A whopping 57% prefer single player games
1 in 10 people play the same game regularly for over a year
24
Tune India Gaming 2016
Mobile Marketing Ecosystem Report 2018, India. 24Indian gamers tend seen to be more engaged than their global counterparts
How long do you play the games you typically like? India is in the top 25%25 of countries
globally for mobile user retention. After
12%
14 days of installing a gaming app,
16%
49% around 24% of the users retain the game
globally, whereas in India, it is 30.1%25.
23%
Also, 12% mobile gamers in India play a
A Few days A Few weeks A Few months Over a year game for a year.
Source: India and Mobile Gaming Report 2016
Women make up just 22%26 of all mobile Women download more games compared to men;
Puzzle, strategy and casual games most popular
gamers in India, however, when it comes
to the frequency of playing mobile Monthly Mobile Game Downloads
12% Puzzle 23%
games, 79% of females reported that 16% Strategy 20%
they played daily, compared to 71% of 7% Casual 16%
14% Arcade 13%
males. 24% 33% 76% 67%
25% Action 12%
18% Racing 7%
Additionally, female gamers spent nearly More than 5 Games 5 Games or less
8% Others 11%
70 minutes26 a day playing mobile
games, in comparison to 55 minutes per day for males. 33%4 women gamers have
downloaded more than 5 games on their smartphones, 37% more than men. Strategy
seem to be the common genre of games that both men and women like to play.
25
Tune India Gaming 2016 | 26Gamesbond 2016
Another trend in the Indian mobile
India Mobile Gaming: Single player, two player or team?
gaming market is the rise of single-
11% 11%
Single Player
player games. These have become
14%
54%
18%
63%
Player vs Player increasingly popular and managed to
Team Games
9%
Team vs Team top the charts of the gaming apps with
21%
highest download rates.
63%27 women play single player games
versus 54% men. The reason these games are preferred, stems from the Indian
population’s need to commute locally , making single player games the way to pass this
time. Also, for single-player games there is usually no requirement for internet connection
or hefty data streams.
27
Tune 2016
Mobile Marketing Ecosystem Report 2018, India. 25Case studies for Mobile Gaming
Mobile Marketing Ecosystem Report 2018, India. 26(B): Rise of vernacular/Indic content in India
9 out of every 10 new internet likely to prefer vernacular/Indic content to access
internet online
Internet user base in India (In Millions) The Indian language internet users
have grown from 42 million28 in 2011
to 234 million in 2016, a 12x growth,
almost double from the 2x growth
th
row 134
~ 12xg seen in the English language internet
~ 2x gro
wth users. Over the next five years, it is
expected that 9 out of every 10 new
2011 2021
English language internet users Indian language internet users internet users in India are likely to
prefer vernacular or regional
languages to access the internet. The Hindi internet user base is likely to outgrow the
English user base by 2021. The English language still accounts for 56%28 of the content
online, whereas, Indian languages account for less than 0.1%. The anomaly here is that in
India only 12%29 population can read/write English. The Indian government is investing on
digital literacy and using digital media to help reach the rural parts of the country. Within
the last year, Hindi content on the web has grown by about 94%28, whereas English
content has grown by 19%. Furthermore, the increase in the availability of local language
content online would help in increasing the internet penetration by 24%28.
While Chat applications and digital entertainment will bring new Indian language users
online growing at 19% CAGR30 in line with the growth in total Indian language user base.
Going forward Digital write-ups, digital payments, online government services, e-tailing
and digital classifieds are emerging categories among Indian language users. Indian lan-
guage user base accessing these categories will grow at a CAGR of 26% to 33% over the
next five years. With increased local language support and content, these categories will
see increased adoption among users.
28
IAMAI and IMRB Proliferation of Indian Language Report 2016 | 29Census India | 30KPMG & Google Indian Languages
Defining India’s Internet Report 2017
Mobile Marketing Ecosystem Report 2018, India. 27Category wise Indian language internet users-2016 & 2021P(in million)(11)
450 33% 35%
32% 32%
Total internet user base for 8 languages ( 2016 - 186 million) : (2021 P - 426 million)
396 392 30%
400
30%
350 26%
301 25%
CAGR ( User base adoption)till 2021P
300 284
22% 20%
250 19% 19% 21%
200 185 15%
175 172
169 167 165
150
115 10%
106 100
100
58 5%
47 41 42
50
24
0 0%
Chat Digital Social Media Digital News Digital Digital Online E-tailing* Digital
Applications Entertainment Write-ups Payments Government Classifieds*
Services
User base 2016 User base 2021 (P) CAGR
(in million) (in million)
The next 5 years look really promising in the growth of Indian language usage
penetration among various businesses. Digital Entertainment is already on its epitome
with Hindi and seeks to reach the same with Gujarati, Kannada and Malayalam by 202131.
eTailing sees a comparatively low growth, whereas Digital News see a sustainable
growth. The maximum growth is seen in Digital Payments with a 2x31 growth across all
languages.
31
KPMG & Google Indian Languages Defining India’s Internet Report 2017
Mobile Marketing Ecosystem Report 2018, India. 28The smartphone manufacturers also need to deploy Indic language supported keyboards
as 70%32 of the Indian language users find it difficult to operate English keyboards.
While many people are creating indic content, more effort required to
make it mainstream
Affordability, accessibility, applicability, and awareness-building are the four areas where
most of the work has to be done in-terms of mobile growth in India. The first 2 areas are
growing, we really need to work on the latter two - applicability and awareness building.
Many brands have taken a step forward and have included regional language in their
interface. However, there is more that still needs to be done.
Mobile platform Launch Language Purpose
August, 2015 Hindi, Tamil, Telugu, India’s first vernacular
Malayalam and Gujarati rail booking app in
5 languages
2012 Hindi, Tamil, Telugu To double non-English
Bengali, Punjabi, Marathi, users every 6 months
Kannada and Gujarati in India
among others
2009 Hindi, Bengali, Marathi, ‘Tap to Translate’
Tamil, Telugu, Gujarati, ‘Google Loon’- provide
Punjabi, Malayalam and connectivity in rural
Kannada. areas
January, 2015 Hindi, Marathi, Gujarati, Create a localized
Bengali, Tamil, Telugu, experience; can deliver
Kannada and Punjabi. on a global scale sitting
in India.
November, 2012 Hindi First to create a Hindi
app to increase the
account holders to 80%
who use apps
32
KPMG & Google Indian Languages Defining India’s Internet Report 2017
In December 201633 YouTube declared that it
will be showing users in India more content in
their preferred local language. The localized
content languages will be available on both
YouTube’s homepage and in its trending
section, and will be targeted based on users’
watch history. The new languages include
Mobile Marketing Ecosystem Report 2018, India. 29Bengali, Gujarati, Hindi, Kannada, Malayalam, Marathi, Punjabi, Tamil and Telugu. A great
decision by YouTube as by 2021 vernacular content consumers in India will be more than
double5 English content consumers (536 million34 vs 199 million).
Where does the Future Stands?
User generated content:
We will see a rise in the participation of the Indian language users, due to the vernacular
friendly apps and platforms. Thus, allowing a transition from passive users to active users,
leading to a rise in opinion and user generated content. Tools such as dictionary, spell
check, grammar check, translation & transliteration should be developed for Indic
languages (publishers and developer both).
Size does matter:
The major issue when it comes to developing a web page/app in regional language is its
size. Since regional language fonts are complex in comparison to English, such a
webpage is often ‘heavier’. This limits page size and it takes more time for a regional
language web page to load. This limitation often restricts site versatility that ultimately
affects the end-user’s experience.
Indic Keyboards:
45% of Indian language users face challenges in text input on chat applications. Adoption
of input mechanisms such as voice to text support, local language keyboards and
transliteration is expected to improve user experience. Inclusion of Indian language fonts
and keyboards in mobile handsets depends on the discretion of the hand-set
manufacturer. So OEMs have to put their best foot forward and integrate keyboards that
at-least have 22 national languages of India.
Voice to Text:
Facebook and Google are both developing “Voice to Text” software for different
languages, which is a killer combination and will resolve the content creation problem
completely. People who don’t know how to write can also send messages and create
content via this tool.
An outlook for Marketers!
1) Availability of quality supply for advertisers.
2) Ability of the Brands to connect with “Bharat”(multi-language and rural) and not
only “India” (predominantly english speaking)
3) Better price realization for publishers will drive further investments in enlarging the
quality base of Indic publishers
33
http://indiatoday.intoday.in/technology/story/youtube-in-
dia-will-now-show-more-local-language-content/1/830066.html | 34http://brandequity.economictimes.india-
times.com/news/media/how-ott-players-are-geared-up-to-woo-indian-viewers/57275909
Mobile marketing ecosystem report 2018, India. 30Case study for Vernacular Content
Mobile Marketing Ecosystem Report 2018, India. 31(C): Mobile OTT Video
India has 250 million online video viewers, 100 million OTT viewers
India is a developed market for entertainment content consumption, with entertainment
being one of the top 3 internet activities for both Rural and Urban internet users. The
consumption of video has jumped many folds, especially on mobile devices. The future
predicts, video being the largest share of the pie on content consumed on mobile
internet, growing from 49%35 in 2016 to 75% in 2021.
2016 Content consumption by category for 2021
10%
2% Mobile Internet users in India 6%
2%
16%
49%
39%
75%
Video Streaming audio File Sharing Web and Another Data Video Streaming audio File Sharing Web and Another Data
The appeal of video is easy to understand. It lends itself to storytelling in a more
engaging and entertaining way than print and radio. Consumers pressed for time and
conditioned for instant gratification—meaning almost everyone naturally gravitate
towards video. Online video is the fastest-growing segment with year-on-year (YoY)
growth rates reaching 64% with almost 250 million online video viewers in India in 2017.
(EY, India’s Media and Entertainment Sector, March 2018 report)
In India, the number of video-capable
devices and connections are expected
to grow 2.2X between 2016 and 2021,
reaching 800 million36 in number.
Currently, the number of OTT (Over the
Top) / VOD (Video on Demand) players
in India have significantly increased
reaching over 1001 million users with the
likes of Hotstar, Voot, Netflix, Amazon
Prime, Sony Liv and Zee5. In a very
small period Netflix gathered 4.2 million active subscribers, at a minimum of Rs.500 per
37
month subscription for a single screen user. Leading the chart is Hotstar at 63
million37 active users banking on its first movers advantage, live cricket streaming and
premium HBO content (especially Game of Thrones).
KPMG Media and Entertainment Report 2017 | 36EY Digital Opportunity 2017|
35
http://brandequity.economictimes.indiatimes.com/news/media/how-ott-players-are-geared-up-to-woo-indian-
37
viewers/57275909
Mobile Marketing Ecosystem Report 2018, India. 32You can also read