BROADCASTERS ADAPTING TO DIGITAL TRANSFORMATION IN APAC
←
→
Page content transcription
If your browser does not render page correctly, please read the page content below
BROADCASTERS ADAPTING TO
DIGITAL TRANSFORMATION IN
APAC

December 2020
Frontier Economics Ltd is a member of the Frontier Economics network, which consists of two separate companies based in Europe (Frontier
Economics Ltd) and Australia (Frontier Economics Pty Ltd). Both companies are independently owned, and legal commitments entered into by
one company do not impose any obligations on the other company in the network. All views expressed in this document are the views of Frontier
Economics Ltd.
BROADCASTERS ADAPTING TO DIGITAL TRANSFORMATION IN APAC

            CONTENTS
            Executive Summary                                                                    4

            1    Introduction                                                                    7

            2    Trends in consumption and revenues of broadcasters in the APAC
                 region                                                         9
                 2.1    Introduction                                                              9
                 2.2    Sector wide changes that have affected the broadcasting sector in APAC   10
                 2.3    Overall broadcasting sector trends                                       13
                 2.4    Trends in TV advertising revenues                                        18
                 2.5    Trends in Pay TV                                                         20
                 2.6    Online video service providers                                           23
                 2.7    Profitability of broadcasters                                            26
                 2.8    Benchmarking the profitability of APAC broadcasters with other sectors   29
                 2.9    Analysis of broadcaster profitability                                    31
                 2.10   Conclusions and commentary                                               35

            3    Broadcasters adapting to digital transformation                                 37
                 3.1    Using digital technologies to broaden content offering to consumers      38
                 3.2    Using digital technologies to deepen engagement with customers           40
                 3.3    Adapting their advertising proposition                                   42
                 3.4    Diversifying commercial offering                                         44

            4    Regulatory and policy best practice in the broadcasting sector                  45
                 4.1    Introduction                                                             45
                 4.2    Public policy interventions in broadcasting sectors                      45
                 4.3    Best practice on when to intervene                                       46
                 4.4    Examples of best practice in intervention                                47
                 4.5    Conclusion                                                               54

            ANNEX A Online video service providers IN APAC                                       55

            ANNEX B FTA broadcasters in APAC                                                     56

            ANNEX C Pay TV broadcasters in APAC                                                  57

            ANNEX D Measuring profitability                                                      58

            ANNEX E Profitability and sector trends by country                                   59

            ANNEX F Case studies of broadcaster profitability                                    74

            ANNEX G Case studies of broadcasters adapting to digital
                    transformation                                                               89

frontier economics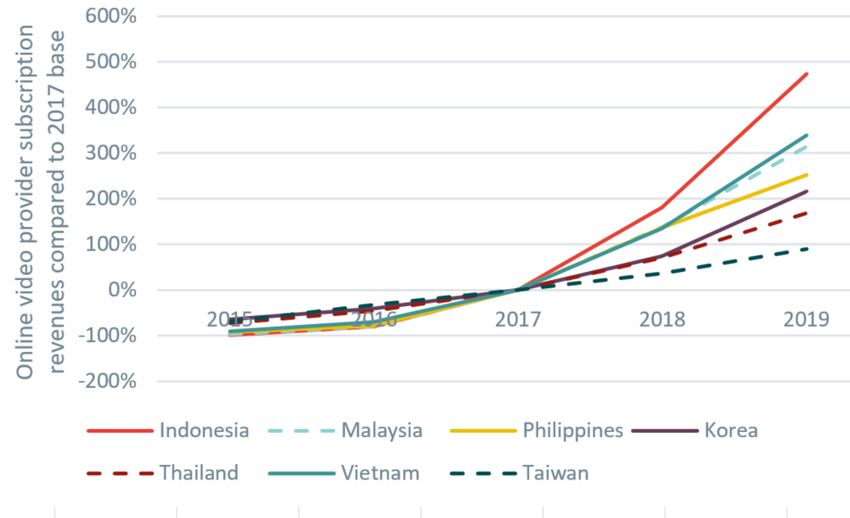
BROADCASTERS ADAPTING TO DIGITAL TRANSFORMATION IN APAC

            EXECUTIVE SUMMARY
            It is common for policy makers around the world to intervene in the broadcasting
            sector to achieve cultural, social or economic objectives. In recent years, as online
            video service providers (OVSPs) have entered into the video services sector,
            traditional broadcasters have sometimes asked Governments and policy makers
            to ‘take action’ or ‘intervene’ to try and reduce the claimed negative impacts from
            the changing market dynamics. They often characterize these requests as an effort
            to ‘level the playing field’—to ensure that OVSPs have the same regulatory
            burdens as traditional broadcasters.
            With a specific focus on APAC1 nations, Facebook has commissioned Frontier
            Economics (Frontier) to assess the competitive interplay between traditional
            broadcasters and online video service providers. The aim of our report is to:
                 1. Assess whether the arrival and growth of online video service providers has
                    materially affected traditional broadcasters.
                 2. Identify the factors that policy makers should consider before intervening.
            With regards to the first aim, we find no consistent evidence of the growth of
            online video service providers negatively affecting traditional broadcasters,
            with a number of traditional broadcasters adapting to the challenges arising
            from the growth of digital technologies. This suggests that there is no clear
            overall case for further government intervention to ‘level the playing field’.
            If, however, governments do consider intervening, we suggest a number of
            principles they should follow to ensure their action is proportionate, targeted and
            beneficial to viewers.

            Country level EBITDA profit margins remain above
            or close to 30% in most cases
            For the countries included in this study, our review does not show any common
            pattern on revenues and profits of the sector from the entry and growth of online
            service providers. Subscription revenues for pay TV services, for example, have
            generally grown across the APAC region (doubling in Vietnam and Sri Lanka), with
            the exception of Malaysia and Thailand, where declines were recorded. There has
            also been a mixed impact on TV advertising revenues, which have grown in
            Indonesia, the Philippines and South Korea, stayed flat in Vietnam, and fallen in
            Malaysia, Thailand and Taiwan.
            Average profit margins of Free-To-Air (FTA) and Pay TV broadcasters at a country
            level have been volatile. However, while there has been a modest decrease in
            margins in some countries, EBITDA2 profit margins remain above or close to 30%
            in most cases - with many companies adapting and maintaining profitability.
            Broadcasters in some countries, such as Thailand, have experienced a more
            persistent, downwards trend in profit margins over the past seven years. We find

            1
                This report considers the following countries: Indonesia, Malaysia, Pakistan, the Philippines, Taiwan, South
                Korea, Sri Lanka, Thailand and Vietnam.
            2
                EBITDA (Earnings Before Interest Tax Depreciation and Amortisation) is a measure of profit.

frontier economics                                                                                                             4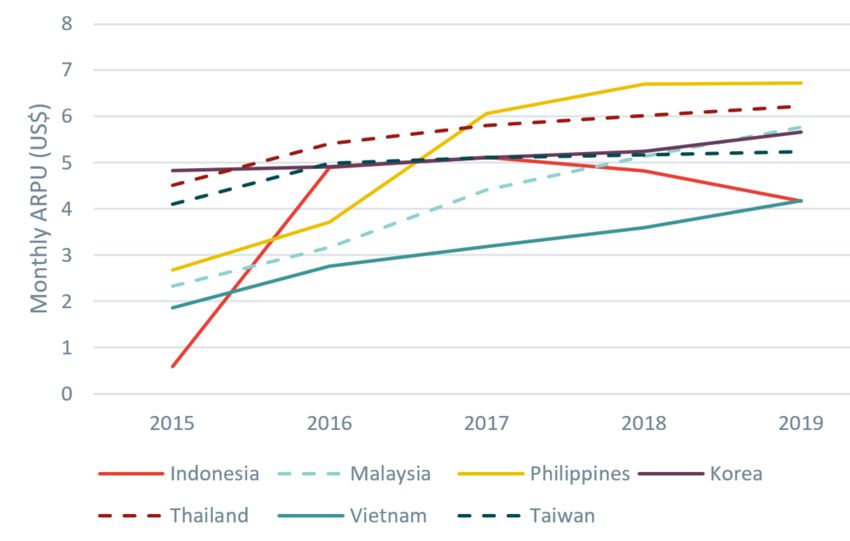
BROADCASTERS ADAPTING TO DIGITAL TRANSFORMATION IN APAC

            that a range of factors is driving the change in profitability3, and, in some cases (for
            example, Thailand), TV broadcasting profits were decreasing before the entrance
            of online video service providers.

            Broadcasters can, and have, adapted to digital
            transformation
            Digital disruption has provided a challenge but has also provided an opportunity
            for broadcasters to develop existing and build new strategies. Therefore, one of
            the reasons OVSPs have had no consistent, clear impact on traditional
            broadcasters is that a number of the latter have adapted to change. Our review
            identified four main ways in which successful broadcasters have adapted to the
            presence of new technology in the sector. They have:
            1. Broadened their content offering, whether by expanding their channel
               portfolio, offering content online, or investing in new and exclusive content. The
               Pakistani FTA broadcaster HUM Network, for example, offers on-demand
               content and live streaming via its website and mobile apps.
            2. Deepened their engagement with consumers, through use of social
               networks, offering clips, or partnering with video-sharing platforms. TrueVisions
               in Thailand launched its own user-generated content platform, while MNC in
               Indonesia offers voting for its talent shows on its app.
            3. Adapted their advertising propositions by investing in targeted ads, which
               are often deployed during on-demand programming. For example, Filipino
               broadcaster GMA Network recently partnered with Singapore Media Exchange
               (SMX), an advertising exchange that allows brands to target their advertising
               based on various audience segments.
            4. Offered new digital services, by licensing their content to independent
               OVSPs (such as MNC licensing to iflix), or via a digital customer loyalty scheme
               (such as TrueVisions’ TrueYou.)

            OVSPs are different to traditional broadcasters.
            Policy makers should be sceptical of requests to
            “level the playing field” and any such efforts must
            be evidence-based and proportionate
            Given the lack of clear impact that the arrival of OVSPs has had on traditional
            broadcasters, the evidence we found does not support a general policy of
            government intervention on behalf of the latter.
            Policy makers should therefore be sceptical of requests to ‘level the playing field’,
            especially when they seek to impose additional burdens on new entrants, rather
            than reduce existing regulatory burden. Such claims may be motivated by a desire

            3
                Most important are macro-economic factors that affect advertising and the exchange rate also affect costs
                of licensing non-domestic content. Pay TV subscriptions can be affected by loss of TV rights (for example to
                high value sports) and in some countries piracy issues could also affect revenues – the main report provides
                more detail.

frontier economics                                                                                                             5
BROADCASTERS ADAPTING TO DIGITAL TRANSFORMATION IN APAC
to raise rivals’ costs, rather than to achieve public policy goals. Furthermore,
intervention without clear public interest could end up choking off investment,
dampening competition and restricting innovation, to the ultimate detriment of
consumers – whether through higher prices or less choice.
Where governments do contemplate intervention, any intervention should
ensure that the benefits exceed the costs, based on sound evidence and
analysis, and minimises unintended consequences. Regulations that might
have made sense for traditional broadcast may not make sense for OVSPs. This
is even more critical in fast moving markets, such as video services, which are
subject to rapid technological change and where many differentiated providers
offer services via a multitude of different business models. Where the intervention
is motivated by an objective to ‘level the playing field’, policy makers should
consider the possibility of easing some regulatory burdens on traditional providers,
rather than imposing additional burdens on new entrants (i.e., ‘levelling down’,
rather than ‘levelling up’).
Our report provides examples of best-practice policy making in broadcasting,
which take into account these principles. These examples highlight the risks and
trade-offs involved in interventions and demonstrate the importance of using a
rigorous structure in making policy intervention decisions.
frontier economics 6BROADCASTERS ADAPTING TO DIGITAL TRANSFORMATION IN APAC
1 INTRODUCTION
Facebook has commissioned Frontier Economics to undertake an economic study
which considers the competitive dynamic between new online video service
providers and “traditional” broadcasters (including FTA and Pay TV broadcasters)
and the implications for public policy.
Digital disruption has affected many sectors, particularly creative and publishing
sectors whose output is “intangible” such as ideas, art and innovation. The
advances in communications networks, devices, apps and services as well as
production have rapidly changed how audio-visual content is both produced and
consumed, enabled entry from new suppliers4, and brought together new forms of
content that compete for our attention, offering the content either on an advertising
funded basis or a subscription (or mixed).
However, despite these shifts the fundamental business model of TV broadcasting
remains the same: broadcasters and online video services providers attract
audiences by creating (or acquiring) compelling content; and aggregating and
distributing that content in a way that engages audiences in an ongoing way.
This report examines broadcasting sectors in developing/middle economies, with
a focus on the APAC region, during this period of change. It focuses on the
following countries: Indonesia, Malaysia, Pakistan, the Philippines, Taiwan,
Thailand, South Korea, Vietnam, Sri Lanka.
The report considers the evolution of indicators of traditional broadcasters’
performance, and the extent to which competition from online video service
providers threatens traditional broadcasters. It assesses whether any challenges
to traditional broadcaster revenue or profitability are the result of wider trends in
advertising sectors or consumption of audio-visual content.
In this report we use the following terms:
“Traditional broadcaster” – meaning a broadcaster who derives most of its
value by distributing its content on linear channels over either terrestrial,
satellite or cable. Traditional broadcasters either adopt two broad strategies:
□ “FTA broadcasters” distribute content for free and rely solely on advertising
revenues;
□ “Pay TV broadcasters” supply bundles of channels in Pay TV subscription
packages.
“Online video service provider (OVSP)” – meaning a broadcaster who delivers
professionally produced, principally long form content via broadband
connections (such as Netflix or iflix). These are typically subscription based but
can also be advertising funded.
Video sharing platform – a platform which enables users to upload and publish
content, often short form and user generated content (such as YouTube).
These are distinguished from online video service providers and are out of
scope of this report.
4
Note that digital disruption has enabled new suppliers of both TV content, and advertising inventory.
frontier economics 7BROADCASTERS ADAPTING TO DIGITAL TRANSFORMATION IN APAC
This report is structured as follows.
Section 2 summarises trends in broadcasting sectors in APAC. This includes:
□ Sector wide changes that have affected the broadcasting sectors (section
2.2);
□ Trends in revenues of ‘traditional’ FTA and Pay TV broadcasters, and online
video service providers in APAC emerging sectors (section 2.3 - 2.6);
□ Profitability of traditional broadcasters, including analysis of financial
viability (section 2.7 -2.8);
□ The profitability of the last five years of three broadcasters in more detail
(2.9).
□ Conclusions on the factors that have affected the broadcasting sector and
the profitability of the sector.
Section 3 provides examples of the strategies that have been adopted by
broadcasters adapting to digital transformation including broadcasters from the
APAC region as well as international examples.
Section 4 provides best practice guide for policy making / regulation in the
context of digital disruption.
frontier economics 8BROADCASTERS ADAPTING TO DIGITAL TRANSFORMATION IN APAC
2 TRENDS IN CONSUMPTION AND
REVENUES OF BROADCASTERS IN THE
APAC REGION
2.1 Introduction
This section reviews how broadcasters’ business fundamentals (revenues,
subscribers and profit) have been affected during the period of “digital disruption”
in the countries of interest.
Online video service providers have entered the sector in the countries in this
report in the period 2016-2018 in most countries. The online video service
providers increase the range of services available to consumers by offering
additional choice alongside and consumed with the traditional Pay TV and FTA
service providers. They do this based on a different business model: they operate
often on a multi-national basis, they use broadband networks to distribute content,
and they provide a range of content on-demand for users to view, alongside
personalised recommendations.
However, as noted above, at the same time digital disruption has affected
traditional broadcasters in other ways. For example, technology has changed how
consumers, especially younger demographics, interact with TV content. It is now
common to access content via recommendations from social media on a hand-
held device, rather than via the Electronic Programme Guide (EPG). This has
caused the existing traditional broadcasters to invest in and adapt their businesses.
Furthermore, there are many country specific factors that are likely to affect the
business fundamentals. These are not just the macroeconomic issues (such as
how the state of the economy can affect outcomes) but sector-specific issues such
as broadcasting transmission standards. Therefore, caution should be exercised
in interpreting the trends observed.
Our review finds the following “high level” trends.
Broadcasting revenues and subscriptions continue to grow in most countries
across the APAC This is likely supported by ongoing transition to digital
television and increased broadband penetration.
In less developed economies, both Pay TV and online video service providers
are seeing strong growth in revenues and subscriptions. However online video
remains a smaller sector than Pay TV (measured by subscription revenues).
In more developed economies (like South Korea), online video service
providers are overtaking traditional Pay TV broadcasters in terms of numbers
of subscribers, though online subscription revenues remain below Pay TV
subscription revenues.
frontier economics 9BROADCASTERS ADAPTING TO DIGITAL TRANSFORMATION IN APAC
2.2 Sector wide changes that have affected the
broadcasting sector in APAC
There have been three structural factors that have shaped the broadcasting sector
and explain some of the variation observed in the different countries studied.
The transition to Digital Terrestrial Television
The increase in broadband penetration
The entry of new online video service providers.
Digital Terrestrial Television (DTT) transition
The last decade has seen investment in terrestrial transmission technologies. To
make more efficient use of valuable spectrum broadcasters have invested in
upgrading their transmission equipment to digital technology, while at the same
time consumers need to update their reception technology (purchasing new set top
boxes). Terrestrial transmission relies on a network of masts broadcasting to
aerials on houses or buildings. For the user it is cheap to install. These changes
mean broadcasters are able offer enhanced services (more channels, better
quality resolution and additional services such as text, radio or limited interactive
services).
Different APAC countries are at different stages of the transition to DTT, as
demonstrated in Figure 1. Some faster-moving countries such as South Korea and
Taiwan have already achieved the switch-off of analogue terrestrial television
transmissions (“analogue switch-off” or ASO). But other countries, which were
slower to launch the transition to DTT, or whose transition process has endured for
many years, are yet to reach ASO. For example, Vietnam is targeting ASO in 2020,
while the Philippines’ target is currently set for 2023.
frontier economics 10BROADCASTERS ADAPTING TO DIGITAL TRANSFORMATION IN APAC
Figure 1 Digital Television Transition statuses in APAC
Year of
Country launch Year of ASO Subsidies and Incentives
South Korea 2001 2012
Subsidies for set-top boxes and
for broadcasters who do not
enough funds to invest in digital
Taiwan 2009 2012 content
Pakistan 2015 Not set
4.2 million poorer Malaysians
given digital television decoders
Malaysia 2016 2019 for free
Tax incentives for set top box
Vietnam 2010 2020 and transmitter purchasing
Thailand 2014 2020
Indonesia 2012 2024
Financial incentives for small
scale broadcasters and financial
subsidies for digital set top box
Philippines 2017 2023 purchases
Sri Lanka unknown Not set
Source: Launch: South Korea, Malaysia, Vietnam, Thailand, Indonesia, Philippines: ITU; Taiwan: Su, H. and
Chang, S-C. (2015); Pakistan: ZTE (2017);
Note: DTT: Digital Television Transition; ASO: Analogue Switch-Off
Post-2020 dates based on national targets. To our knowledge, no prospective ASO date has been set
for Pakistan or Sri Lanka. Sri Lanka in 2008 initially decided to use the DVBT-2 standard used in
Europe. But in 2014 the Government announced a change of course instead using the ISDB-T found
in Japan, the Philippines and some Latin American countries. To date we are unaware of formal roll
out of DTT in Sri Lanka.
Where countries have been slower to deploy digital terrestrial TV technologies
there is a greater likelihood that audiences will have migrated away from terrestrial
transmission towards other technologies. It is notable that a small number of
European countries (Belgium and Switzerland) have already started to switch off
their digital terrestrial service. The risk is that where ASO is delayed, then audience
viewing habits will be engrained in using alternative methods (including broadband
where it is available) meaning the benefits of launching a digital terrestrial
transmission platform will be lower where viewers have already migrated to new
platforms.
Broadband penetration has increased in all countries
A key driver of subscriptions to online video service providers in APAC will be
individual countries’ broadband penetration (the proportion of households with
access to broadband). As the penetration of broadband that can support TV
services (greater than 5Mbps-20Mbps5) increases, broadband networks can
increasingly be used to provide video services.
Fixed broadband penetration has been on an upwards trend across most of APAC,
as shown in Figure 2. While fixed broadband penetration is generally on the rise in
5
Typically, a video stream can be supported with a broadband speed of 2-5Mbps, however, with multiple
users in household sharing a connection a faster speed would be required to provide a resilient service.
frontier economics 11BROADCASTERS ADAPTING TO DIGITAL TRANSFORMATION IN APAC
APAC, there is a large disparity in progress between countries. For example,
Figure 2 shows several APAC countries, such as Pakistan, where broadband
penetration is growing, but is still low (less than 25% of households with access to
fixed broadband). Meanwhile other countries either have penetration levels which
are already high or have a faster growth in broadband penetration. For example,
Vietnam has seen an increase from just over 20% to almost 60% broadband
penetration since 2015.
Figure 2 Evolution of fixed broadband penetration since 2012 in APAC
120%
100%
Broadband penetration
80%
60%
40%
20%
0%
2012 2013 2014 2015 2016 2017 2018 2019
Indonesia Malaysia Pakistan
Philippines Korea Sri Lanka
Thailand Vietnam Taiwan
Source: Frontier analysis of Telegeography data
Notes: Penetration calculated as total DSL, cable, and fibre/LAN subscriptions divided by number of
households
This means that demand for online video service providers may be higher in
countries where broadband penetration is higher. However, the development of
mobile network services (increased coverage and capacity on 4G, and in the future
5G) may offer some growth opportunities for online video service providers.
Entry of online video service providers
The increase in coverage, take up and capability of broadband has reduced
barriers to entry for new content suppliers leading to the entry of many online video
service providers.
There are now many subscription online video service providers across the APAC
region. These include global brands such as Netflix and Amazon Prime, regionally
focused operators such as iflix, and a range of national focused providers. The two
biggest online providers in the APAC region are Netflix and iflix. Netflix entered all
APAC countries in 2016. iflix entry occurred in 2014 for Malaysia, the Philippines
and Thailand, in 2016 for Sri Lanka and Indonesia and in 2017 for Pakistan and
Vietnam. Other online video service providers are listed in ANNEX A. They include
Singapore’s Hooq, Indonesia’s Oona, Hong Kong’s Viu, and Vietnam’s VTC Now.
The sector is also offering mobile only plans which offer lower price subscriptions.
frontier economics 12BROADCASTERS ADAPTING TO DIGITAL TRANSFORMATION IN APAC
Local online video services, whether specialist broadcasters or part of a traditional
broadcaster’s offering, date back further towards the beginning of the 2010s.
Various online video service providers across the region are also shifting their
business model from one of Subscription Video On Demand (SVOD) to
Advertising-based Video On Demand (AVOD). A notable example has been iflix
which has made the transition from a more SVOD-based model to a primarily
AVOD model (though premium, ad-free subscriptions are available).6 While survey
evidence found that 57% of subscribers said they would drop Netflix if it ever
introduced ads, iflix’s growth has continued despite its shift to AVOD.7 The shift
from SVOD to AVOD is likely to continue to unfold in APAC with more and more
online broadcasting services, such as Thailand’s Line TV, and Telekom
Indonesia’s online broadcasting service, OONA, finding success in with the AVOD
model.
2.3 Overall broadcasting sector trends
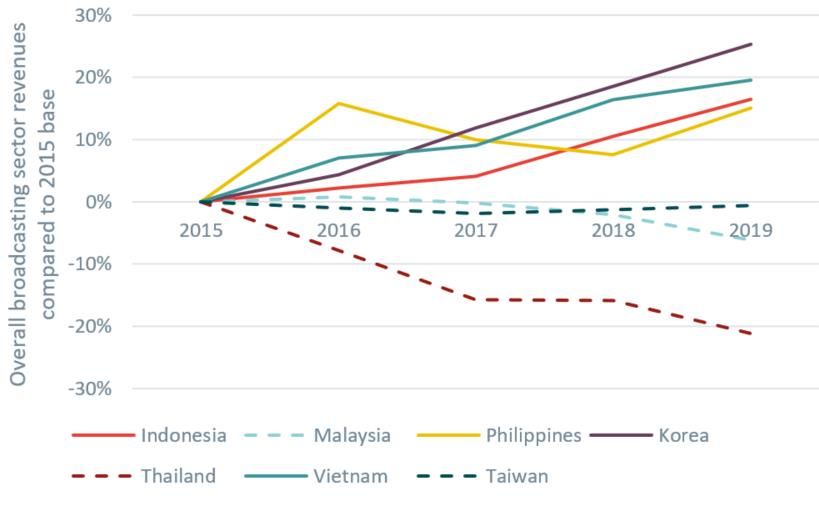
Total sector revenues have grown strongly in most countries
In most of the countries studied the overall sector revenues (subscriptions and
advertising) have grown, suggesting that the sector as a whole is healthy (see
Figure 3). TV sector revenues have grown by between 15% in the Philippines and
25% in South Korea. Revenues in Taiwan have been stable with Thailand, and to
a lesser degree Malaysia, showing a longer-term negative trend.
Figure 3 Evolution of revenues of Pay TV, online video, and Free-to-Air
broadcasting services since 2015 in APAC
Source: Frontier analysis of Media Partners Asia data
6
Why AVOD Solutions Are Becoming Increasingly Attractive. Dror Mangel (Viaccess Orca). August 7, 2019.
7
New study: Netflix continues to dominate the streaming market. Rune Werliin (The Audience Project).
January 17, 2019
frontier economics 13BROADCASTERS ADAPTING TO DIGITAL TRANSFORMATION IN APAC
Note: Overall broadcasting sector revenues calculated as the sum of advertising revenues of Free-to-Air
and Pay TV broadcasters, and subscription revenues of Pay TV and online video service providers.
Data for Sri Lanka and Pakistan do not contain subscription revenues for specialist online video
service providers, and do not contain advertising revenues of Free-to-Air broadcasters and are
therefore omitted. Pay TV defined as the distribution of TV channels for a subscription fee. Online
Video is defined as a video service delivered over an open internet or broadband connection.
Measurement of advertising revenues is stated in net terms (i.e. after discounts and excluding agency
commission). Subscription revenues accrued by channel suppliers and content providers is a direct
reflection of how providers spend on programming, based on fixed and variable fees.
Sector revenues of traditional (FTA and Pay TV broadcasters) show a similar
pattern given that OVSP subscription revenues make a relatively small contribution
to overall sector revenues.,.
There is significant variation in the balance between FTA advertising, Pay TV
advertising, Pay TV subscriptions and OVSP subscriptions (Figure 4). In Indonesia
and the Philippines FTA advertising dominates, whereas in Malaysia and Taiwan
Pay TV subscriptions dominate. In all countries the share of subscription revenues
captured by online video providers is low (below 6%).
Figure 4 Share of overall broadcasting sector revenues in 2019 by
revenue source
Indonesia 70% 2% 27% 2%
Philippines 61% 6% 28% 5%
Thailand 56% 3% 37% 4%
Vietnam 39% 12% 48% 1%
Korea 15% 24% 57% 4%
Malaysia 10% 9% 78% 3%
Taiwan 5% 26% 64% 5%
0% 20% 40% 60% 80% 100%
FTA advertising Pay-TV advertising
Pay-TV subscription Online video subscription
Source: Frontier analysis of Media Partners Asia data
Note: Overall broadcasting sector revenues calculated as the sum of advertising revenues of Free-to-Air
and Pay TV broadcasters, and subscription revenues of Pay TV and online video service providers.
Data for subscription revenues for specialist online video service providers, and advertising revenues
of Free-to-Air broadcasters for Sri Lanka and Pakistan were not available. Pay TV defined as the
distribution of TV channels for a subscription fee. Online Video is defined as a video service delivered
over an open internet or broadband connection. Measurement of advertising revenues is stated in net
terms (i.e. after discounts and excluding agency commission). Subscription revenues accrued by
channel suppliers and content providers is a direct reflection of how providers spend on programming,
based on fixed and variable fees.
Thailand and Malaysia have seen declines in sector revenue in the last
five years
There are several country specific reasons why Thailand and Malaysia have
experienced declines in revenues in the last five years. While the growth in
frontier economics 14BROADCASTERS ADAPTING TO DIGITAL TRANSFORMATION IN APAC
availability of online video service providers may partially be a cause, the decline
in broadcaster revenues in Thailand can also be attributed to other sector-specific
drivers in the country.
Firstly, piracy is a problem in Thailand. In a 2018 survey by the Asia Video Industry
Association (AVIA), 45% respondents claimed to use devices to stream pirated
television and video content.8 Such streaming devices are boxes that connect to
the television and are used to stream Pay TV channels over the internet.9 While
these devices are popular across the region, Thai usage ranks the highest of all
the countries surveyed by the Asia Video Industry Association (AVIA), with others
ranging from 33% (Taiwan) to 15% (Singapore).10,11
Though also diverting viewing traffic away from FTA channels, the popularity of
such boxes poses a unique threat to Pay TV companies. 69% of Thai respondents
who purchased a box said they also cancelled some or all their television
subscriptions, with international subscription services affected the least. The boxes
are especially popular with those aged 18 to 24, who are also more likely to cancel
legitimate subscriptions having acquired one (77%).
Because these boxes require the internet, their usage is a recent phenomenon.
Figure 5 illustrates how such streaming devices grew in popularity during the
period from 2016 and 2017. The chart uses Google search trends for three popular
such streaming devices to illustrate user interest in the devices over time. The Thai
government has declared its intention to crack down on these devices/boxes.12
8
See: https://www.bangkokpost.com/thailand/general/1594410/nearly-half-of-people-stream-pirated-tv
9
According to AVIA the TV boxes, also known as illicit streaming devices (ISDs), allow users to access
hundreds of pirated TV channels and video-on-demand content, usually with a low annual fee. TV boxes
often come pre-loaded with applications allowing "plug-and-play" access to pirated content.
10
See: https://www.devdiscourse.com/article/business/881759-33-of-taiwanese-consumers-access-streaming-
piracy-on-video-services
11
See: https://marketingmagazine.com.my/15-in-singapore-use-illicit-streaming-devices-to-view-pirated-tv-
channels-and-video-on-demand/
12
See: https://www.bangkokpost.com/thailand/general/1735571/ipd-plans-digital-piracy-crackdown
frontier economics 15BROADCASTERS ADAPTING TO DIGITAL TRANSFORMATION IN APAC
Figure 5 Google search trends for three popular illicit streaming devices
in Thailand since 2014
120
Google search trends in Thailand for
popular Illicit streaming services.
2017.07, HD PlayBox = 100
100
80
60
40
20
0
2014 2015 2016 2017 2018 2019
Mango TV HD Playbox U Play
Source: Google Trends
The Thai Government and regulator13 have recently announced new website
blocking provisions for piracy sites which violate Section 20 (3) of the Computer
Crimes Act (CCA).14
Secondly, the rights to the English Premier League (EPL), which is popular in
Thailand, have also changed hands between broadcasters on several occasions
with TrueVisions losing the license to its competitor CTH from 2013 to 2015, before
regaining it initially through a sublicense in 2016, then fully in 201915 after CTH
shut down.16 This may have increased pay TV churn in the sector.
Thirdly, in 2013 Thailand auctioned licenses for Digital TV that many broadcasters
overpaid for. DTT channels dominate TV in Thailand accounting for 87% of TV
viewership. Twenty-four (24) Digital TV operators launched services in 2014,
however the fierce competition subsequently led to 9 of these stations shutting
down by 2019.
With regards to Malaysia, the country experienced a stronger economic downturn
than other Asian economies. Specifically, Malaysia’s GDP per capita fell 12%
between 2012 and 2016, a larger fall than any other country in the region. Declining
GDP can be expected to have a significant impact on FTA revenues, as advertising
revenues are particularly sensitive to the economic cycle.17
According to Media Partners Asia, Media Prima, which broadcasts four FTA
channels in Malaysia as the audience leader with a 21% audience share “is
13
The Department of Intellectual Property (DIP), the Ministry of Digital Economy and Society (DES) and the
National Broadcasting and Telecommunications Commission (NBTC)
14
See: https://avia.org/thailands-department-of-intellectual-property-dip-and-the-ministry-of-digital-economy-
and-society-des-launch-new-website-blocking-provisions-in-efforts-to-clamp-down-on-online-piracy/
15
See: https://www.nationthailand.com/news/30370947
16
See: https://www.commsupdate.com/articles/2016/08/05/thai-cable-group-cth-shutting-down-in-september/
17
Bils, M., 1989. Pricing in a customer market. The Quarterly Journal of Economics, 104(4), pp. 709
frontier economics 16BROADCASTERS ADAPTING TO DIGITAL TRANSFORMATION IN APAC
currently stuck in a negative feedback loop, with lower ad revenues leading to lower
content investment which discourages viewership”.18
Malaysia also faced problems with piracy with a reported 25% of households 2019
reporting using a TV box which can be used to stream pirated television and video
content.19 However, a recent report found that efforts of the Government had in
2020 succeeded in significantly reducing the use of piracy streaming websites or
torrent sites to view pirated content. In 2020, 22% of consumers reported using
such sites, though this was down significantly from 61% in 2019.20
Subscriptions have grown in most countries
Total broadcaster subscriptions (subscriptions to both Pay TV and online video
service providers) also suggest that the Pay TV sector is growing in most APAC
countries.
Figure 6 Evolution of the number of subscriptions to Pay TV and online
video broadcasting services per 1000 households since 2015 in
APAC
2500
subscriptions per 1000 households
Overall broadcasting sector
2000
1500
1000
500
0
2015 2016 2017 2018 2019
Indonesia Malaysia Pakistan
Philippines Korea Sri Lanka
Thailand Vietnam Taiwan
Source: Frontier analysis of Media Partners Asia data
Note: Data for Sri Lanka and Pakistan do not contain OVSP subscription
Overall number of subscriptions calculated as total Pay TV subscriptions plus total OVSP
subscriptions (multiple subscriptions allowed per household). Pay TV defined as the distribution of TV
channels for a subscription fee. Online Video is defined as a video service delivered over an open
internet or broadband connection.
Figure 6 shows how the overall number of subscriptions to Pay TV and OVSPs
has developed across APAC. In almost all countries observed (except for
Malaysia), the average number of households subscribing to a broadcasting
18
See: Asia Pacific Video Content Dynamics. Media Partners Asia. 2020
19
See: https://avia.org/new-survey-finds-that-one-in-four-malaysian-consumers-use-pirated-tv-boxes/
20
See: https://avia.org/huge-decrease-in-levels-of-streaming-piracy-seen-in-malaysia-over-the-last-12-
months/
frontier economics 17BROADCASTERS ADAPTING TO DIGITAL TRANSFORMATION IN APAC
service has been increasing steadily in recent years.21 There is significant variation
in the number of subscriptions per household which relates partly to the level of
wider economic outcomes. In the high-income economies of South Korea and
Taiwan the level of subscriptions per household is 2 and 1 respectively.
Malaysia’s declining subscribers to broadcasting services is likely to be partly
explained by its comparatively weak economic performance in recent years.
2.4 Trends in TV advertising revenues
Many broadcasters rely to some extent on advertising revenues as income. Free-
to-Air (FTA) broadcasters rely (almost) totally on advertising revenues as their
income. Pay TV broadcasters, who also generate revenues from subscription fees,
may rely mostly or only partly on advertising revenues as a form of income.
FTA broadcasters are a mix of public broadcasters and commercial broadcasters
(see ANNEX B), though Vietnam and Thailand are exceptions where all FTA
broadcasters are public.22
The trends in advertising revenues are mixed, with evidence of reductions in some
countries but also growth in others.
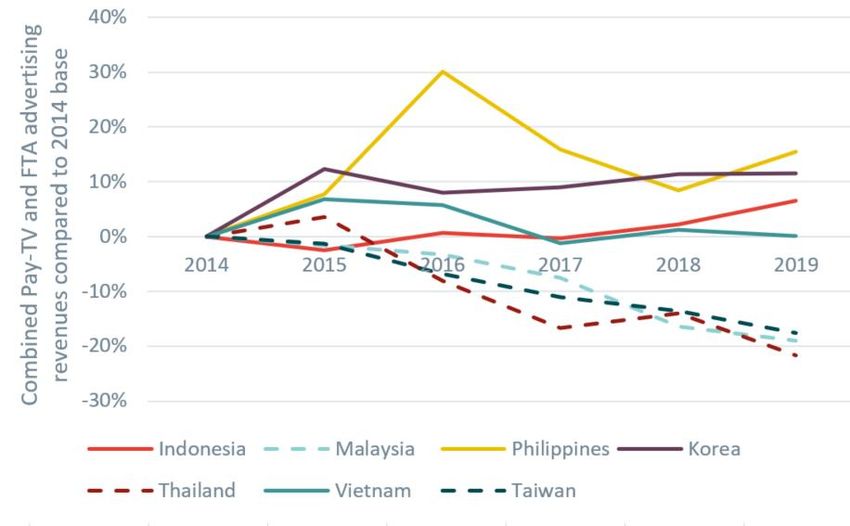
Figure 7 illustrates how the overall level of advertising revenues made by FTA and
Pay TV broadcasters in APAC has evolved in recent years. Some countries, such
as Indonesia, have seen a gradual rise in advertising revenues amongst
broadcasters. But others have witnessed a decline in advertising revenues in the
broadcasting sector. In particular, Thailand and Malaysia have seen several years
of decline.
21
Note that many households may “multi-home” (i.e. simultaneously access more than one subscription).
22
FTA channels are public and military in the case of Thailand
frontier economics 18BROADCASTERS ADAPTING TO DIGITAL TRANSFORMATION IN APAC
Figure 7 Evolution of advertising revenues of Pay TV and Free-to-Air
broadcasters since 2014 in APAC
Source: Frontier analysis of Media Partners Asia data
Note: Data for Sri Lanka and Pakistan do not contain Free-to-Air broadcaster advertising revenues; and are
therefore omitted. Pay TV defined as the distribution of TV channels for a subscription fee.
Measurement of advertising revenues is stated in net terms (i.e. after discounts and excluding agency
commission).
FTA share of TV advertising has been eroded in some countries by Pay TV
providers, but not all (Figure 8). In Malaysia and South Korea, and to a much lesser
degree in Thailand and Vietnam, the share of TV advertising revenues has
declined more for FTA broadcasters in comparison to Pay TV broadcasters.
frontier economics 19BROADCASTERS ADAPTING TO DIGITAL TRANSFORMATION IN APAC
Figure 8 Comparison of share of total broadcasting sector advertising
revenues accounted for by FTA broadcasters in 2014 vs 2019 in
APAC
100%
Share of combined Pay-TV and FTA
90%
80%
advertising revenues
70%
60%
50%
40%
30%
20%
10%
0%
Indonesia Malaysia Philippines Korea Thailand Vietnam Taiwan
FTA share in 2014 FTA share in 2019
Source: Frontier analysis of Media Partners Asia data
Note: Total broadcasting sector advertising revenues calculated as combined Pay TV and FTA broadcaster
advertising revenues. Data for Sri Lanka and Pakistan do not contain Free-to-Air broadcaster
advertising revenues; and are therefore omitted. Pay TV defined as the distribution of TV channels for
a subscription fee. Measurement of advertising revenues is stated in net terms (i.e. after discounts
and excluding agency commission).
2.5 Trends in Pay TV
The APAC region is served by a mix of cable, direct-to-home (DTH) satellite, and
internet protocol TV (IPTV) Pay TV broadcasters (see ANNEX C). While in some
countries like Taiwan, cable Pay TV operators are dominant, in other countries like
Indonesia, other forms of Pay TV transmission are more common.
Pay TV subscriptions
An increasing proportion of households in APAC are subscribing to Pay TV
broadcasters’ packages. This report defines “Pay TV” as distinct from OVSPs.23
Figure 9 shows that in almost all countries observed, the number of Pay TV
subscriptions per 1000 households has increased gradually since 2012.
Figure 9 exhibits some disparity between countries in both the overall number and
rate of increase of Pay TV subscriptions per 1000 households. South Korea and
Taiwan are countries with particularly high rates of subscription to Pay TV
packages. South Korea, in particular, demonstrates an increasing trend of
households subscribing to multiple Pay TV packages.
23
Pay TV providers supply access to bundles of channels broadcasting linear content, whereas online video
providers supply access to a library of content on demand over broadband networks
frontier economics 20BROADCASTERS ADAPTING TO DIGITAL TRANSFORMATION IN APAC
While almost all countries observed exhibit a rising rate of subscription to Pay TV
services, in Malaysia subscription penetration has declined. In Malaysia, the
number of subscriptions to Pay TV broadcasters per 1000 households has fallen
from just over 500 subscriptions per 1000 households in 2012 to less than 400
subscriptions per 1000 households in 2019. For the reasons set out above the
decline in the number of Pay TV subscriptions per household in Malaysia may be
related to the economic conditions over the period or other factors such as piracy
or entry of OVSPs.
Figure 9 Evolution in number of Pay TV subscriptions since 2012 in APAC
2000
Pay-TV subscriptions per 1000
1800
1600
1400
households
1200
1000
800
600
400
200
0
2012 2013 2014 2015 2016 2017 2018 2019
Indonesia Malaysia Pakistan
Philippines Korea Sri Lanka
Thailand Vietnam Taiwan
Source: Frontier Analysis of Media Partners Asia and Telegeography data
Note: Pay TV defined as the distribution of TV channels for a subscription fee. Media Partners Asia data
used for Pay TV subscription figures, Telegeography data used for number of household figures.
Pay TV revenues
As discussed above, Pay TV broadcasters may rely to different extents on both
advertising revenues and subscription revenues as a form of income. Advertising
revenue is increasing in some countries but decreasing in others.
Figure 10 shows how revenues from subscriptions for Pay TV broadcasters have
changed over recent years in APAC. In the majority of countries observed,
subscription revenues of Pay TV broadcasters have risen to varying degrees since
2012. But in Thailand and Malaysia, subscription revenues have also declined in
several years, conforming to the downward trend in overall Pay TV subscriptions
in these two countries.
Where Pay TV subscription revenues have grown (Figure 10), growth has
generally been stronger than in advertising revenues. For example, combined
FTA/Pay TV advertising revenues in the Philippines in 2019 had grown just under
16% compared to 2012 (Figure 7). But Pay TV subscription revenues in the
Philippines in 2019 had doubled compared to 2012.
frontier economics 21BROADCASTERS ADAPTING TO DIGITAL TRANSFORMATION IN APAC
Figure 10 Evolution of Pay TV subscription revenues since 2012 in APAC
300%
Pay-TV subscription revenues
compared to 2012 base 250%
200%
150%
100%
50%
0%
2012 2013 2014 2015 2016 2017 2018 2019
-50%
Indonesia Malaysia Pakistan
Philippines Korea Sri Lanka
Thailand Vietnam Taiwan
Source: Frontier analysis of Media Partners Asia data
Note: Pay TV defined as the distribution of TV channels for a subscription fee. Subscription revenues
accrued by channel suppliers and content providers is a direct reflection of how providers spend on
programming, based on fixed and variable fees
ARPU
Figure 11 shows the evolution of average revenue per user (ARPU) amongst Pay
TV broadcasters in APAC in recent years. ARPU for Pay TV provides vary both in
the level and the trajectory. Pay TV ARPU is highest in Malaysia and Taiwan at
US$24.48 and US$15.51 in 2019, respectively. It is lowest in Pakistan, Vietnam
and Sri Lanka. Pay TV APRU has declined in Indonesia, from a recent peak of
US$8.26 in 2015 to US$7.38 at the end of 2019.
This suggests that there is no clear trend in ARPUs across the APAC region. Some
countries such as Vietnam see growth, whilst others such as Pakistan see some
decline. In some countries (specifically Taiwan, Vietnam, South Korea and
Malaysia) ARPU has increased from its level as of 2012.
Pay TV APRU may be affected by the level of sector maturity. Later subscribers to
Pay TV services are likely to be more price sensitive, hence more likely to
subscribe to more basic Pay TV packages. The entry of OVSPs may have also led
Pay TV providers to offer entry packages which compete more directly with online
subscriptions. These trends may have expanded the market with some consumers
that did not subscribe to Pay TV before, taking up cheaper Pay TV subscriptions.
frontier economics 22BROADCASTERS ADAPTING TO DIGITAL TRANSFORMATION IN APAC
Figure 11 Evolution of average revenue per user (ARPU) of Pay TV
broadcasters since 2012 in APAC
30
25
Monthly ARPU (US$)
20
15
10
5
0
2012 2013 2014 2015 2016 2017 2018 2019
Indonesia Malaysia Pakistan
Philippines Korea Sri Lanka
Thailand Vietnam Taiwan
Source: Frontier analysis of Media Partners Asia data
Note: Pay TV defined as the distribution of TV channels for a subscription fee. Average Revenue Per User
(ARPU) is the monthly subscription revenue per user generated by a platform, based on an average
subscriber number for the month.
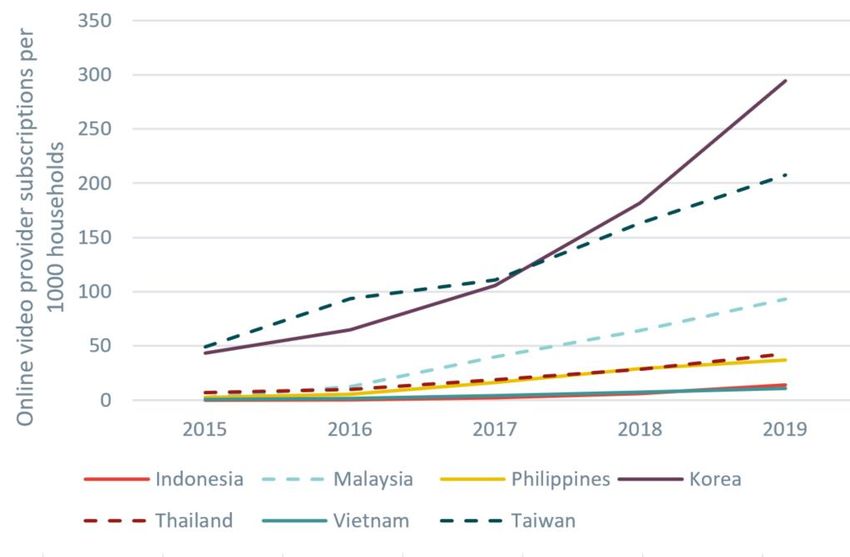
2.6 Online video service providers
Subscriptions to OVSPs have grown rapidly from a small base
OVSPs have been able to enter in APAC countries and quickly build subscriptions,
especially where broadband penetration is high. The sharp rise of OVSP
subscriptions across APAC can be seen in Figure 12, which shows the number of
OVSP subscriptions per 1000 households.
There is a significant degree of variation in the number of online video subscriptions
in the countries covered. The lowest level of subscriptions was in Indonesian and
Vietnam (at around 10 subscriptions per 1000 households), followed by Thailand
and the Philippines (around 50 subscriptions per 1000 households) then Malaysia
(at 95 subscriptions per 1000 households). In the higher income countries of South
Korea and Taiwan have much higher levels of subscriptions at 300 and 200
subscriptions per 1000 households.
Figure 12 shows that in some APAC countries, OVSP subscriptions were relatively
rare in 2015. But in others such as South Korea and Taiwan, more local online
broadcasting services had been launched in 2015. Importantly, both Taiwan and
South Korea were shown to have higher broadband penetration than other
countries in Figure 2.
Although OVSPs appear to be quickly gaining subscribers across the APAC
region, it is difficult to precisely measure the impact this will have on Pay TV
broadcasters. Firstly, OVSPs may compete across different dimensions than Pay
frontier economics 23BROADCASTERS ADAPTING TO DIGITAL TRANSFORMATION IN APAC
TV and FTA broadcasters, for example by focusing on specific kinds of
new/innovative content, or operating no-advertising business models.
Secondly, consumers may multi-home with several OVSPs: this means consumers
may subscribe to/consume content from a combination of FTA, Pay TV and
OVSPs. This consumer behaviour is becoming increasingly common in APAC
countries such as Vietnam, where some Pay TV broadcasters are still aspiring to
penetration levels of 70-80%, despite the entry of online video services.24 There
may also be a high rate of switching between different broadcasting services,
especially among online video services.25
Figure 12 Evolution of number of subscriptions to OVSPs per 1000
households since 2015 in APAC
Source: Frontier analysis of Media Partners Asia data
Note: Online Video is defined as a video service delivered over an open internet or broadband connection.
Media Partners Asia data used for Pay TV subscription figures, Telegeography data used for number
of household figures.
As online video subscriptions have grown so revenues have quickly grown from a
low base.
24
Vietnam in View. Asia Video Industry Association. September 2018.
25
Netflix: the rise of a new online streaming platform universe. Harvard Business School. March 4, 2018.
frontier economics 24BROADCASTERS ADAPTING TO DIGITAL TRANSFORMATION IN APAC
Figure 13 Evolution of OVSP subscription revenues since 2017 in APAC
Source: Frontier analysis of Media Partners Asia data
Note: Given that the level of subscriptions was low in the period 2015 – 2016 we have indexed growth in
subscriptions to 2017 = 1. Online Video is defined as a video service delivered over an open internet
or broadband connection. Subscription revenues accrued by channel suppliers and content providers
is a direct reflection of how providers spend on programming, based on fixed and variable fees.
However, as noted in Figure 4, for OVSPs the share of revenues is small in 2019
(on average less than 6% in the countries assessed in 2019).
ARPU is growing
OVSPs’ ARPUs have in general risen gradually in recent years in most APAC
countries, though from a relatively low level - see Figure 14. We note also that
ARPU grew in Indonesia prior to 2017, but has fallen since.
frontier economics 25BROADCASTERS ADAPTING TO DIGITAL TRANSFORMATION IN APAC
Figure 14 Evolution of average revenue per user (ARPU) of OVSPs since
2015 in APAC
Source: Frontier analysis of Media Partners Asia data
Note: Online Video is defined as a video service delivered over an open internet or broadband connection.
Average Revenue Per User (ARPU) is the monthly subscription revenue per user generated by a
platform, based on an average subscriber number for the month. Direct SVOD ARPUs reflect average
blended direct consumer spend on SVOD services, some of which may include TVOD (transaction
VOD) components.
2.7 Profitability of broadcasters
We have examined trends in profitability of broadcasters in the sector. For each of
the broadcasters with available financial information, we gather data on EBITDA
margins and the Return on Capital Employed (ROCE) over the past ten years (see
ANNEX D for further information on the data availability).
EBITDA margins are a measure of profit (formally Earnings Before Interest, Taxes,
Depreciation and Amortization divided by total revenue). ROCE refers to earnings
before interest and tax (also known as operating income) divided by average
capital employed, where capital employed is total assets less total liabilities.
EBITDA margins reflect overall profitability of a company as share of revenues, but
do not account for capital invested in the business. ROCE is useful for comparing
the profitability of companies by taking into account the amount of capital used but
tends to be more volatile and less comparable across companies and especially
countries, reflecting potentially different accounting standards/application.
frontier economics 26BROADCASTERS ADAPTING TO DIGITAL TRANSFORMATION IN APAC
2.7.1 Benchmarking the profitability of APAC TV broadcasters
with other TV broadcasters
Profit margins of TV broadcasters within APAC are in line with, and often higher
than, profit margins of TV broadcasters in developed and middle-income countries
in North America, Latin America and Europe.
Figure 15 Average 2017-2019 EBITDA margins of TV broadcasters in APAC
countries of interest compared to those in other APAC
countries, North American, Latin American and Europe
Source: Bloomberg and Frontier Economics calculations
Note: APAC countries of interest are highlighted in red and the dotted line shows the average across all
countries in this sample. Sample of countries includes developed and middle-income countries in
APAC, North America, Latin America, and Europe with available data. Note the sample includes only
broadcasters where there is publicly available data. In the case of Pakistan this relates to one
broadcaster (HUM Network) in the case of Taiwan this relates to two broadcasters (Taiwan Television
Enterprise and China Television Co). In the case of Thailand this relates to two broadcasters
(Bangkok Entertainment Co.ltd, TrueVisions)
Figure 15 show that the country weighted average EBITDA margins in all countries,
with the exception of Taiwan and Pakistan, are the in the range 20% - 40% (though
individual broadcaster EBITDA margins vary as seen in ANNEX E). As shown in
frontier economics 27BROADCASTERS ADAPTING TO DIGITAL TRANSFORMATION IN APAC
Figure 16, Indonesia, Malaysia, South Korea and Thailand have all seen small
reductions since 2015. HUM Network in Pakistan saw a fall in 2018 (described in
Section 2.9 and Annex F.4) which it related to increased costs due to the
investment to launch a new channel and macro-economic issues affecting the
advertising sector. Finally, the two broadcasters in Taiwan (Taiwan Television
Enterprise and China Television Co) have shown on average negative profitability.
In Thailand, profit margins have been decreasing since 2012, in line with a
decrease in FTA ad revenues and declining ARPU (as noted in Figure 11 Pay TV
APRU was ranked third highest of the countries studied in 2012 and has since
declined).
Figure 16 EBITDA margins of TV broadcasters in the APAC countries of
interest
60.0
EBITDA Margin (%)
50.0
40.0
30.0
20.0
10.0
0.0
-10.0
-20.0
2012 2013 2014 2015 2016 2017 2018 2019
Philippines Malaysia Thailand South Korea
Indonesia Taiwan Pakistan
Source: Bloomberg and Frontier Calculations
Note: Profit margins are revenue weighted averages of EBITDA margins of TV broadcasters in each country
of interest. The profitability trends by region only reflect the profitability of broadcasters where data is
publicly available (see ANNEX D for further information). Where the companies included are TV
broadcasters, they may have other activities that are captured in these high-level profitability metrics
(such as radio broadcasting or print publishing). Note the sample includes only broadcasters where
there is publicly available data. In the case of Pakistan this relates to one broadcaster (HUM Network)
in the case of Taiwan this relates to two broadcasters (Taiwan Television Enterprise and China
Television Co). In the case of Thailand this relates to two broadcasters (Bangkok Entertainment
Co.ltd, TrueVisions)
What have been the causes for changes in profitability?
Many factors affect the profitability of TV broadcasters, which can fluctuate
substantially depending on both sector-specific and wider economic trends. We
explore several factors weighing on revenue growth over the past three years as
well as several cost pressures, which help explain the recent decline in TV
broadcasting profits at a country level.
In the financial statements of broadcasters in APAC countries, higher content costs
and lower levels of aggregate economic activity are cited as factors weighing on
profit margins. For example, some broadcasters, including Elang Makhota in
Indonesia and BEC World in Thailand, attribute the recent decline in profits to lower
economic activity which has constrained advertising budgets.26
26
See: Elang Makhota Teknologi 2018 Annual Report and BEC World 2019 Annual Report.
frontier economics 28BROADCASTERS ADAPTING TO DIGITAL TRANSFORMATION IN APAC
In addition to these pressure on revenues, TV broadcasters in the region may have
also faced increased cost pressures. Some broadcasters, including Intermedia
Capital TBK in Indonesia, attribute their decline in 2018 profitability to higher costs
related to developing local content.27
These trends are explored in more detail in Section 2.9 in the case of three
broadcasters.
2.8 Benchmarking the profitability of APAC
broadcasters with other sectors
Comparing profit margins across industries is complex, as different industries will
have different capital intensity, demand or cost risks, or investment cycles. More
generally it can be difficult to measure economic profit. Nonetheless, an
assessment of profit margins can in some cases provide helpful evidence on
whether there are concerns.
As shown in Figure 17, profit margins of TV broadcasters within APAC countries
are generally higher than in other aggregate sectors.
27
See Intermedia Capital TBK 2018 Annual Report, page 24.
frontier economics 29BROADCASTERS ADAPTING TO DIGITAL TRANSFORMATION IN APAC
Figure 17 Average 2017-2019 EBITDA margins for TV broadcasters
compared to other sectors
Source: Bloomberg and Frontier Economics Calculations
Note: TV Broadcasting sector is highlighted in red. This chart shows the EBITDA margin as weighted
average across firms in a particular industry. The TV Broadcasting segment is based on manual
classification verified with desk research and all other industries are based on the Global Industry
Classification Standard (GICS), subgroups Cable & Satellite and Broadcasting. Note the sample
includes only broadcasters where there is publicly available data. In the case of Pakistan this relates
to one broadcaster (HUM Network) in the case of Taiwan this relates to two broadcasters (Taiwan
frontier economics 30BROADCASTERS ADAPTING TO DIGITAL TRANSFORMATION IN APAC
Television Enterprise and China Television Co). In the case of Thailand this relates to two
broadcasters (Bangkok Entertainment Co.ltd, TrueVisions)
2.9 Analysis of broadcaster profitability
To understand the factors that have affected broadcasters during the period of
adapting to the adoption of digital technologies this section conducts a more
detailed case study of three broadcasters from the region. The analysis reviews
what the broadcasters consider to be the key factors that affect profitability, costs,
revenues and opportunities in the period 2015 - 2020.
We have chosen broadcasters from the different countries in the region; with
different experiences and characteristics. The case studies are summarised below
and set out in full in ANNEX F.
It considers:
how the entry of new OVSPs has affected their businesses
how the broadcasters have positively responded to the opportunities of digital
disruption
what other factors have affected their business strategy.
The three APAC broadcasters have fared differently in the last five years.
MNC (Indonesia)
Media Nusantara Citra (MNC) is an Indonesian commercial advertising funded
broadcasting group. It has four Free-To-Air channels – RCTI, MNCTV, GTV, and
iNews – as well as 18 channels broadcast on Pay TV. RCTI is the most watched
and widely broadcasted FTA station in Indonesia.28 MNC has seen steady growth
in EBITDA margins since 2015. In 2019, the Company’s EBITDA margin reached
a record high of 44%.29
GMA (Philippines)
GMA Network is a free-to-air broadcaster in the Philippines. Its core channel
GMA-7 accounted for three quarters of revenue in 2018. GMA also offers
international cable channels including GMA Pinoy TV, GMA Life TV and GMA
News TV International. GMA Network’s EBITDA margin has fluctuated over the
past five years between 25% and 35%.30
HUM Network (Pakistan)
HUM Network is a global entertainment and news network, based in Pakistan, but
with a strong following across South Asia. HUM Network owns HUM TV (offering
a mix of content), HUM Sitaray (entertainment shows), HUM Masala (food channel)
and HUM NEWS. The HUM network’s profit margins have been fluctuating
28
MNC Annual Report 2019, p. 128
29
MNC Annual Report 2019, p. 48
30
See Annex F for annual data
frontier economics 31You can also read