UK MOBILE MARKET DYNAMICS - A report for DCMS - Gov.uk
←
→
Page content transcription
If your browser does not render page correctly, please read the page content below
UK MOBILE MARKET DYNAMICS
A report for DCMS
July 2018
Frontier Economics Ltd is a member of the Frontier Economics network, which consists of two separate companies based in Europe (Frontier
Economics Ltd) and Australia (Frontier Economics Pty Ltd). Both companies are independently owned, and legal commitments entered into by
one company do not impose any obligations on the other company in the network. All views expressed in this document are the views of
Frontier Economics Ltd.
UK Mobile Market Dynamics

            CONTENTS
            1    Executive Summary                                                          5
                 1.1   Context                                                              5
                 1.2   The market models                                                    6
                 1.3   Assessment                                                           7

            2    Introduction                                                               8
                 2.1   Purpose of the report                                                8
                 2.2   Parallel report on fixed sector                                      9
                 2.3   Remainder of the report                                             10

            3    Key features of UK mobile market                                          11
                 3.1   The UK mobile market differs from the fixed market                  11
                 3.2   Network competition has been favoured                               11
                 3.3   Investment incentives                                               12
                 3.4   Market outcomes                                                     17

            4    5G developments                                                           23
                 4.1   Past technology developments                                        23
                 4.2   5G developments                                                     25

            5    Expected level of investment into 5G under the status quo                 30
                 5.1   Expected drivers of initial roll-out of 5G                          30
                 5.2   MBB Congestion relief                                               31
                 5.3   New use cases                                                       33
                 5.4   5G Deployment on existing sites                                     36
                 5.5   Small cells deployment                                              38
                 5.6   Viability of required investment                                    40
                 5.7   The current market model may not deliver in some areas/use cases    43
                 5.8   Conclusion                                                          47

            6    Single wholesale network                                                  49
                 6.1   Rationale for SWN                                                   49
                 6.2   Potential models for introduction of SWNs                           50
                 6.3   Evidence on SWNs                                                    53
                 6.4   Conclusion                                                          54

            7    Market expansion model                                                    55
                 7.1   Introduction to the market expansion model                          55
                 7.2   Neutral host models                                                 56
                 7.3   Reducing barriers to the development of innovative 5G use cases     57
                 7.4   Conclusion                                                          59

            8    Market consolidation                                                      60
                 8.1   Link between number of players and consumer outcomes                60
                 8.2   Evidence on consolidation                                           61
                 8.3   Conclusion                                                          62

            9    Evaluation of the market models                                           63

frontier economics
UK Mobile Market Dynamics
9.1 Assessing the market models 63
9.2 Summary for each market model 63
9.3 Evaluation against each assessment criterion 65
ANNEX A Glossary 69
ANNEX B Further information on SWNs 72
ANNEX C Further information Market Expansion 78
ANNEX D Further information mobile consolidation 82
ANNEX E Input data for 5G deployment analysis 87
frontier economicsUK Mobile Market Dynamics
1 EXECUTIVE SUMMARY
1.1 Context
Cellular mobile services were first launched in the UK in 1985. Since then, a
combination of competition between the four network operators and technical
advances over four generations of technology have delivered large benefits to
users and to the wider economy. Users now take for granted the ability to make
calls and benefit from an increasing number of applications delivered over
smartphones when on the move.
5G, the fifth generation of mobile services, aims to extend the applications
delivered by mobile networks, with an increased emphasis on machine to
machine communication and applications, such as augmented reality, that cannot
be supported by existing networks. A number of necessary conditions for the
launch of 5G services, including initial technology standards and award of
spectrum, will likely be in place by the end of the year. To support further
investment by operators, there have also been a number of recent policy
changes to reduce the cost of rolling out networks.
The UK government has an ambition to be a world leader in the deployment and
use of 5G, due to the economic and social benefits that widespread uptake of
5G-based applications are likely to bring.
Operators have strong incentives to continue investing in new technologies in
order to deliver current services. This will allow them to compete to acquire and
retain customers. However, the business case for novel applications based on
5G technology is uncertain. While the mobile operators plan roll-out of 5G
networks to support existing business cases, such as mobile broadband, delivery
of the full capabilities of the technology could require a significant increase in
investment over and above the level that the mobile network operators currently
incur. With uncertainty over the rate at which new applications will be taken up,
operators may delay investment until there is more clarity of the demand for
these services.
The current market structure consists of four mobile network operators, reliant on
two infrastructure sharing joint ventures (JVs) and with further mobile virtual
network operators (MVNOs) competing for end users. New technologies for voice
and mobile broadband have been introduced and there has been significant
growth in mobile broadband speeds and data consumption. However, in light of
the potentially significant investment required to roll-out 5G, and the different use
cases that this may support, DCMS has commissioned Frontier to consider the
likely outcomes under the current market structure, and to consider alternative
market models that may be required to deliver the full capabilities of 5G.
In this report we consider three market models and consider their potential to
deliver improved outcomes relative to the existing market structure (the ‘status
quo’):
frontier economics 5UK Mobile Market Dynamics
Single Wholesale Network – as full roll-out of 5G may involve significant
investment in network equipment, one policy option is to move to a market
with only one network which operates at the wholesale level allowing multiple
retail players access to the network in order to deliver services to consumers.
Market expansion – a continuation of the existing competitive market with
entry into the market by a wider range of players, alongside the existing
MNOs, at a network or infrastructure level. This model could involve neutral
hosts for provision in some areas – effectively localised versions of single
wholesale networks; and flexible spectrum policy.
Market consolidation – a move to a market with a smaller number of MNOs
through consolidation of existing MNOs i.e. through mergers of MNOs.
We note that in this report we do not discuss in detail the specific policies that
could be put in place to achieve these models, nor the implementation, as this is
beyond the scope of our engagement.
1.2 The market models
Single wholesale networks
While network competition has benefits in terms of providing strong incentives to
reduce costs and to innovate in order to profitably compete for customers, it also
imposes additional costs as fixed network costs are replicated. To some extent
this can be mitigated by operators choosing to share network infrastructure
commercially, although such network sharing agreements cannot completely
remove duplicate costs. A number of jurisdictions have considered, or are in the
process of implementing, so-called single wholesale networks (SWNs) which, in
the long run, aim to reduce or remove the need to duplicate equipment and
infrastructure. However, there is little evidence yet to suggest that implementing
an SWN in the UK would deliver overall net benefits, taking into account the loss
of competition as an incentive to innovate. In addition setting up an SWN would
take a considerable amount of time, leading to potential delays in the roll-out of
new technologies.
Market expansion model
The structure of vertically integrated competing networks has, in general, proven
to be effective. However, this structure may not be optimal for all use cases and
geographies. In some circumstances the provision of duplicate infrastructure may
increase costs substantially or may not be physically possible because of space
limitations. In such cases a ‘neutral host’ model could allow the four operators to
deliver services over a single infrastructure in areas where the competitive model
would not reach. There may also be circumstances where players other than the
existing MNOs may be in better positions to invest in infrastructure to support 5G
and/or develop applications based on 5G technology. Where non-MNO users
may want to deliver innovative 5G use cases over a smaller area, for example on
an industrial site, they cannot currently do so without cooperation from an MNO
who holds a share of the available spectrum. Due to information asymmetries
about the expected demand for use cases and/or different business models,
frontier economics 6UK Mobile Market Dynamics
MNOs may have less incentive to make some investments than potential 5G
users. Neutral host models could lead to greater competition at the service level
and attract new forms of capital to the market.
Consolidation
In the last decade there has been a global tendency for consolidation in mobile
markets, with the number of network operators being reduced from 5 to 4 in the
UK following the merger of Orange and T-Mobile to form EE (later acquired by
BT). It was argued by the parties involved that this merger allowed faster roll-out
of 4G technology. Rolling out 5G is expected to involve a different scale and type
of investment to 4G, hence we consider whether further consolidation would lead
to increased investment and faster roll-out of 5G. We conclude that any potential
future cases will need to be assessed on its merits as a particular case.
1.3 Assessment
We have evaluated each market model against the status quo, according to six
assessment criteria agreed with DCMS. Our assessment based on the analysis
in the report is shown in the figure below.
Figure 1 Evaluation of market models
Single
Market Consolidation
Status quo wholesale
expansion permitted
network (SWN)
Pace of rollout
Total cost (capex)
Market
models are
Coverage (rural)
evaluated
relative to
Coverage (indoor) the Status
quo
Innovation/service
differentiation
Feasibility
*
Positive = expected to Neutral = outcomes Negative = expected to
lead to improved expected to be largely lead to worse outcomes
outcomes relative to the the same as under relative to the Status quo
Status quo Status quo
Source: Frontier
Note: We have placed a * in the feasibility category for the market expansion model as the feasibility would
depend on the precise policies which would be implemented under this model.
frontier economics 7UK Mobile Market Dynamics
2 INTRODUCTION
2.1 Purpose of the report
Analysis of the mobile sector in the UK suggests that the market has performed
well in the delivery of mobile voice and data services to end users to date.1 The
market operates with four Mobile Network Operators (MNOs) delivering mobile
services using a range of technologies across most of the country (but with some
coverage gaps). These competing networks result in differentiation in services
and coverage, whilst retail competition is enhanced by commercially negotiated
Mobile Virtual Network Operator (MVNO) access. There is a degree of network
sharing (two network sharing agreements) which reduces costs without
significantly reducing competition at the retail level.
The Government is considering whether “additional policy interventions” could be
used to facilitate the deployment of 5G networks as part of its Future Telecoms
Infrastructure Review (FTIR):
“The cross-government Review, led by DCMS, will assess whether any additional
policy interventions are needed to create the conditions for long term investment
in world-class digital connectivity that is seamless, reliable, long-lasting and
widely available”.2
To assist the Government’s work in this area, DCMS has asked Frontier to
assess how investment into 5G infrastructure is likely to evolve under:
1. The ‘status quo’ scenario in which the current market model and regulatory
framework remains broadly unchanged; and
2. a range of alternative market models, which could be underpinned by a range
of policy interventions, compared to the status quo.
Our assessment of the merits of these alternative models for the deployment of
5G networks has been undertaken based on six assessment criteria agreed with
DCMS set out in the figure below.
Figure 2 Assessment criteria for market models
Pace of roll-out Total cost (capex) Coverage (rural)
Assessment
criteria Innovation/service
Coverage (indoor) Feasibility
differentiation
Source: Frontier
1
The UK has high levels of population coverage including high coverage with the latest generation of
technology 4G. Geographic coverage is not as extensive as population coverage with gaps affecting some
rural areas. User satisfaction is generally high. This can be seen from Ofcom’s analysis in the ICMR 2017
version available here: https://www.ofcom.org.uk/__data/assets/pdf_file/0026/108908/icmr-2017-telecoms-
networks.pdf
2
FTIR, Call for Evidence, https://www.gov.uk/government/consultations/future-telecoms-infrastructure-
review-call-for-evidence
frontier economics 8UK Mobile Market Dynamics
This report summarises our findings based on:
Theoretical and empirical literature: we have reviewed existing theoretical and
empirical evidence relating to the potential market models.
International experience: we have considered evidence relating to experience
from other countries, in particular we have drawn on international examples of
market consolidation and Single Wholesale Networks.
Responses to DCMS call for evidence for the FTIR: we have reviewed
responses to a 6-week call for evidence that DCMS launched in December
2017, to understand what market or policy interventions might support long
term investment in the next generation of telecoms infrastructure.
Frontier modelling: we have conducted our own modelling work, using data
from a range of sources including 5G Norma, LS Telcom and mobile operator
data to estimate the likely costs of roll-out of 5G networks, undertaking a
range of sensitivities.
2.2 Parallel report on fixed sector
As part of its Future Telecoms Infrastructure Review, the Government is also
considering “additional policy interventions” that could be used to facilitate the
deployment of Fibre to the Premise (FTTP).
To assist the Government’s work in this area, DCMS has also asked Frontier to
assess how investment in FTTP infrastructure will evolve over the next 25 years.
As such a parallel report has been prepared by Frontier3, which focuses on
FTTP.
While there continue to be significant differences between fixed and mobile
telecoms markets on both the supply and demand side, there is increasing
convergence between the markets.
On the demand side mobile voice has increasingly substituted for fixed voice and
for some users, mobile broadband provides an effective substitute for fixed
broadband. However, the reliance of mobile networks on spectrum as a scarce
resource means that unit costs are still higher for mobile services than fixed
services and the bandwidth available per user is lower, leading mobile users to
often choose to offload traffic to fixed networks via WiFi.4 While improved
technology and increased spectrum will continue to reduce the unit cost and
increase the bandwidth of mobile networks the capability of fixed networks will
also increase.
On the supply side there is increasing commonality in the infrastructure and
technologies used for fixed and mobile networks outside the last mile. Mobile
network base stations are increasingly connected (backhauled) to the core
network over fibre infrastructure while fixed operators are increasing fibre in the
access network to serve fixed subscribers. Economies of scope and scale means
that it will be efficient for fibre rolled out for fixed networks to also be used to
serve mobile base stations in the coverage area.
3
See Frontier Economics report on UK Telecoms Market Dynamics for the fixed sector
4
See page 131-134 of Ofcom’s Communications Market report 2017
https://www.ofcom.org.uk/data/assets/pdf_file/0017/105074/cmr-2017-uk.pdf
frontier economics 9UK Mobile Market Dynamics
As such, whilst each report stands independently, we do at points refer to areas
of convergence where relevant and to differences between the mobile market
and the fixed telecoms market throughout the report.
2.3 Remainder of the report
In the remainder of the report we:
Set out the key features of the current UK mobile market;
Review 5G developments so far;
Assess the expected level of investment into 5G under the baseline scenario;
Present evidence on the potential impact of three alternative models on
outcomes:
□ a single wholesale network;
□ market expansion; and
□ market consolidation.
Assess the performance of the different models, based on DCMS’s main
criteria set out above.
frontier economics 10UK Mobile Market Dynamics
3 KEY FEATURES OF UK MOBILE MARKET
In this section we set out the key features of the UK mobile market at present,
considering the factors that have influenced the status quo to date, including the
competitive dynamics and investment incentives. We then present the market
outcomes across a range of indicators.
3.1 The UK mobile market differs from the fixed
market
The mobile telecoms sector has been characterised by a rapid rate of innovation
and relatively high level of network based competition, with four mobile network
operators and a significant number of MVNOs providing services across the UK.
This has translated into significant gains to consumers with almost universal
uptake of mobile services (from a subscriber base of less the 2 million in 1990 5)
and continuous increases in the range and quality of service (across a number of
dimensions), without significant increases in average customer spend in recent
years.6
There are a number of features of the UK mobile market that differ from the
corresponding features of the fixed market:
Network competition has been a factor in the UK mobile market since the very
first cellular networks were introduced in the 1980s, with further entry in the
1990s and in 2000 meaning that the need to intervene to address market
failures has been limited;
The rate of innovation has been high, with new ‘generations’ of technology
being introduced every decade bringing both new use cases (such as data
services introduced by the third generation) and improvements in efficiency,
leading to ongoing reductions in unit costs which have been passed through
to consumers; and
Key inputs such as handsets, spectrum and equipment are now standardised
at a global level, limiting the scope for individual countries to introduce
technology in advance of other countries or differentiate in terms of the
technology used.
3.2 Network competition has been favoured
The first licences for cellular networks were issued to Vodafone and Cellnet (the
predecessor to O2) in 1983, at the same time that the statutory monopoly in fixed
networks enjoyed by BT7 began to be removed through a process of liberalisation
which carried on until the mid-1990s. A further three 2G network licences were
issued in 1989 (although only two networks were launched following a merger of
5
International Telecommunication Union, World Telecommunication/ICT Development Report and database
6
See Ofcom Communications Market Report 2017 e.g. Figure 4.18, 4.25, 4.26
https://www.ofcom.org.uk/data/assets/pdf_file/0017/105074/cmr-2017-uk.pdf
7
Kingston had the statutory monopoly in the Kingston-upon-Hull area
frontier economics 11UK Mobile Market Dynamics
two of the licensees) with a further 3G entrant licensed in 2000. Following the
merger between T-Mobile and Orange in 20108 there are now four network
operators providing services throughout the UK. A further proposed merger
between Three and O2 was blocked by the European Commission (EC) in 2016
on competition grounds.9
Network competition has proven sustainable and efficient in mobile services for a
number of reasons:
In a competitive market, operators have strong incentives to mitigate any
increase in costs due to network duplication, for example through sharing of
infrastructure where this does not impinge on operators’ ability to compete10,
reducing the potentially increased fixed costs due to competition; and
The dynamic nature of the market with rapid technological improvements,
means the potential dynamic efficiency losses through lack of competition are
large compared to the relatively small static efficiency losses due to
duplication of fixed costs.11
The competitive nature of mobile networks means that they have not been
subject to regulation to the same extent as fixed networks. For example, MNOs
are not subject to regulated access obligations. MNOs provide access to their
networks to MVNOs on commercial terms, increasing the degree of competition
in retail mobile markets and providing an additional revenue stream for MNOs to
recover fixed costs.
In addition in recent years there has been growth in connections for machine to
machine (M2M) communications which are not provided through the retail
channels used for traditional mobile phone services.12
3.3 Investment incentives
The relationship between investment and demand in mobile networks is complex.
This contrasts to investments in fixed access networks where capital and
operating costs are broadly proportional to the addressable market, in terms of
the number of premises (homes in residential access networks) passed. For
mobile networks a greater proportion of costs are variable capacity-related costs,
making managing capacity a more significant issue for mobile networks
compared to fixed networks. This is demonstrated in the type of offers available
for fixed and mobile broadband access – whilst fixed broadband offers typically
8
EC Case No COMP/M.5650 - T-MOBILE/ ORANGE
9
EC Case No. M.7612 - HUTCHISON 3G UK /TELEFONICA UK
10
We return to discussion of network sharing in the following sections.
11
This is discussed in Section 5 of the Frontier Economics report for the GSMA (2014)
https://www.gsma.com/publicpolicy/wp-
content/uploads/2014/09/Assessing_the_case_for_Single_Wholesale_Networks_in_mobile_communication
s.pdf
12
7.6 million M2M subscribers by 2016 based on Ofcom 2017 Communications Market Report
https://www.ofcom.org.uk/__data/assets/pdf_file/0017/105074/cmr-2017-uk.pdf
frontier economics 12UK Mobile Market Dynamics
have unlimited data allowances, mobile broadband offers still typically include
data limits.13
This complexity in capacity management in mobile networks is both on (a) the
demand side, where demand for traffic varies both in terms of the time of day but
also location, and (b) on the supply side, with network planners having a wide
range of options including use of more spectrum or densification to improve
network performance in order to better attract and retain customers. As a result
the user experience delivered by a given network to a potential customer varies
significantly depending on the time and location in which they try to access
services.
Financing of infrastructure projects
Generally investment in the mobile sector is financed by the MNOs. 14 All four
MNOs are subsidiaries or divisions of much larger groups and are dependent on
these groups for funding. Capex budgets will be set through a process of
negotiation between the MNOs management and the Group finance function.
Investment requirements may combine strategic investments, for example multi-
year programmes to roll-out new technologies or upgrade infrastructure, with
tactical investments for example to address localised network congestion or to
react to marketing initiatives from other MNOs.
Investment into new technologies tends to happen on a gradual roll-out basis,
with investment cycles approximately every decade in line with each generation
of mobile technology. Such investment has been largely brownfield after the
original roll-out of 2G networks15, as it mainly involves upgrades or the addition of
new equipment to existing mobile masts which have already been built. The
MNOs also have an established customer base and are already generating a
steady stream of positive cash flows.
All four MNOs now generate positive operating cash flow and so can fund
investment without, in general, needing recourse to external funding. They also
can be expected to have incentives to invest in order to defend their competitive
position. In the fixed sector, with the exception of BT and Virgin Media (in its
existing footprint), investors need to raise capital to invest in new fibre build in the
expectation that they will get a return on this investment by acquiring
customers.16
The MNOs have also engaged in network sharing for roll-out in specific areas or
technologies in order to reduce the capital and operating costs required. Network
sharing is possible in areas where MNOs view the cost savings as greater than
any competitive advantage they would achieve through differentiation or first
mover advantage if they rolled out on their own network in a particular area.
13
“Tariff data collected by PurePricing in May 2017 show that just over half (55%) of pay-monthly plans offer a
data allowance of 5GB or less, while most fixed broadband plans (94%) offered ‘unlimited’ data.” Ofcom
2017 CMR https://www.ofcom.org.uk/__data/assets/pdf_file/0017/105074/cmr-2017-uk.pdf
14
See Figure 18 in Section 5.
15
Or a 3G network in the case of Three.
16
Planned FTTP investment in the UK involves also investors entering into ‘co-investment’ agreements with
existing retail fixed broadband providers – see Frontier Economics report UK Telecoms Market Dynamics
for the fixed sector.
frontier economics 13UK Mobile Market Dynamics
Nature of demand
The majority of UK mobile customers purchase mobile services on a post-pay
contract basis17, with the monthly payment including a contribution to the cost of
a handset and a bundle of calls, messaging and data. A typical contract length is
24 months. At the end of the contractual period customers have a choice of
continuing on their current contract, choosing a new contract from their current
provider or choosing a new contract (the very high penetration of mobile services
indicates that most customers choose to remain subscribers and most
purchasing decisions are made by existing subscribers rather than new
subscribers).
When making purchasing decisions, consumers take account of a number of
factors including: the handsets available (when they wish to purchase a new
handset), the overall price and network quality.
Given that price is a significant factor in customers’ purchasing decisions,
operators have a strong incentive to compete on price. However, in addition there
is scope to differentiate from other operators by improving the network. There are
three dimensions of the network that may impact on the user experience:
Performance - The ability of the network to support a given application (for
example the user bandwidth that the network could support) and use cases
(in the absence of congestion);
Coverage - The set of locations where the network is able to support a given
application/use case. The level of performance on networks is a function of
distance (from the base station site) meaning that the closer the user is to the
base station, the higher the mobile broadband speed they are likely to
receive, all else equal;
Capacity - Networks have finite capacity and if the ‘offered’ demand from
users is too high in a given area, then some traffic will not be carried. In voice
networks this generally resulted in calls being ‘blocked’, however on a packet
switched network, this may result in a traffic being delayed and ultimately a
proportion of traffic being discarded, with customers receiving a lower data
rate than requested.
17
67.5% in 2016 – Ofcom 2017 CMR https://www.ofcom.org.uk/__data/assets/pdf_file/0017/105074/cmr-
2017-uk.pdf
frontier economics 14UK Mobile Market Dynamics
Figure 3 Factors used to differentiate network quality
Source: Frontier
However, it is difficult for users to assess mobile network quality and differences
between networks in an objective fashion. While marketing communications and
information published by third parties or regulators such as Ofcom18 may
influence some users, the experience of individual users of coverage and
performance of their networks, and ‘word of mouth’ from users of other networks,
may also have a significant influence. This will provide an incentive for operators
to improve and maintain the quality of their networks as there is less likelihood
that a customer will seek to change their provider if they are happy with the
network’s quality (or at least perceive it to be equivalent to other networks).
As such, consumers may take into account both the absolute performance of
their network, for example the degree of congestion or lack of coverage and the
relative performance of their network, i.e. whether the network is significantly
worse than competing networks. For example, new entrants had a strong
incentive to roll-out coverage networks to the point where they were broadly
comparable with established operators as customers prefer operators with higher
coverage networks.19
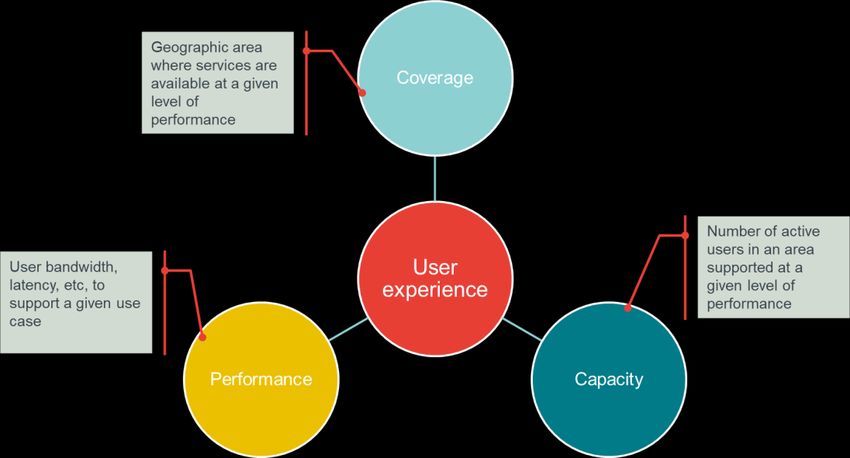
Supply side issues
Competing network operators will seek to offer the optimal balance between the
user experience they offer and the cost of the network. In order to improve the
network performance, or maintain it given increases in traffic over time, network
planners have a number of investment levers they can use:
Additional base stations can offer improvements in coverage (when deployed
in areas where coverage is not complete) and/or increased capacity.
18
See for example Ofcom’s mobile and broadband checker https://www.ofcom.org.uk/about-
ofcom/latest/features-and-news/broadband-checker
19
Some customers may exclude operators with limited coverage from their purchasing choices and others
require discounts to reflect this difference in quality.
frontier economics 15UK Mobile Market Dynamics
Additional base stations can also increasingly improve performance which is a
function of the distance from the nearest base station;
Additional spectrum deployment, with lower frequency spectrum offering
greater coverage and higher frequency incremental spectrum offering
increased capacity and performance (for example through carrier
aggregation); and
Technology improvements due to equipment upgrades can bring increases in
performance and capacity (in large part through increased spectral efficiency)
over time, and in some cases coverage. Successive ‘generations’ of mobile
technology have focussed on increasing performance and capacity of mobile
networks both in terms of the ‘core’ and ‘radio access’ networks:
□ 1G networks provided a basic voice service with low capacity and low
security;
□ 2G networks significantly increased voice capacity of mobile networks
while introducing additional applications – packet data and SMS;
□ 3G networks offered significantly more capacity for packet data services
with increased performance in terms of user bandwidth;
□ 4G networks offered increased capacity and performance for packet data
services with an IP based core.
Figure 4 Levers for improving network performance
Source: Frontier
Network planners will use a combination of these levers, both reactively, for
example to address congestion in a given area, and proactively. For example,
operators may decide on the overall structure of the network infrastructure and
spectrum/technology mix in order to be consistent with the long-term commercial
strategy of the operator.
The structure of pricing, with most customers now being on a relatively fixed
subscription (at least for the period of contract length – typically 24months) and
with prices being geographically averaged, means that it may be difficult for
operators to directly extract incremental revenues from network upgrades such
frontier economics 16UK Mobile Market Dynamics
as increases in coverage. However, within investment decisions, implicit or
explicitly there will be a trade-off between investment (and the related cost) and
the operator’s ability to attract and retain customers, taking into account the
performance of other networks.
Restrictions on network supply
There are some operational and technical restrictions on the effectiveness of the
levers that operators can use to increase supply:
Licensed spectrum holdings are fixed between licence awards which limit the
spectrum available to each operator that can be deployed on any one base
station;
Densification of networks to deliver increased capacity has technical
limitations (on the minimum inter-site distance) and operational limits on the
availability of sites in high traffic areas;
Increasing coverage may lead to increasing unit costs per base station due to
increased remoteness of sites; and
Technology requires standardisation before products are created (both in
terms of network equipment and terminal equipment).
These issues may imply it becomes increasingly expensive to carry on increasing
capacity in the highest traffic density areas (absent technological improvements)
or increasing coverage in very rural areas. This, in combination with the relatively
indirect link between customer experience and investment and the inability to
generate incremental revenues directly from those particular customers who
benefit from specific investments, may lead to individual network operators
choosing not to deploy incremental investments in geographies with very low
traffic densities and being unable to deploy additional capacity in high traffic
areas. As a result the user experience may be degraded both in very high traffic
areas (for example transport hubs) and very low traffic areas (highly rural areas).
3.4 Market outcomes
Current delivery of mobile services
Competition has encouraged operators to deliver networks with increasing
performance, coverage and capacity, by deploying more sites, spectrum and
better technology, while controlling costs in order to offer competitive pricing. In
some cases this has been through co-operation between operators in network
deployment. However, competition has not necessarily delivered ubiquitous
coverage as the benefits to operators, through increased profits, has been lower
than the costs of extending coverage. As such, policy intervention has been
required to achieve a level of coverage above that which would be achieved
otherwise.
The predominant service provided over current mobile networks (in terms of
traffic and revenues) is mobile broadband (MBB) delivered to smartphones. 20
20
See Ofcom CMR – https://www.ofcom.org.uk/__data/assets/pdf_file/0017/105074/cmr-2017-uk.pdf
frontier economics 17UK Mobile Market Dynamics
MBB supports a wide range of applications including email, messaging, social
media and music and video streaming. The predominant application in terms of
traffic over mobile networks is currently video streaming21, due to the relatively
high bandwidths required and the long duration of video streaming sessions. The
majority of data delivered to smartphones is delivered over WiFi connections (e.g.
at home, at work or from public hotspots), rather than the mobile networks. 22
Ofcom suggests that this may be due to users having unlimited fixed data
allowances (compared to limited data allowances in mobile bundles) and
potentially due to fixed broadband offering a more reliable connection.
MBB is delivered on a ‘best effort’ basis with no explicit or implicit guarantees of
performance in terms of bandwidth and latency, with large variations over time
and location. Service quality tends to be poorer both in dense urban
environments, due to congestion and in rural areas, due to gaps in coverage. The
best effort nature of 4G MBB services limits the use cases that can be delivered
to those which are not ‘mission critical’.
Outcomes for consumers
Competition combined with the rapid rate of innovation in mobile networks has
resulted in significant gains for consumers with rapid increases in penetration,
initially of mobile voice and latterly of mobile broadband, and significant increases
in data traffic and user download (and upload) speeds.
21
See Ofcom CMR - https://www.ofcom.org.uk/research-and-data/multi-sector-research/cmr/cmr-
2017/interactive/mobile-research-app
22
See Ofcom CMR – 59.9% of apps sessions delivered over WiFi - https://www.ofcom.org.uk/research-and-
data/multi-sector-research/cmr/cmr-2017/interactive/mobile-research-app
frontier economics 18UK Mobile Market Dynamics
Figure 5 Mobile ARPU and usage
Weighted average monthly prices for average mobile usage baskets
£ per month (excluding handsets)
20
15
10 20.76
19.03 18.04 18.44 18.36
5
0
2013 2014 2015 2016 2017
Average mobile usage
180 2
160
Minutes and messages
140 1.5
120
Data (GB)
100
1
80
60
40 0.5
20
0 0
2013 2014 2015 2016 2017
Minutes SMS Data GB
Source: Frontier based on Ofcom - Pricing trends for communications services in the UK (Figure 4)
As shown in Figure 5 above, the significant increases in usage (made possible by
the increases in penetration and speeds) has occurred despite mobile average
revenue per subscriber remaining largely static, implying that unit costs (per
traffic) have been falling.
However, national regulatory authorities (NRAs) as well as governments have
recognised that commercial incentives alone may not lead to a level of coverage
consistent with public policy objectives and have used coverage obligations,
typically tied to spectrum licence awards, to increase coverage above that which
operators would have built otherwise. Figure 6 below illustrates that coverage of
all mobile services (both indoor and outdoor) has been increasing meaning
consumers have benefitted from greater access to mobile services. However,
coverage of some mobile services, particularly 4G services which offer higher
speeds, is below other services and coverage is not universal. Whilst the majority
of premises are covered by mobile services, full geographic coverage, which is
costly to achieve, remains behind indoor coverage.
frontier economics 19UK Mobile Market Dynamics
Figure 6 Coverage of mobile services
Indoor
Uk indoor coverage from all operators,
100% 90% 92%
85% 85%
80% 88%
85%
77% 80%
60% 68%
premises
58%
40%
40%
20%
0% 12%
Jun-15 Jun-16 Jun-17 Ja n-18
Outdoor
100%
Uk outdoor coverage from all operators,
76%
80% 70%
63%
58%
60% 70%
geographic area
63%
57%
40% 52%
43%
38%
20%
3% 21%
0%
Jun-15 Jun-16 Jun-17 Ja n-18
Telephone call services 4G services Data services
Source: Frontier based on Ofcom – Connected nations update – Spring 2018 (Figures 2 and 3)
Performance compared to other countries
Whilst UK consumers appear to have benefitted from improving outcomes in the
mobile market, it is also relevant to consider how the UK performs relative to
other countries. Ofcom considers the performance of the UK mobile market
relative to a wide range of comparator countries in its International
Communications Market Review (ICMR). The latest available data (Figure 7
below) shows that the UK performs better than other European countries in the
sample in terms of population coverage of 3G and 4G networks, and of the
countries in the sample, is only outperformed by three countries, matching them
in terms of 4G population coverage and only 1% behind in terms of 3G
population coverage.
frontier economics 20UK Mobile Market Dynamics
Figure 7 3G/4G population coverage (end 2016)
100
100
100
100
100
100
100
100
Percentage of population in areas
100
100
100
100
99
99
99
99
99
99
99
98
98
98
98
97
95
94
94
94
93
92
100
90
84
served by 3G and 4G
90
80
75
75
80
71
65
70
60
50
40
24
30
20
10
0
NED
AUS
UK
IND
CHN
ITA
JPN
BRA
FRA
POR
KOR
POL
SWE
USA
RUS
NGA
ESP
NZD
GER
3G 4G
Source: Frontier based on Ofcom ICMR 2017 (Figure 33)
UK performance is slightly weaker in terms of 4G take up (as a proportion of
mobile subscriptions), ranking 7th out of the comparator countries, this is shown in
Figure 8 below. However, in terms of combined 3G and 4G, the UK ranks 5th out
of the comparator countries with 91% of subscriptions with access to these
technologies.
Figure 8 3G and 4G as a proportion of mobile subscriptions (end 2016)
100 100
100 95 93
90 91
3G and 4G as a proportion of all mobile
87 88
90 24 82 82 82
80 23 33 38 70 74 74
subscriptions (%) end 2016
70 41 63 61
13 23 44 54
60 57
54 55 56 48
50 25 49
29
40 76 34
31
67 62 62
30 57
51 50 19 47
20 43 39 38 22
32 31 28 27
10 26 25
15
9
0 1
4G 3G
Source: Frontier based on Ofcom ICMR 2017 (Figure 37)
Figure 9 illustrates that whilst UK consumers currently consume around 1.7GB of
data a month, predominantly on 4G networks, this is significantly lower than a
frontier economics 21UK Mobile Market Dynamics
number of other countries such as Sweden, South Korea and the USA where
consumption is more than double that of the UK.
Figure 9 Monthly data per capita (GB) 2016
6
per-capita monthly mobile data
5 1.7
volimes (GB): 2016
4
0.2
0.6
3 0.3
0.8
0.4
2 4 3.7
3.1 2.9 0.2
2.2 0.5 0.2 0.3
1 2.1 2.1 0.4
1.5 0.3 0.3
1.1 1.2 1.1 0.7 0.1
0.7 0.7 0.7 0.5 0.2 0.2
0 0.2 0.3 0.2 0.2 0.1
0.1
4G 2G/3G
Source: Frontier based on Ofcom ICMR 2017 (Figure 44)
The UK government recognises that whilst the UK has performed well on mobile
market outcomes so far, further interventions may be necessary for the UK to
take a leading position in terms of 5G developments due to the different or
increased challenges deployment will present. This is described in the following
sections.
frontier economics 22UK Mobile Market Dynamics
4 5G DEVELOPMENTS
In this section we discuss the development of 5G and how this differs to past
technologies. We consider the necessary spectrum and network architecture that
will be required for 5G networks.
4.1 Past technology developments
The nature of mobile networks means that, for users to take full advantage of
mobility, a common set of standards need to be supported across a wide
geographic scope, to allow users to use services over a wide area.
Technologies have been developed in ‘generations’ to ensure a common
baseline for interoperability between network and device equipment. While both
network equipment and terminals will evolve within generations to allow for
increased functionality, all terminals and equipment within a generation should be
interoperable (so current GSM networks will in theory support handsets from the
1990s). The use of multi-mode handsets since the introduction of 3G, with
devices being able to fall back to previous generations, has meant that coverage
in new generations can be built up slowly or be geographically limited.
First generation networks
The initial generation of analogue cellular networks included a range of
incompatible technologies which were deployed on a national (or in some cases
regional) basis. This approach had a number of disadvantages, as the lack of
economies of scale increased the cost of network and terminal equipment; and
users were not able to use their handsets on networks outside their home
country/region (‘roaming’).
The use of analogue technology also restricted the capacity of networks, due to
lack of compression of the voice signal, with each conversation using a dedicated
radio channel. In addition security was limited, with ‘cloning’ of handsets allowing
unauthorised access to the network and interception of calls being
straightforward.
2G networks
Second generation networks were designed to address the shortcomings of the
first generation of cellular networks, using digital technology and compression to
multiplex different calls on a single carrier. 2G networks also included strong
encryption to prevent cloning and interception.
In the EU, the GSM Directive imposed a single standard, by reserving key
spectrum for use with the European developed GSM standard. This approach
proved effective with the resulting economies of scale leading to GSM becoming
a de-facto global standard, with other 2G technologies having uptake limited to
specific regions, such as the Americas and Japan.
frontier economics 23UK Mobile Market Dynamics
GSM also allowed for limited data services in the form of short messaging
services (SMS) and circuit switched data (CSD). The GSM standards were later
developed to provide higher speed data services (so called 2.5G technology).
3G networks
While 2G technologies were primarily designed to offer voice services, the
increasing uptake of fixed data services meant that it was logical to move to
mobile technologies that gave greater weight to data services. The IMTS-2000
initiative by the ITU set out objectives to enable innovative applications and
services (e.g. multimedia entertainment, infotainment and location-based
services, among others). In addition new spectrum bands became available at
high frequencies (2.1GHz) to support these networks.
3G standards in Europe were based on evolutions of GSM technologies (e.g. a
common core network) by the 3rd Generation Partnership Project (3GPP). While
the first network in the UK was launched in 2003 by Three, widespread uptake
began around 2007 driven by improvements in the technology (high speed
packet access), increases in coverage and the widespread availability of
smartphones.
This led to a rapid take up of data services which in turn led to issues of
congestion. In addition the coverage of 3G networks was more limited than 2G
networks due to the relatively high frequency used and the fact that user
bandwidths fell off sharply towards the edge of cells.
4G networks
The 4G technology developed by the 3GPP, LTE, has become a single de-facto
global standard implemented across the globe. LTE provides a number of
advantages over 3G technologies:
a. An all IP packet switched network;
b. Increase spectral efficiency, leading to greater capacity;
c. Higher user bandwidth available; and
d. Ability to use a wide range of frequency bands to provide both high levels
of coverage (using low frequency) and high capacity (using high frequency
spectrum).
In the UK, the initial launch of 4G networks was delayed due to legal challenges
to the auction of new spectrum and the ability of existing operators to ‘re-farm’
existing spectrum. EE eventually launched in Autumn 2012, with the remaining
operators launching in 2013 having acquired spectrum in an auction that year.
However, once launched, the roll-out and take up of 4G (as shown in Figure 8)
has been far more rapid than 3G.
Other technologies
The standards used for mass market mobile services have increasingly been
used to deliver specific vertical applications such as railway communication
(GSM-R), communications for emergency services (e.g. the UK ESN based on
frontier economics 24UK Mobile Market Dynamics
4G LTE technology), taking advantage of economies of scope and replacing
other specialised networks such as TETRA for emergency services.
However, other wireless technologies have operated in parallel with cellular
networks. For indoor wireless broadband coverage, WiFi is predominantly used
rather than mobile networks. Even for smartphones, WiFi networks carry the
majority of traffic.
4.2 5G developments
IMT-2020 initiative
As noted above, mobile network technologies are introduced in a series of
generations at intervals of around a decade. The ITU has set out a series of
objectives and use cases for 5G technologies (IMT-2020).
The use cases are split into three main groups:
a. Enhanced mobile broadband (eMBB);
b. Massive machine type communications (mMTC) (Internet of things); and
c. Ultra-reliable low latency services (URLLC) for industrial uses and VR/AR.
The figure below illustrates some of the wider range of use cases that sit under
these groups.
Figure 10 Proposed 5G use cases
Enhanced Mobile Broadband
Gigabytes in a second
UHD screens, 3D video
Work and play in the cloud
Smart home
Augmented reality
Industry automation
Smart city
Future IMT
Mission critical application
Self driving car
Massive machine type Ultra-reliable and low
communications latency communications
Source: Frontier based on ITU
Increasing the use cases that can be supported by 5G networks should in theory
bring economic and commercial benefits due to economies of scope (with a
single network serving a number of uses) and scale (as an increased volume of
equipment will be needed reducing unit costs). As such the aim of 5G technology
frontier economics 25UK Mobile Market Dynamics
is not only to improve existing service offerings in terms of quality and cost, but
also to allow additional use cases to be served using 5G networks.
A relevant parallel is the transition from 2G to 3G technology which allowed the
mobile broadband use case to be added to the mobile voice and messaging use
case supported by 2G networks. In the same way that some of these 5G use
cases can be partially supported by developments of 4G technology (such as
IoT), MBB was also partially supported by 2.5G networks.
One significant difference compared to the transition from 2G to 3G is that while
MBB has been largely sold to the same customers who purchase voice services
(with voice and data services generally sold in a single bundle), the use cases
supported by 5G services are likely to be purchased by different customer
groups. For example IoT may be largely purchased by industrial users rather
than individuals. While this provides potential opportunities, in that mobile
services will not be subject to the budget constraints of households, it may
require different business models.
In order to meet all of these use cases with a single technology requires
improvements in a number of dimensions of network performance. This is
illustrated in the figure below, which shows the manifold areas in which 5G (IMT-
2020) should outperform 4G (IMT-advanced).
Figure 11 5G performance improvements compared to 4G
Peak data rate (Gbits/s)
20
Areas traffic capacity (Mbits/m2) User experienced data rate (Mbits/s)
10 100
1 10
IMT-2020
0.1
IMT-advanced
100x 1x 1x 3x
Network energy efficiency Spectrum efficiency
350
105
106 500
10
Connection density (devices/km2) Mobility (km/h)
1
Latency (ms)
Source: Frontier based on ITU
5G standardisation
While the ITU has set out the high level objectives for 3G, 4G and 5G networks,
the ITU does not develop the technical standard(s) which will meet these
objectives. For 3G services there were a number of competing technical
standards, but for 5G there appears to be a single candidate technology being
developed by 3GPP. These standards will cover both the air interface and core
frontier economics 26UK Mobile Market Dynamics
network developments, which will build on the networks developed for previous
generations.
Key elements of the 5G standards will be:
5G New Radio (NR) for the air interface which should provide benefits in
terms of spectral efficiency and potentially coverage compared to 4G;
Network function virtualisation (NFV) which will allow network functionality to
be delivered using commodity hardware rather than specialised equipment;
and
Network slicing, which will provide virtually separate logical networks over a
single physical network allowing use cases with differing quality of service to
be deployed.
The 3GPP issues standards in ‘Releases’ which package together a number of
standards. The key releases are:
Release 15, which includes 5G phase 1, focussed on the eMBB use case and
was ‘frozen’ in June 201823;
Release 16, which will include 5G phase 2 aiming to meet all of the IMT-2020
requirements and which will be ‘frozen’ in 2020.
In parallel with the development of 5G standards, 3GPP will also further develop
4G standards, which will overlap to a degree with the functionality provided by
5G. In particular 4G developments share techniques such as massive MIMO or
small cells which could increase spectral efficiency and hence capacity. Given
these developments, the fact that existing 4G networks deliver a quality of
service which is sufficient for many existing use cases and the fact that there are
considerable sunk costs both in 4G network equipment and 4G terminal
equipment, mean it is likely that 4G networks and 5G networks will co-exist for a
period of time.
The first partial standards were frozen in December 2017 which defined the air
interface, 5G NR, but not the core network and only allowed for the 5G air
interface to be deployed alongside an existing 4G network (‘non standalone’ –
NSA) to provide additional capacity. Release 15 includes the full specification for
core network and allows for standalone 5G operation.
On a forward looking basis new equipment (antenna and RAN equipment) should
allow both 5G and 4G technologies to be used simultaneously and in the same
band.
Once the specification is frozen, equipment manufacturers can start to develop
and produce standards compliant network equipment and terminal equipment.
There will be a lead time (approximately 18 months) associated between the
standard being frozen and network equipment (or software upgrades in some
cases) being available on the market.
Mass market smartphone availability may lag behind network deployments due to
the need to miniaturise components for a smartphone form factor and ensure
power consumption is consistent with a reasonable battery life. While Huawei
23
http://www.3gpp.org/news-events/3gpp-news/1965-rel-15_news
frontier economics 27UK Mobile Market Dynamics
announced the first 5G smartphone will be available at the end of 2018, some
analysts are forecasting that 4G phones will be the norm for at least the next 5
years.24
Spectrum for 5G
The main bands identified by Ofcom to be allocated for 5G in the medium term
are 700 MHz, 3.4-3.8 GHz and 26 GHz. These are the bands promoted by the
Radio Spectrum Policy Group of the European Commission as part of their
strategic roadmap towards 5G for Europe.25 The characteristics of these bands
differ significantly:
e. 700 MHz spectrum, previously used for Digital Terrestrial Television
(DTT), is a lower frequency range than existing mobile communications
bands, which can provide wide coverage from existing (macro) sites.
However the limited amount of spectrum available and the limited spectral
efficiency due to the inability to use massive MIMO means that it provides
limited additional capacity or user bandwidth;
f. 26 GHz is a much higher frequency than existing mobile spectrum which
limits the effective coverage of sites using this frequency, however the
large amount of spectrum available and its suitability for massive MIMO
and the resulting gain in spectral efficiency could allow it to deliver high
bandwidths and traffic density using small cells.
g. 3.4 - 3.8 GHz lies between these two frequencies and offers relatively
large amounts of new spectrum, high spectral efficiency albeit with lower
effective range.
Cells for 5G
Given the spectrum available, 5G is likely to be delivered through a combination
of different cells:
Macro cells – which will deliver 5G coverage alongside previous technologies
relying on low frequency spectrum (mainly 700MHz) potentially in combination
with high frequency spectrum (3.4-3.8GHz);
Small cells – which will sit within the cell radii of Macro cells and provide
additional capacity through high frequency spectrum (3.6GHz spectrum); and
Spot/Pico cells – which will provide extra large capacity in high traffic areas
based on 26GHz spectrum.
24
https://www.strategyanalytics.com/strategy-analytics/blogs/devices/emerging-devices/emerging-
devices/2018/03/22/5g-handsets-are-just-around-the-corner-but-4g-2g-still-have-a-long-run-ahead-of-
them#.WyYxS8anGUk
25
https://circabc.europa.eu/sd/a/fe1a3338-b751-43e3-9ed8-a5632f051d1f/RSPG18-005final-
2nd_opinion_on_5G.pdf
frontier economics 28UK Mobile Market Dynamics
Figure 12 5G network cell types
Macro cell
Lower frequency microwave
5G/4G/3G coverage
Small cells Spot cells
Higher frequency microwave Millimeter-wave frequency
5G/4G, large capacity 5G/WLAN, extra-large capacity
Source: Frontier based on ITU
We focus on the delivery of 5G through macro cells and small cells in this report.
We use the term ‘small cells’ to capture a variety of different cell types including
all cell sizes below macros.
frontier economics 29UK Mobile Market Dynamics
5 EXPECTED LEVEL OF INVESTMENT INTO
5G UNDER THE STATUS QUO
In this section we discuss the expected development of 5G under the status quo.
This is the baseline scenario against which we consider the other potential
market models in the following sections of this report. We first consider the
investment into 5G we expect to happen under the status quo and the drivers of
this. We then consider how this investment is expected to take place and
potential gaps in deployment.
5.1 Expected drivers of initial roll-out of 5G
The business case for 5G is likely to evolve over time, with different use cases
developing at different rates depending on:
a. The point at which the necessary network technology is standardised and
then becomes commercialised in network equipment and terminals;
b. The rate at which the ‘ecosystem’ around the use cases develops
(particularly for ‘vertical’ apps aimed at industrial uses); and
c. The relative advantages of 5G compared to any existing technologies
used to deliver the use case.
Widespread roll-out of 5G technology appears very likely in the long term from
2020 onwards when standards providing for the full set of 5G capabilities are
agreed, as network equipment is refreshed. There will be consumer demand for
the ‘next generation’ almost irrespective of whether consumers will utilise the
enhancements offered by 5G compared to 4G, and this will drive MNOs to invest
in order to compete with rivals and protect market share/ attract new customers
as described in Section 3.3.
In addition, after standards are finalised, new network equipment will support
both 4G and 5G technologies allowing both 4G and 5G terminals to be supported
simultaneously in the same frequency bands with dynamic allocation of
resources between the two. Price differentials for 5G-capable equipment are
likely to rapidly narrow to the point where it is unlikely to be sufficient to
encourage operators to roll-out 4G-only equipment on a forward looking basis, in
the knowledge that 5G equipment will be the norm sooner or later.
However, as with the initial roll-out of 3G networks, the scope of 5G roll-out could
be more limited in the short term due to the high sunk costs associated with 4G
networks. 4G networks provide an acceptable quality of service for many
customers much of the time in terms of coverage and in cells which are not
congested, i.e. in cells where there are relatively few active customers at the
busiest time of day.
For example, many users may currently find existing networks sufficient to meet
their needs, i.e. sufficient throughput to allow good quality video streaming.
Vodafone reports a KPI of the proportion of user sessions with a throughput
frontier economics 30You can also read